. 2024 Aug 21:15:1444007.
doi: 10.3389/fimmu.2024.1444007. eCollection 2024.

AXL expression reflects tumor-immune cell dynamics impacting outcome in non-small cell lung cancer patients treated with immune checkpoint inhibitor monotherapy

Affiliations

AXL expression reflects tumor-immune cell dynamics impacting outcome in non-small cell lung cancer patients treated with immune checkpoint inhibitor monotherapy

Austin Rayford et al. Front Immunol. .

Abstract

Introduction: AXL receptor expression is proposed to confer immune-checkpoint inhibitor (ICI)-resistance in non-small cell lung cancer (NSCLC) patients. We sought to interrogate AXL expression in conjunction with mutational and tumor-microenvironmental features to uncover predictive mechanisms of resistance in ICI-treated NSCLC patients.

Methods: Tumor samples from 111 NSCLC patients treated with ICI-monotherapy were analyzed by immunohistochemistry for tumor- and immune-AXL expression. Subsets of patients were analyzed by whole-exome sequencing (n = 44) and imaging mass cytometry (n = 14). Results were related to ICI-outcome measurements.

Results: Tumor-cell AXL expression correlated with aggressive phenotypic features including reduced OS in patients treated with ICIs (P = 0.04) after chemotherapy progression, but conversely associated with improved disease control (P = 0.045) in ICI-treated, PD-L1 high first-line patients. AXL+ immune-cell infiltration correlated with total immune-cell infiltration and improved overall outcomes (PFS: P = 0.044, OS: P = 0.054). Tumor-cell AXL-upregulation showed enrichment in mutations associated with PD-L1-upregulation and ICI-response such as MUC4 and ZNF469, as well as adverse mutations including CSMD1 and LRP1B which associated with an immune-suppressed tumor phenotype and poor ICI prognosis particularly within chemotherapy-treated patients. Tumor mutational burden had no effect on ICI-outcomes and was associated with a lack of tumor-infiltrating immune cells. Spatial-immunophenotyping provided evidence that tumor-cell AXL-upregulation and adverse mutations modulate the tumor microenvironment in favor of infiltrating, activated neutrophils over anti-tumor immune-subsets including CD4 and CD8 T-cells.

Conclusion: Tumor-cell AXL-upregulation correlated with distinct oncotypes and microenvironmental immune-profiles that define chemotherapy-induced mechanisms of ICI-resistance, which suggests the combination of AXL inhibitors with current chemoimmunotherapy regimens can benefit NSCLC patients.

Keywords: AXL receptor tyrosine kinase; NSCLC; biomarker; immunotherapy resistance; tumor microenvironment.


Conflict of interest statement

JL and DM are founders of BerGenBio ASA. JL and AR were previously employed by BerGenBio ASA, and DM is currently employed by BerGenBio ASA. The remaining authors declare that the research was conducted in the absence of any commercial or financial relationships that could be construed as a potential conflict of interest.

Figures

Figure 1
Figure 1
AXL expression in tumor cells (tAXL) associates with PD-L1-upregulation, non-squamous histology and an aggressive cancer phenotype. (A) Boxplot of tAXL expression (AXL Hscore) in first-line (1L, cyan) and beyond first-line (2L, red) tumor samples split by PD-L1 TPS (low, 1-49%; high, ≥50%). (B, C) Boxplots of AXL Hscores in ECOG PS 2-3 vs 0-1 patients (B) and in non-squamous vs squamous tumors (C). (D), Scatter plot of AXL Hscore vs baseline tumor size as an ordinal variable. (E–G) In tAXL-positive tumors, boxplots show higher AXL Hscores in metastatic versus primary tumor samples (E) and in patients with vs without brain metastases (F), and scatter plot shows AXL Hscore correlated with starting CRP level as an ordinal variable (G). p-values in boxplots and scatterplots from Mann-Whitney U test and Spearman correlation, respectively.
Figure 2
Figure 2
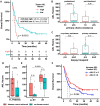
AXL expression on tumor cells and tumor-infiltrating immune cells is related to outcome measurements in ICI-treated NSCLC patients. (A) Overall Survival (OS) of 2L-ICI patients stratified by high- vs low tAXL expression using an optimal cutpoint of Hscore >105 (95% confidence-interval in brackets). (B, C) Boxplots of AXL Hscores in tumor samples obtained before or after 1L-chemotherapy, stratified by primary chemoresistance (B) or biopsy timepoint (C). (D, E) Boxplots of AXL Hscores in 1L-patients stratified by disease control (D) and within 1L-subgroups with or without radiotherapy (RT) before/during ICI treatment (E). (F) OS of all AXL IC-evaluable patients (n = 107) stratified by presence of AXL+ tumor-infiltrating immune cells (AXL IC>0). p-values in boxplots and Kaplan-Meier plots from Mann-Whitney U test and log-rank test, respectively.
Figure 3
Figure 3
Mutational landscape of NSCLC patients. (A) Oncoplot of the top 10 most frequently-mutated genes and relevant mutations from the literature and current analysis. Patient columns are stratified by presence versus absence of AXL+ infiltrating immune cells. (B) Boxplot of non-synonymous tumor mutational burden (TMB, mutations per megabase) in AXL IC-negative versus -positive patients. (C) Enrichment plot of gene mutations that occur significantly more frequently (X2 p<0.05) in PDL1 TPS-high, AXL Hscore-high (Hscore >50) or double-positive patient groups.
Figure 4
Figure 4
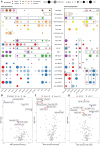
Association of gene mutations with ICI outcomes and biomarker status. UpSet plot showing gene mutations that were significantly (p<0.05) enriched in patient groups or associated with PFS or OS in multivariate analysis of all WES patients or univariate analysis within 2L-PD-L1 TPS-high and -low subgroups. Each column represents a set of gene mutations that was significant in a specific combination of one-or-more survival or enrichment analyses. Color represents whether a mutation was associated with improved PFS, OS, or disease control (green); reduced PFS, OS, no disease control (red); or only associated with biomarkers or metastases in more than one organ system (multiorgan mets) (blue). Right barplot shows the total number of significant gene mutations (hits) in each analysis. For all biomarker groups (PD-L1, AXL Hscore, AXL IC, and TMB), there were no enriched gene mutations in the opposing group (e.g. PD-L1 TPS-low).
Figure 5
Figure 5
Identity and composition of cell-types in NSCLC tumor samples. (A) Heatmap of mean phenotypic marker expression (min-max-scaled) in each of the 14 annotated cell-types detected by IMC. (B, C) Dotplots showing total abundance of each cell-type relative to all cells (whole-tissue) (B) and proportion of each immune cell-type relative to only immune cells in whole-tissue (C). (D, E) Single-cell segmented IMC images colored by cell-type in a non-squamous, ICI OS-low patient with high tAXL expression (Hscore=170) (D) and in a squamous, ICI OS-high, AXL Hscore-negative patient (E). Scale bars in μm.
Figure 6
Figure 6
The cell-type composition and functional state of specific cell types associates with clinical and molecular features. (A) Bubble-plot showing enrichment of cell-type abundance (left) and immune proportion (right) of cell-types in tumor cores stratified by clinical or molecular features. Circle size represents the degree of significance and color represents the group in which the enrichment occurs. Solid circles represent enrichment in the whole tissue area (all cells) while transparent circles represent enrichment within the tumor boundary (intratumoral cells). (B–D) Volcano plots of significance (p-value) versus mean protein expression (fold-change) show differentially-expressed state markers within each cell-type (cutoff: p<0.05, Mann-Whitney) between tumor cores stratified by ICI survival-low (purple) versus -high (green) (B), AXL Hscore-high (Hscore >50, red) versus -low (Hscore <50, blue) (C), and AXL IC-positive (AXLIC ≥1, red) versus -negative (AXLIC <1, blue) (D). (B,D) generated from intratumoral cells; (C) generated from all cells.

Similar articles

Cited by

References

    1. Garon EB, Rizvi NA, Hui R, Leighl N, Balmanoukian AS, Eder JP, et al. . Pembrolizumab for the treatment of non-small-cell lung cancer. N Engl J Med. (2015) 372:2018–28. doi: 10.1056/NEJMoa1501824 - DOI - PubMed
    1. Litchfield K, Reading JL, Puttick C, Thakkar K, Abbosh C, Bentham R, et al. . Meta-analysis of tumor- and T cell-intrinsic mechanisms of sensitization to checkpoint inhibition. Cell. (2021) 184:596–614.e14. doi: 10.1016/j.cell.2021.01.002 - DOI - PMC - PubMed
    1. Jardim DL, Goodman A, de Melo Gagliato D, Kurzrock R. The challenges of tumor mutational burden as an immunotherapy biomarker. Cancer Cell. (2021) 39:154–73. doi: 10.1016/j.ccell.2020.10.001 - DOI - PMC - PubMed
    1. Sharma P, Hu-Lieskovan S, Wargo JA, Ribas A. Primary, adaptive, and acquired resistance to cancer immunotherapy. Cell. (2017) 168:707–23. doi: 10.1016/j.cell.2017.01.017 - DOI - PMC - PubMed
    1. Engelsen AST, Lotsberg ML, Abou Khouzam R, Thiery JP, Lorens JB, Chouaib S, et al. . Dissecting the role of AXL in cancer immune escape and resistance to immune checkpoint inhibition. Front Immunol. (2022) 13:869676. doi: 10.3389/fimmu.2022.869676 - DOI - PMC - PubMed

MeSH terms