

Identification and Validation of Hub Genes and Construction of miRNA-Gene and Transcription Factor-Gene Networks in Adipogenesis of Mesenchymal Stem Cells
- PMID: 39238829
- PMCID: PMC11377116
- DOI: 10.1155/2024/5789593
Identification and Validation of Hub Genes and Construction of miRNA-Gene and Transcription Factor-Gene Networks in Adipogenesis of Mesenchymal Stem Cells
Abstract
Background: Adipogenic differentiation stands as a crucial pathway in the range of differentiation options for mesenchymal stem cells (MSCs), carrying significant importance in the fields of regenerative medicine and the treatment of conditions such as obesity and osteoporosis. However, the exact mechanisms that control the adipogenic differentiation of MSCs are not yet fully understood.
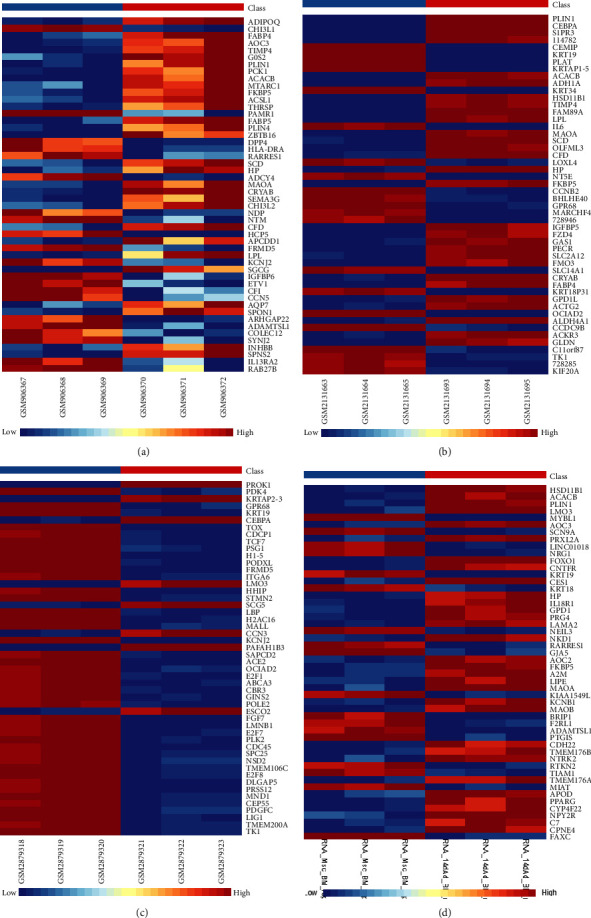
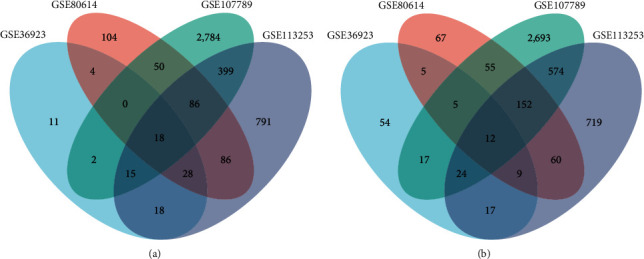
Materials and methods: We procured datasets, namely GSE36923, GSE80614, GSE107789, and GSE113253, from the Gene Expression Omnibus database. These datasets enabled us to perform a systematic analysis, including the identification of differentially expressed genes (DEGs) pre- and postadipogenic differentiation in MSCs. Subsequently, we conducted an exhaustive analysis of DEGs common to all four datasets. To gain further insights, we subjected these overlapped DEGs to comprehensive gene ontology enrichment and Kyoto Encyclopedia of Genes and Genomes pathway analyses. Following the construction of protein-protein interaction (PPI) networks, we meticulously identified a cohort of hub genes pivotal to the adipogenic differentiation process and validated them using real-time quantitative polymerase chain reaction. Subsequently, we ventured into the construction of miRNA-gene and TF-gene interaction networks.
Results: Our rigorous analysis revealed a total of 18 upregulated DEGs and 12 downregulated DEGs that consistently appeared across all four datasets. Notably, the peroxisome proliferator-activated receptor signaling pathway, regulation of lipolysis in adipocytes, and the adipocytokine signaling pathway emerged as the top-ranking pathways significantly implicated in the regulation of these DEGs. Subsequent to the construction of the PPI network, we identified and validated 10 key node genes, namely IL6, FABP4, ADIPOQ, LPL, PLIN1, RBP4, ACACB, NT5E, KRT19, and G0S2. Our endeavor to construct miRNA-gene interaction networks led to the discovery of the top 10 pivotal miRNAs, including hsa-mir-27a-3p, hsa-let-7b-5p, hsa-mir-1-3p, hsa-mir-124-3p, hsa-mir-155-5p, hsa-mir-16-5p, hsa-mir-101-3p, hsa-mir-21-3p, hsa-mir-146a-5p, and hsa-mir-148b-3p. Furthermore, the construction of TF-gene interaction networks revealed the top 10 critical TFs: ZNF501, ZNF512, YY1, EZH2, ZFP37, ZNF2, SOX13, MXD3, ELF3, and TFDP1.
Conclusions: In summary, our comprehensive study has successfully unraveled the pivotal hub genes that govern the adipogenesis of MSCs. Moreover, the meticulously constructed miRNA-gene and TF-gene interaction networks are poised to significantly augment our comprehension of the intricacies underlying MSC adipogenic differentiation, thus providing a robust foundation for future advances in regenerative biology.
Copyright © 2024 Miaomiao Dai et al.
Conflict of interest statement
The authors declare that the research was conducted in the absence of any commercial or financial relationships that could be construed as a potential conflict of interest.
Figures


Similar articles
-
Screening for genes, miRNAs and transcription factors of adipogenic differentiation and dedifferentiation of mesenchymal stem cells.J Orthop Surg Res. 2023 Jan 17;18(1):46. doi: 10.1186/s13018-023-03514-0. J Orthop Surg Res. 2023. PMID: 36647068 Free PMC article.
-
TGF-Beta Induced Key Genes of Osteogenic and Adipogenic Differentiation in Human Mesenchymal Stem Cells and MiRNA-mRNA Regulatory Networks.Front Genet. 2021 Nov 25;12:759596. doi: 10.3389/fgene.2021.759596. eCollection 2021. Front Genet. 2021. PMID: 34899844 Free PMC article.
-
Identification of miRNA-target gene regulatory networks in liver fibrosis based on bioinformatics analysis.PeerJ. 2021 Aug 6;9:e11910. doi: 10.7717/peerj.11910. eCollection 2021. PeerJ. 2021. PMID: 34434654 Free PMC article.
-
MicroRNAs-mediated regulation of the differentiation of dental pulp-derived mesenchymal stem cells: a systematic review and bioinformatic analysis.Stem Cell Res Ther. 2023 Apr 11;14(1):76. doi: 10.1186/s13287-023-03289-5. Stem Cell Res Ther. 2023. PMID: 37038220 Free PMC article.
-
Adipogenic miRNA and meta-signature miRNAs involved in human adipocyte differentiation and obesity.Oncotarget. 2016 Jun 28;7(26):40830-40845. doi: 10.18632/oncotarget.8518. Oncotarget. 2016. PMID: 27049726 Free PMC article. Review.
Cited by
-
White Adipocyte Stem Cell Expansion Through Infant Formula Feeding: New Insights into Epigenetic Programming Explaining the Early Protein Hypothesis of Obesity.Int J Mol Sci. 2025 May 8;26(10):4493. doi: 10.3390/ijms26104493. Int J Mol Sci. 2025. PMID: 40429638 Free PMC article. Review.
References
LinkOut - more resources
Full Text Sources
Research Materials
Miscellaneous
