. 2024 Aug 13;6(5):fcae261.
doi: 10.1093/braincomms/fcae261. eCollection 2024.

Connectivity defines the distinctive anatomy and function of the hand-knob area

Affiliations

Connectivity defines the distinctive anatomy and function of the hand-knob area

Ahmad Beyh et al. Brain Commun. .

Abstract

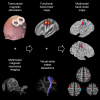
Control of the hand muscles during fine digit movements requires a high level of sensorimotor integration, which relies on a complex network of cortical and subcortical hubs. The components of this network have been extensively studied in human and non-human primates, but discrepancies in the findings obtained from different mapping approaches are difficult to interpret. In this study, we defined the cortical and connectional components of the hand motor network in the same cohort of 20 healthy adults and 3 neurosurgical patients. We used multimodal structural magnetic resonance imaging (including T1-weighted imaging and diffusion tractography), as well as functional magnetic resonance imaging and navigated transcranial magnetic stimulation (nTMS). The motor map obtained from nTMS compared favourably with the one obtained from functional magnetic resonance imaging, both of which overlapped well within the 'hand-knob' region of the precentral gyrus and in an adjacent region of the postcentral gyrus. nTMS stimulation of the precentral and postcentral gyri led to motor-evoked potentials in the hand muscles in all participants, with more responses recorded from precentral stimulations. We also observed that precentral stimulations tended to produce motor-evoked potentials with shorter latencies and higher amplitudes than postcentral stimulations. Tractography showed that the region of maximum overlap between terminations of precentral-postcentral U-shaped association fibres and somatosensory projection tracts colocalizes with the functional motor maps. The relationships between the functional maps, and between them and the tract terminations, were replicated in the patient cohort. Three main conclusions can be drawn from our study. First, the hand-knob region is a reliable anatomical landmark for the functional localization of fine digit movements. Second, its distinctive shape is determined by the convergence of highly myelinated long projection fibres and short U-fibres. Third, the unique role of the hand-knob area is explained by its direct action on the spinal motoneurons and the access to high-order somatosensory information for the online control of fine movements. This network is more developed in the hand region compared to other body parts of the homunculus motor strip, and it may represent an important target for enhancing motor learning during early development.

Keywords: TMS; connectivity; hand knob; motor; tumour.


Conflict of interest statement

The authors report no competing interests.

Figures
Graphical Abstract
Graphical Abstract
Figure 1
Figure 1
Group functional and tractography cortical maps. All panels show a left hemisphere representation of group probability maps. (A) Cortical TMS stimulation loci that led to MEPs in hand muscles. (B) Observed fMRI activations during the finger tapping task. (C) Cortical projections of the precentral and postcentral projection fibres. (D) Cortical projections of the U-fibres connecting precentral and postcentral gyri.
Figure 2
Figure 2
Latencies and amplitudes of MEPs obtained through nTMS. The standardized (Z-score) latencies and amplitudes of MEPs obtained through nTMS applied to the precentral and postcentral gyri are compared in these plots. These scores were calculated separately for each participant to account for expected individual differences in latencies and amplitudes. In the first row, the probability distribution for latencies (A) and amplitudes (B) is shown for each hemisphere. In C and D, the proportion of precentral and postcentral MEPs are directly compared for each Z-score range. On average, latencies of precentral MEPs were significantly shorter than those of postcentral MEPs in both hemispheres [left: t(19) = -3.5, P < 0.001; right: t(19) = -3.36, P < 0.001; Table 1]. MEP amplitudes were also significantly higher in the precentral gyrus in both hemispheres [left: t(19) = 2.34, P = 0.019; right: t(19) = 2.91, P = 0.004; Table 1]. E shows a boundary plot of the pooled data from all subjects and both hemispheres. The overall observation from these plots is that, although the latencies and amplitudes of MEPs that follow stimulation of the precentral and postcentral gyri overlap substantially, the stimulation sites of the MEPs with the shortest latencies and largest amplitudes are more frequently localized in the precentral gyrus. LH: left hemisphere; RH: right hemisphere.
Figure 3
Figure 3
Multimodal overlap on the cortical surface. The four different maps of interest are compared in each hemisphere. In A, nTMS and fMRI maps are overlaid on the cortical surface for direct comparison. Unlike the TMS scores (Table 1 and Fig. 2), fMRI Z-scores of the precentral gyrus were not statistically different from those of the postcentral gyrus in either hemisphere [left: t(19) = 0.54, P = 0.590, n.s.; right: t(19) = 0.79, P = 0.437, n.s.; Table 1]. These functional maps are overlaid as contours on top of the projections of the precentral–postcentral U-fibres in B and those of the projection fibres in C. Percentage overlap scores for these displays are reported in Table 3.
Figure 4
Figure 4
Interhemispheric comparisons. In panels A–D, the cortical maps of the left (blue) and right (red) hemispheres are overlaid on a left hemisphere cortical representation to visualize their correspondence. E shows the Dice coefficients of the same comparisons.
Figure 5
Figure 5
Clinical examples of the integration of the structural and functional maps with intraoperative neuromonitoring data. We assessed the relationship between functional nTMS and fMRI maps and tractography cortical projections in three patients who underwent tumour resection surgery. For each patient, the left panel highlights the relationship between the cortical termination of the somatosensory projection tracts (purple–yellow heatmaps), the nTMS (dark blue dots) and fMRI (light blue contour) maps, while the right panel does the same for the termination of the U-fibres (red–white heatmaps). The middle panel shows an intraoperative view of the exposed brain with the locations of the intraoperative cortical stimulations that were performed. These locations are also identified and numbered on the cortical surface reconstructions. Patient 1 tags: 1, 2 and 3—hand and forearm; 4 and 5—hand; x—no response. Patient 2 tags: 1, 2 and 3—hand and forearm; 4 and 5—foot and leg. Patient 3 tags: 1 and 2—lower limb and foot; 3, 4, 5, 6 and 7—hand and forearm; 8: hand only.

References

    1. Déjérine JJ, Déjérine-Klumpke A. Anatomie des Centres Nerveux. Vol. 1. Rueff et Cie; 1895.
    1. Meynert T. Psychiatry: A clinical treatise on diseases of the fore-brain based upon a study of its structure, functions, and nutrition. G.P. Putnam’s Sons; 1885.
    1. Rosett J. Intercortical systems of the human cerebrum. Columbia University Press; 1933.
    1. Schmahmann JD, Pandya DN. Fiber pathways of the brain. Oxford University Press; 2006.
    1. d’Albis MA, Guevara P, Guevara M, et al. Local structural connectivity is associated with social cognition in autism spectrum disorder. Brain. 2018;141(12):3472–3481. - PubMed

LinkOut - more resources