. 2024 Aug 26;6(5):fcae288.
doi: 10.1093/braincomms/fcae288. eCollection 2024.

Comparative analysis of neurofilaments and biomarkers of muscular damage in amyotrophic lateral sclerosis

Affiliations

Comparative analysis of neurofilaments and biomarkers of muscular damage in amyotrophic lateral sclerosis

Maximilian Vidovic et al. Brain Commun. .

Abstract

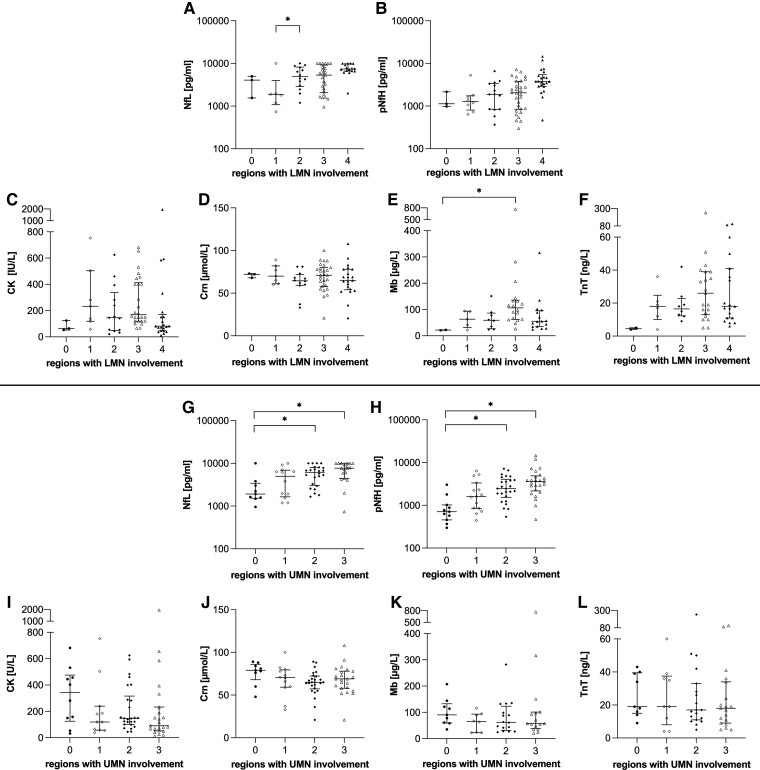
Diagnosis of the fatal neurodegenerative disease amyotrophic lateral sclerosis is challenging. Neurofilaments, indicative of neuronal damage, along with creatine kinase, creatinine, myoglobin, and troponin T, representing muscular damage, have been identified as promising fluid biomarkers. This study aims to comprehensively assess and compare their diagnostic and prognostic potential in a 'real-world' cohort of patients with amyotrophic lateral sclerosis. About 77 patients with amyotrophic lateral sclerosis and its clinical variants, and 26 age- and sex-matched controls with various neuromuscular and neurodegenerative diseases, were retrospectively included in this monocentric, cross-sectional study. Neurofilaments in cerebrospinal fluid and biomarkers of muscular damage in serum were measured and correlated with demographic features, motor function, survival time, clinical phenotypes, and the extent of upper and lower motor neuron involvement. Neurofilament, myoglobin, and troponin T concentrations were higher in patients with amyotrophic lateral sclerosis compared to disease controls. Higher neurofilament levels correlated with lower motor function and faster disease progression rate, while higher creatine kinase and creatinine concentrations were linked to preserved motor function. In contrast, troponin T elevation indicated poorer fine and gross motor functions. Increased neurofilament levels were associated with shorter survival, whereas biomarkers of muscular damage lacked survival correlation. Neurofilament concentrations were higher in classical amyotrophic lateral sclerosis than in progressive muscular atrophy, while myoglobin and troponin T levels were elevated in progressive muscular atrophy compared to primary lateral sclerosis. Neurofilaments were predominantly linked to upper motor neuron involvement. Our findings confirmed the robust diagnostic and prognostic value of neurofilaments in amyotrophic lateral sclerosis. Elevated neurofilament concentrations were associated with higher disease severity, faster disease progression, shorter survival, and predominant upper motor neuron degeneration. Biomarkers of muscular damage were inferior in distinguishing amyotrophic lateral sclerosis from other neuromuscular and neurodegenerative diseases. However, they may serve as complementary biomarkers and support in discriminating clinical variants of amyotrophic lateral sclerosis.

Keywords: ALS; amyotrophic lateral sclerosis; biomarkers; biomarkers of muscular damage; neurofilaments.


Conflict of interest statement

MV received travel expenses and non-financial support from ITF Pharma outside the submitted work. MO served as a scientific advisor for Axon, Biogen, Roche, Fujirebio. AH has received funding from the European Social Fonds, the Federal Ministry of Education and Research, and the Hermann und Lilly Schilling-Stiftung für medizinische Forschung im Stifterverband. He received honoraria for presentations/advisory boards from Amylyx, Desitin, and ITF Pharma. He has also received royalties from Elsevier Press and Kohlhammer. RG reports speaker honoraria from Biogen, Roche, Zambon, and research support from Biogen, and served on advisory boards for Biogen, Roche, Zambon, and ITF Pharma. The other authors declare that they have no competing interests that are relevant to the content of this article.

Figures

Graphical Abstract
Graphical Abstract
Figure 1
Figure 1
Nf and BMD in ALS and disease controls. Nf in ALS and disease controls (A–B). BMD in ALS and disease controls (C–F). Horizontal line shows median, whiskers illustrate interquartile range (0.25–0.75), and each icon represents an individual patient. Calculated by Mann–Whitney U-test. Significance levels: ***P < 0.001; ****P < 0.0001. ROC curves of Nf, and Nf combined with Mb or TnT for discrimination between ALS and disease controls (G). ROC curves of BMD for discrimination between ALS and disease controls (H). Dotted line: classifier reference line. ALS, amyotrophic lateral sclerosis; BMD, biomarkers of muscular damage; CK, creatine kinase; Crn, creatinine; Mb, myoglobin; Nf, neurofilaments; NfL, neurofilament light chain; pNfH, phosphorylated neurofilament heavy chain; TnT, troponin T.
Figure 2
Figure 2
Nf and BMD in relation to functional motor status. Correlations between Nf and the ALSFRS-R total score (A–B). Correlations between BMD and the ALSFRS-R total score (C–F). Regression line in blue. Each icon represents an individual patient. Calculated by Spearman’s partial rank correlation adjusted for sex, age, BMI, and disease duration; P values < 0.05 considered statistically significant and marked in bold. ALS, amyotrophic lateral sclerosis; ALSFRS-R, ALS Functional Rating Scale—revised form; BMD, biomarkers of muscular damage; CK, creatine kinase; Crn, creatinine; Mb, myoglobin; Nf, neurofilaments; NfL, neurofilament light chain; pNfH, phosphorylated neurofilament heavy chain; TnT, troponin T.
Figure 3
Figure 3
Nf and BMD in relation to clinical ALS phenotypes. Comparison of Nf between various clinical ALS phenotypes (A–B). Comparison of BMD between various clinical ALS phenotypes (C–F). Horizontal line shows median, whiskers illustrate interquartile range (0.25–0.75), and each icon represents an individual patient. Calculated by one-way ANCOVA considering ALS-PR as a covariate. Significance levels after Bonferroni-corrected post hoc analysis: *P < 0.05; ***P < 0.001. ALS, amyotrophic lateral sclerosis; ALS-PR, ALS progression rate; CK, creatine kinase; Crn, creatinine; Mb, myoglobin; Nf, neurofilaments; NfL, neurofilament light chain; pNfH, phosphorylated neurofilament heavy chain; PLS, primary lateral sclerosis; PMA, progressive muscular atrophy; TnT, troponin T.
Figure 4
Figure 4
Nf and BMD in relation to motor neuron involvement. Comparison of Nf between subgroups of patients with ALS regarding LMN involvement (A–B). Comparison of BMD between subgroups of patients with ALS regarding LMN involvement (C–F). Comparison of Nf between subgroups of patients with ALS regarding UMN involvement (G–H). Comparison of BMD between subgroups of patients with ALS regarding LMN involvement (I–L). Horizontal line shows median, whiskers illustrate interquartile range (0.25–0.75), and each icon represents an individual patient. Calculated by one-way ANCOVA considering ALS-PR and UMN or LMN involvement as covariates. Significance levels after Bonferroni-corrected post hoc analysis: *P < 0.05. ALS, amyotrophic lateral sclerosis; ALS-PR, ALS progression rate; CK, creatine kinase; Crn, creatinine; LMN, lower motor neuron; Mb, myoglobin; NfL, neurofilament light chain; pNfH, phosphorylated neurofilament heavy chain; TnT, troponin T; UMN, upper motor neuron.
Figure 5
Figure 5
Heatmap of biomarker measurements of 77 patients with ALS and clinical variants and 26 disease controls. A colour gradient from blue over grey to red is used to visualize the Z-score scaled measurement of each biomarker across the patient and control samples. Missing biomarker values are displayed in white. The columns of the heatmap represent the individual patient and control samples with their corresponding clinical phenotype ALS (purple), PMA (violet), PLS (magenta), and control (grey) shown above the heatmap by the clinical phenotype bar. Corresponding states of the upper and lower motor neurons are shown by the UMN (blue shades, white: missing value) and LMN bars (orange shades, white: missing value). Darker shades correspond to more involved UMN and LMN regions, respectively. The rows of the heatmap represent the individual measurements of the biomarkers. The columns and rows of the heatmap were clustered hierarchically using Ward’s algorithm in combination with Euclidean distance to group similar samples and biomarkers together. ALS, amyotrophic lateral sclerosis; CK, creatine kinase; Crn, creatinine; LMN, lower motor neuron; Mb, myoglobin; NfL, neurofilament light chain; pNfH, phosphorylated neurofilament heavy chain; PLS, primary lateral sclerosis; PMA, progressive muscular atrophy; TnT, troponin T; UMN, upper motor neuron.
Figure 6
Figure 6
Nf and BMD in relation to survival time. Kaplan–Meier survival curves of Nf (A–B). Kaplan–Meier survival curves of BMD (C–F). Patients were classified into two groups (low with concentration ≤ median, high with concentration > median). Event was defined as death or tracheostomy. Kaplan–Meier method with log-rank test was performed for differences between both groups. BMD, biomarkers of muscular damage; CK, creatine kinase; Crn, creatinine; Mb, myoglobin; Nf, neurofilaments; NfL, neurofilament light chain; pNfH, phosphorylated neurofilament heavy chain; TnT, troponin T.

References

    1. Brown RH, Al-Chalabi A. Amyotrophic lateral sclerosis. N Engl J Med. 2017;377(2):162–172. - PubMed
    1. Feldman EL, Goutman SA, Petri S, et al. Amyotrophic lateral sclerosis. Lancet Rheumatol. 2022;400(10360):1363–1380. - PMC - PubMed
    1. Goutman SA, Hardiman O, Al-Chalabi A, et al. Recent advances in the diagnosis and prognosis of amyotrophic lateral sclerosis. Lancet Neurol. 2022;21(5):480–493. - PMC - PubMed
    1. Vidovic M, Müschen LH, Brakemeier S, Machetanz G, Naumann M, Castro-Gomez S. Current state and future directions in the diagnosis of amyotrophic lateral sclerosis. Cells. 2023;12(5):736. - PMC - PubMed
    1. Irwin KE, Sheth U, Wong PC, Gendron TF. Fluid biomarkers for amyotrophic lateral sclerosis: A review. Mol Neurodegener. 2024;19(1):9. - PMC - PubMed

LinkOut - more resources