. 2024 Aug 22:11:1420308.
doi: 10.3389/fmolb.2024.1420308. eCollection 2024.

Obtention of viable cell suspensions from breast cancer tumor biopsies for 3D chromatin conformation and single-cell transcriptome analysis

Affiliations

Obtention of viable cell suspensions from breast cancer tumor biopsies for 3D chromatin conformation and single-cell transcriptome analysis

Aura Stephenson-Gussinye et al. Front Mol Biosci. .

Abstract

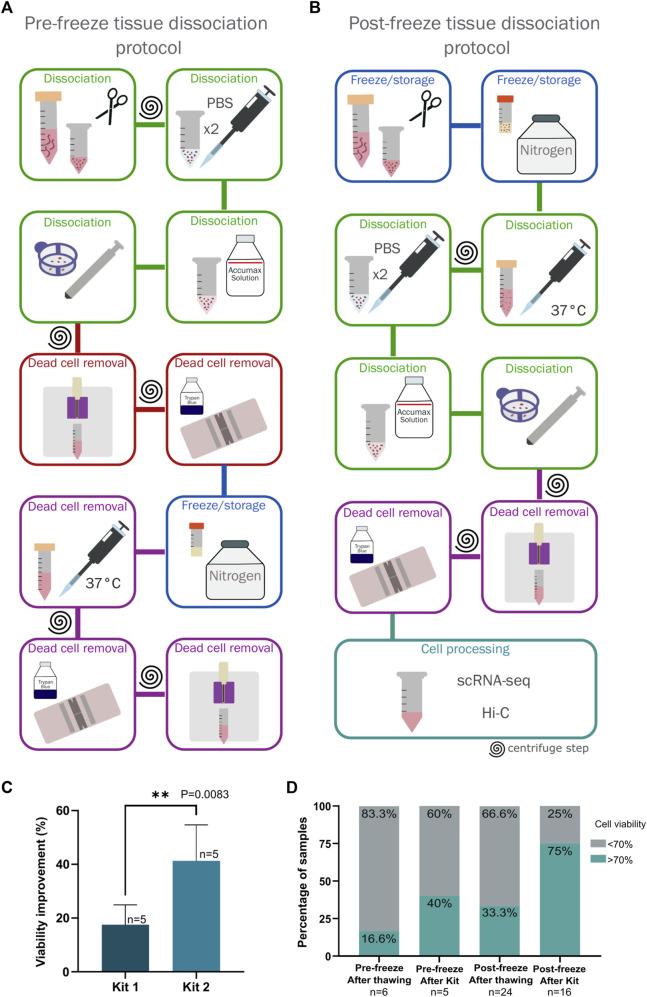
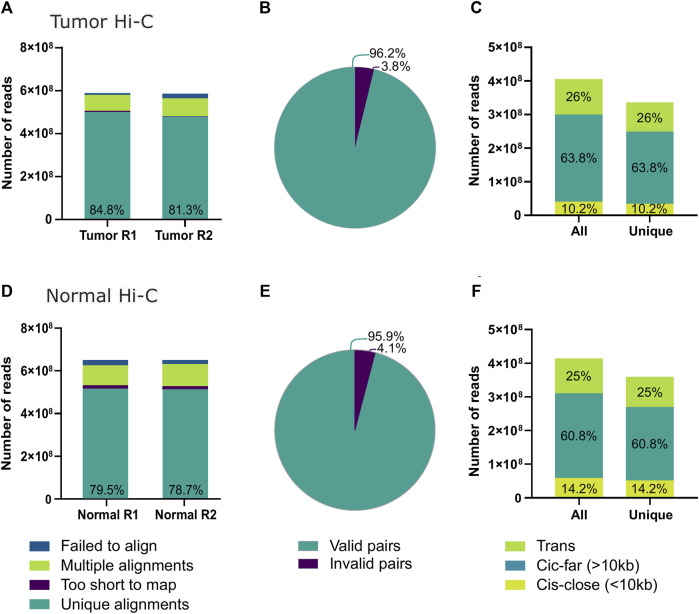
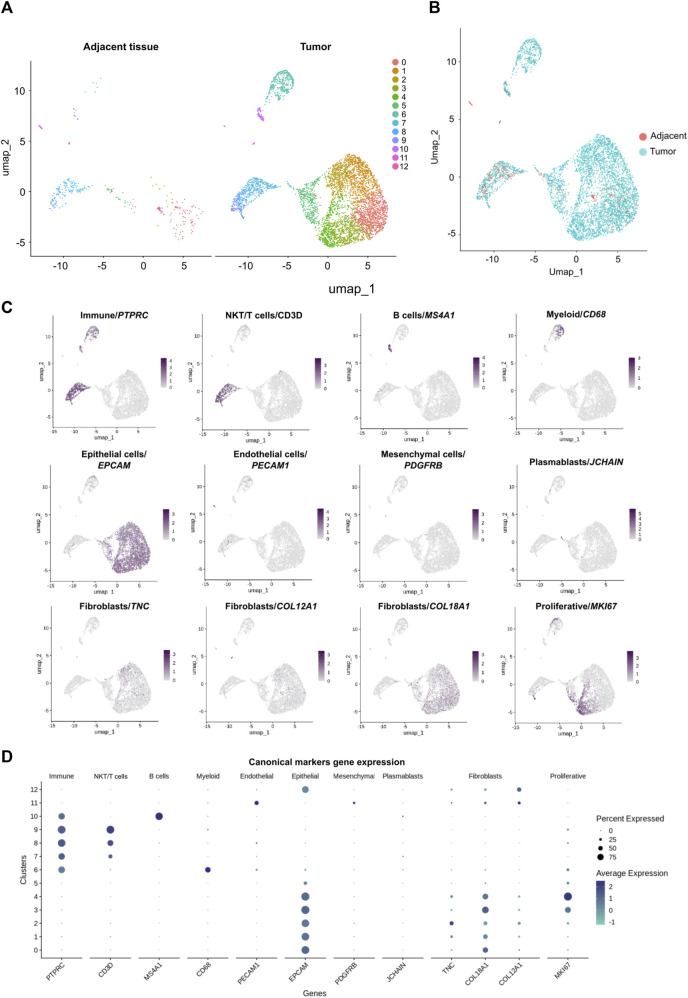
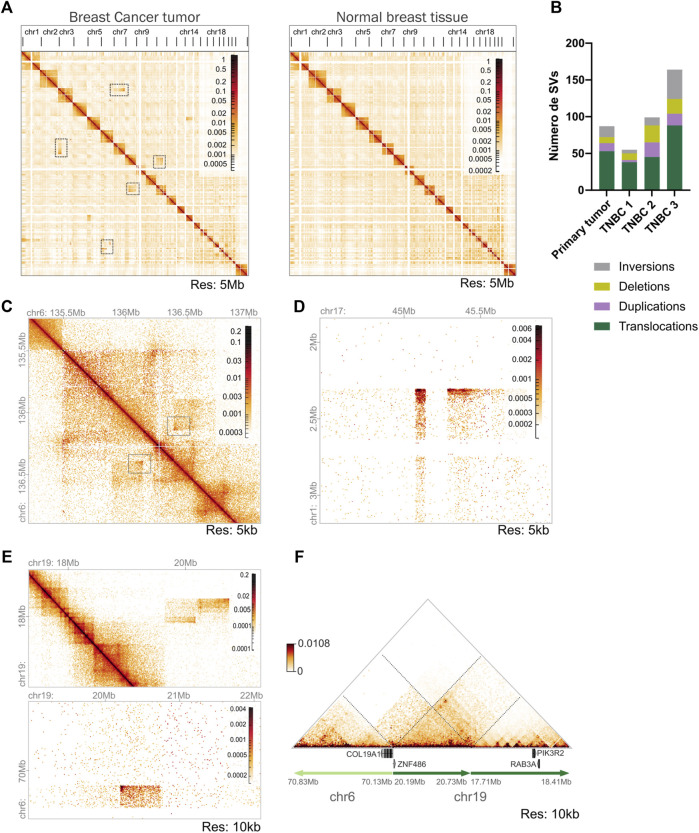
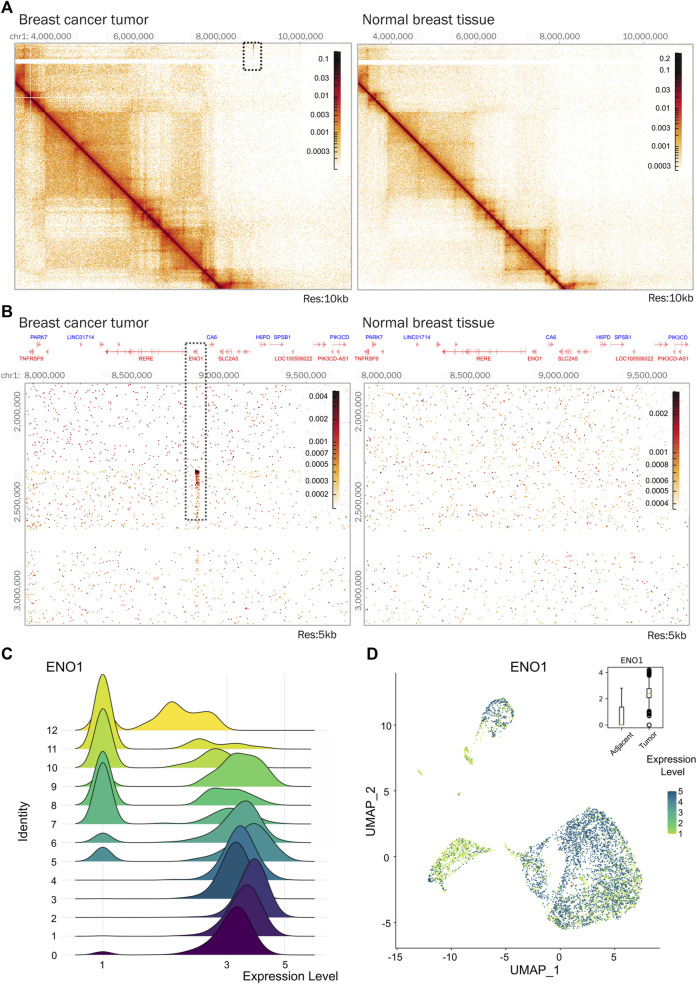
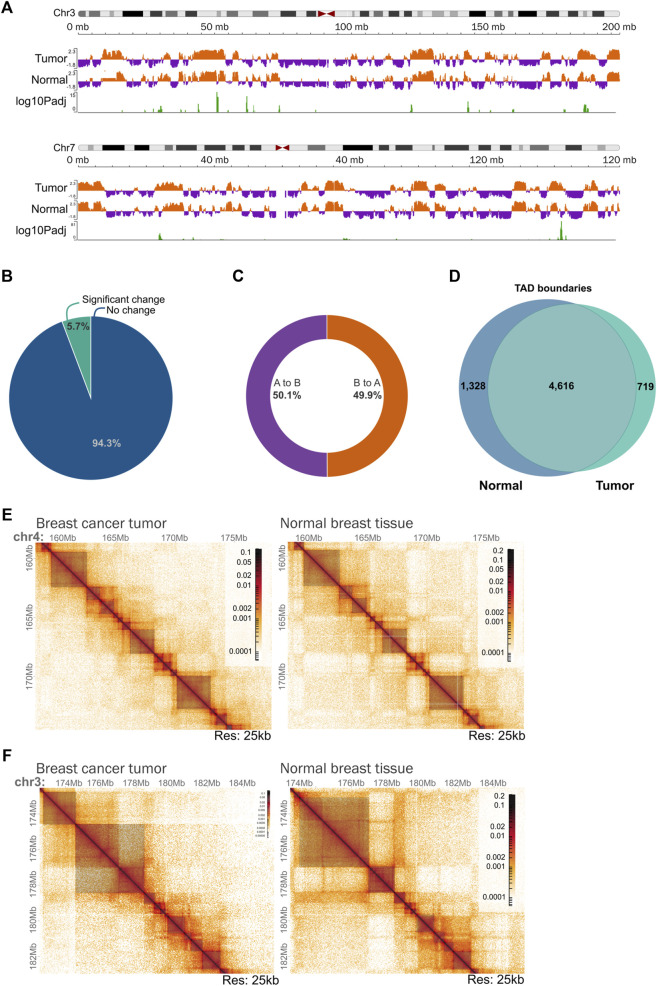
Molecular and cellular characterization of tumors is essential due to the complex and heterogeneous nature of cancer. In recent decades, many bioinformatic tools and experimental techniques have been developed to achieve personalized characterization of tumors. However, sample handling continues to be a major challenge as limitations such as prior treatments before sample acquisition, the amount of tissue obtained, transportation, or the inability to process fresh samples pose a hurdle for experimental strategies that require viable cell suspensions. Here, we present an optimized protocol that allows the recovery of highly viable cell suspensions from breast cancer primary tumor biopsies. Using these cell suspensions we have successfully characterized genome architecture through Hi-C. Also, we have evaluated single-cell gene expression and the tumor cellular microenvironment through single-cell RNAseq. Both technologies are key in the detailed and personalized molecular characterization of tumor samples. The protocol described here is a cost-effective alternative to obtain viable cell suspensions from biopsies simply and efficiently.

Keywords: 3D genome architecture; Hi-C; breast cancer; single cell RNA sequencing; structural variations (SVs).


Conflict of interest statement

The authors declare that the research was conducted in the absence of any commercial or financial relationships that could be construed as a potential conflict of interest. The author(s) declared that they were an editorial board member of Frontiers, at the time of submission. This had no impact on the peer review process and the final decision.

Figures

FIGURE 1
FIGURE 1
Comparison of two protocols for dissociation and freezing of breast cancer tumor biopsies. (A) Pre-freeze tissue dissociation protocol. The steps carried out to perform this protocol are indicated, highlighting in red the steps that were eliminated in the standardization process for the final protocol. (B) Post-freeze tissue dissociation protocol. The steps carried out in this protocol are indicated, this was established as the definitive protocol for processing and storing breast cancer tumor samples. (C) Comparison of cell viability using two dead cell removal kits. Kit 1 corresponds to the EasySep Dead Cell Removal Annexin V Kit (Stemcell technologies #17899) and Kit 2 corresponds to the Dead Cell Removal Kit (Miltenyi Biotec #130090101). Viability improvement was measured by subtracting the viability observed after one use of the kit minus viability observed before the kit processing. The difference between the kits was statistically significant via an unpaired t-test (p = 0.0083, n = 5). (D) Comparison of cell viability between the two tested protocols (Pre-freeze and post-freeze tissue dissociation protocols) comparing cell viability obtained immediately after thawing and disaggregating the sample (in the post-freeze protocol) and viability after using the dead cell removal kit.
FIGURE 2
FIGURE 2
Hi-C quality from the tumor biopsy using the post-freeze tissue dissociation protocol. (A) Number of successfully aligned sequencing reads from the tumor Hi-C to the GRCh38 reference genome. (B) Number of Hi-C reads identified as informative contacts for interaction matrix construction; within the category of invalid pairs wrong size sequences, circularized reads, non-ligated, re-ligated, and continuous sequences are included. (C) Total and unique reads from tumor Hi-C counts after PCR duplicate removal. Additionally, the percentages of contacts identified within less than 10 kb distance (Cis-close), more than 10 kb distance (Cis-far), or between different chromosomes (Trans) are shown. (D) Number of successfully aligned sequencing reads from the normal tissue Hi-C to the GRCh38 reference genome. (E) Number of normal tissue Hi-C reads identified as informative contacts for interaction matrix construction. (F) Total and unique reads from normal tissue Hi-C counts after PCR duplicate removal divided by contact distance.
FIGURE 3
FIGURE 3
Characterization of cell populations derived from the breast cancer tumor and the adjacent control tissue scRNA-seq data sets. (A) UMAP of the 390 cells from the adjacent tissue and UMAP of the 5,201 cells from the tumor colored by cell the cell clusters detected (0–12). (B) UMAP of 5,591 cells: 5,201 cells of tumor (blue cells) and 390 cells of adjacent tissue (red cells). (C) Identification of subpopulations with canonical markers and their expression across the clusters: PTPRC (CD45 + ) for immune cells; MKI67 for proliferative cells; CD3D for NKT/T cells; MS4A1 for B cells; CD68 for myeloid cells; PECAM1 for endothelial cells; EPCAM for epithelial cells; PDGFRB for mesenchymal cells and JCHAIN for plasmablasts. Also, additional markers were used to identify a particular subpopulation like fibroblasts with the expression of TNC, COL18A1 and COL12A1. (D) Canonical markers expression across the clusters.
FIGURE 4
FIGURE 4
Identification of SVs in the triple negative breast (TNBC) tumor using Hi-C data. (A) Whole-genome interaction matrices of the tumor tissue biopsy sample and previously published normal breast tissue. It is observed that the highest frequency of contacts is in cis in both samples. High-frequency interchromosomal interactions observed in tumor tissue and not in normal breast tissue are highlighted with boxes. Matrices constructed at 5 Mb resolution. (B) Number and classification of SVs found in the Hi-C tumoral sample processed and compared with the TNBC Hi-C data published by Kim et al. (2022). (C) Hi-C contact matrix showing a deletion in chromosome 6 identified by the SVs analysis. Resolution 5 kb. (D) Inter-chromosomal Hi-C matrix showing a translocation between chromosomes 1–17. Resolution 5 kb. (E) Intra and inter-chromosomal Hi-C contact matrices showing a complex SV formed involving a translocation between chromosomes 6–19 and a duplication in chromosome 19. (F) Reconstruction of the loci altered by a complex SV. Translocation between chromosomes 6–19 generates a gene fusion of COL191A and ZNF486 genes identified by EagleC analysis. Duplication in chromosome 19 harbors genes possibly related to tumoral activity.
FIGURE 5
FIGURE 5
ENO1 gene is amplified in the triple negative breast tumor. (A) Hi-C contact matrices comparing the region where gene ENO1 is located in tumor tissue and normal breast tissue. The area showing an interaction indicating amplification of genetic material in tumor tissue is marked with a square. Matrices at 10 kb resolution. (B) Zoom-in on the region showing an amplification pattern that co-localizes with the ENO1 gene locus in tumor tissue. Matrices at 5 kb resolution. (C) Distribution of ENO1 expression in tumor and adjacent tissue cells of breast cancer. (D) Density expression of ENO1 across the clusters. Expression is plotted on the box plot.
FIGURE 6
FIGURE 6
Chromatin organization of the triple negative breast tumoral genome at different scales. (A) Example of chromatin compartmentalization of two chromosomes (chr3 and chr7) between tumoral and normal tissue. (B) Percentage of the genome that changes significantly from compartment in the tumor in comparison with normal tissue. (C) Percentage of the changing chromatin that goes from A to B and B to A compartment in the tumor in comparison with normal tissue. (D) Conservation of TAD boundaries across the analyzed samples. TAD boundaries were calculated using TADlib. (E) Example of a region on chromosome 4 showing a very similar organization of Topologically Associating Domains (TADs) between tumor tissue and normal tissue. Dark gray squares represent TADs identified using TADlib. Matrices at 25 kb resolution. (F) Example of a region on chromosome 3 showing different TADs and compartmentalization organization between tumor tissue and normal tissue. Dark gray squares represent TADs identified using TADlib. Matrices at 25 kb resolution.

Similar articles

References

    1. Azizi E., Carr A. J., Plitas G., Cornish A. E., Konopacki C., Prabhakaran S., et al. (2018). Single-cell map of Diverse immune phenotypes in the breast tumor microenvironment. Cell 174 (5), 1293–1308. 10.1016/j.cell.2018.05.060 - DOI - PMC - PubMed
    1. Burja B., Paul D., Tastanova A., Edalat S. G., Gerber R., Houtman M., et al. (2022). An optimized tissue dissociation protocol for single-cell RNA sequencing analysis of fresh and cultured human skin biopsies. Front. Cell Dev. Biol. 10, 872688. 10.3389/fcell.2022.872688 - DOI - PMC - PubMed
    1. Cancemi P., Buttacavoli M., Roz E., Feo S. (2019). Expression of alpha-enolase (ENO1), myc promoter-binding protein-1 (MBP-1) and matrix metalloproteinases (MMP-2 and MMP-9) reflect the nature and aggressiveness of breast tumors. Int. J. Mol. Sci. 20 (16), 3952. 10.3390/ijms20163952 - DOI - PMC - PubMed
    1. Chakraborty A., Wang J. G., Ay F. (2022). dcHiC detects differential compartments across multiple Hi-C datasets. Nat. Commun. 13 (1), 6827. 10.1038/s41467-022-34626-6 - DOI - PMC - PubMed
    1. Chen G., Ning B., Shi T. (2019). Single-cell RNA-seq technologies and related computational data analysis. Front. Genet. 10, 317. 10.3389/fgene.2019.00317 - DOI - PMC - PubMed