A novel assessment of whole-mount Gleason grading in prostate cancer to identify candidates for radical prostatectomy: a machine learning-based multiomics study
- PMID: 39239512
- PMCID: PMC11373617
- DOI: 10.7150/thno.96921
A novel assessment of whole-mount Gleason grading in prostate cancer to identify candidates for radical prostatectomy: a machine learning-based multiomics study
Abstract
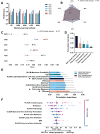
Purpose: This study aims to assess whole-mount Gleason grading (GG) in prostate cancer (PCa) accurately using a multiomics machine learning (ML) model and to compare its performance with biopsy-proven GG (bxGG) assessment. Materials and Methods: A total of 146 patients with PCa recruited in a pilot study of a prospective clinical trial (NCT02659527) were retrospectively included in the side study, all of whom underwent 68Ga-PSMA-11 integrated positron emission tomography (PET) / magnetic resonance (MR) before radical prostatectomy (RP) between May 2014 and April 2020. To establish a multiomics ML model, we quantified PET radiomics features, pathway-level genomics features from whole exome sequencing, and pathomics features derived from immunohistochemical staining of 11 biomarkers. Based on the multiomics dataset, five ML models were established and validated using 100-fold Monte Carlo cross-validation. Results: Among five ML models, the random forest (RF) model performed best in terms of the area under the curve (AUC). Compared to bxGG assessment alone, the RF model was superior in terms of AUC (0.87 vs 0.75), specificity (0.72 vs 0.61), positive predictive value (0.79 vs 0.75), and accuracy (0.78 vs 0.77) and showed slightly decreased sensitivity (0.83 vs 0.89) and negative predictive value (0.80 vs 0.81). Among the feature categories, bxGG was identified as the most important feature, followed by pathomics, clinical, radiomics and genomics features. The three important individual features were bxGG, PSA staining and one intensity-related radiomics feature. Conclusion: The findings demonstrate a superior assessment of the developed multiomics-based ML model in whole-mount GG compared to the current clinical baseline of bxGG. This enables personalized patient management by identifying high-risk PCa patients for RP.
Keywords: Gleason grading; PSMA; machine learning; multiomics; prostate cancer.
© The author(s).
Conflict of interest statement
Competing Interests: The authors have declared that no competing interest exists.
Figures


Similar articles
-
Supervised machine learning enables non-invasive lesion characterization in primary prostate cancer with [68Ga]Ga-PSMA-11 PET/MRI.Eur J Nucl Med Mol Imaging. 2021 Jun;48(6):1795-1805. doi: 10.1007/s00259-020-05140-y. Epub 2020 Dec 19. Eur J Nucl Med Mol Imaging. 2021. PMID: 33341915 Free PMC article. Clinical Trial.
-
Radiomics Features Measured with Multiparametric Magnetic Resonance Imaging Predict Prostate Cancer Aggressiveness.J Urol. 2019 Sep;202(3):498-505. doi: 10.1097/JU.0000000000000272. Epub 2019 Aug 8. J Urol. 2019. PMID: 30958743
-
A Machine Learning Approach for Predicting Biochemical Outcome After PSMA-PET-Guided Salvage Radiotherapy in Recurrent Prostate Cancer After Radical Prostatectomy: Retrospective Study.JMIR Cancer. 2024 Sep 20;10:e60323. doi: 10.2196/60323. JMIR Cancer. 2024. PMID: 39303279 Free PMC article.
-
Use of gallium-68 prostate-specific membrane antigen positron-emission tomography for detecting lymph node metastases in primary and recurrent prostate cancer and location of recurrence after radical prostatectomy: an overview of the current literature.BJU Int. 2020 Feb;125(2):206-214. doi: 10.1111/bju.14944. Epub 2019 Nov 29. BJU Int. 2020. PMID: 31680398 Free PMC article. Review.
-
68Ga-Labeled Prostate-specific Membrane Antigen Ligand Positron Emission Tomography/Computed Tomography for Prostate Cancer: A Systematic Review and Meta-analysis.Eur Urol Focus. 2018 Sep;4(5):686-693. doi: 10.1016/j.euf.2016.11.002. Epub 2016 Nov 15. Eur Urol Focus. 2018. PMID: 28753806
Cited by
-
The Role of Radiomics and Artificial Intelligence Applied to Staging PSMA PET in Assessing Prostate Cancer Aggressiveness.J Clin Med. 2025 May 9;14(10):3318. doi: 10.3390/jcm14103318. J Clin Med. 2025. PMID: 40429314 Free PMC article. Review.
-
Using radiomics model for predicting extraprostatic extension with PSMA PET/CT studies: a comparative study with the Mehralivand grading system.Cancer Imaging. 2025 Jun 18;25(1):77. doi: 10.1186/s40644-025-00894-w. Cancer Imaging. 2025. PMID: 40533824 Free PMC article.
-
Insights into pet-based radiogenomics in oncology: an updated systematic review.Eur J Nucl Med Mol Imaging. 2025 Sep;52(11):4184-4199. doi: 10.1007/s00259-025-07262-7. Epub 2025 Apr 7. Eur J Nucl Med Mol Imaging. 2025. PMID: 40192792 Free PMC article. Review.
References
Publication types
MeSH terms
Associated data
LinkOut - more resources
Full Text Sources
Medical
Research Materials
Miscellaneous

