. 2024 Aug 12;14(12):4844-4860.
doi: 10.7150/thno.96928. eCollection 2024.

Single cell RNA-sequencing delineates CD8+ tissue resident memory T cells maintaining rejection in liver transplantation

Affiliations

Single cell RNA-sequencing delineates CD8+ tissue resident memory T cells maintaining rejection in liver transplantation

Xinqiang Li et al. Theranostics. .

Abstract

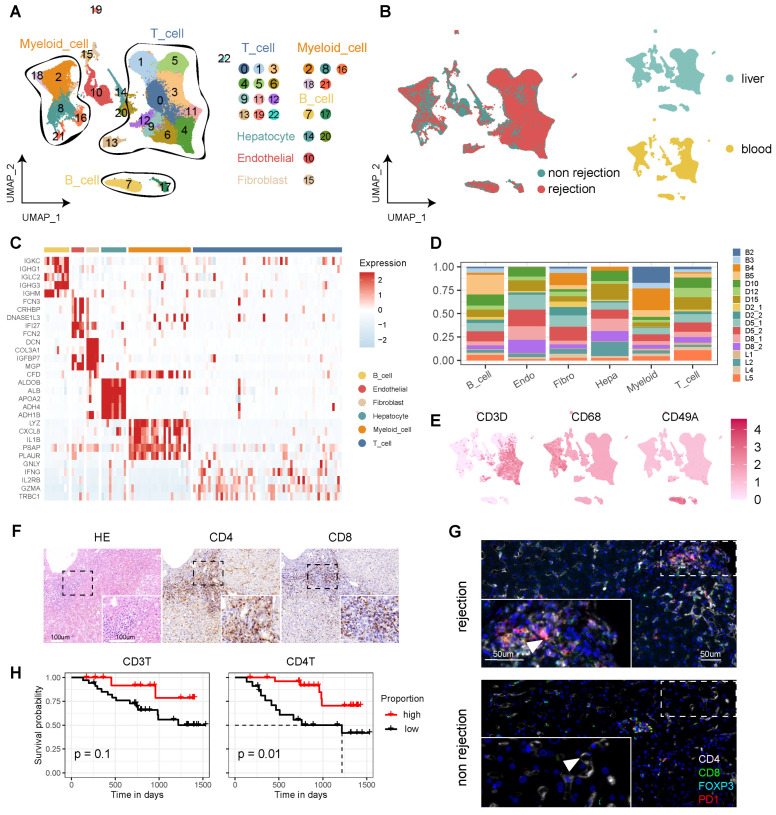
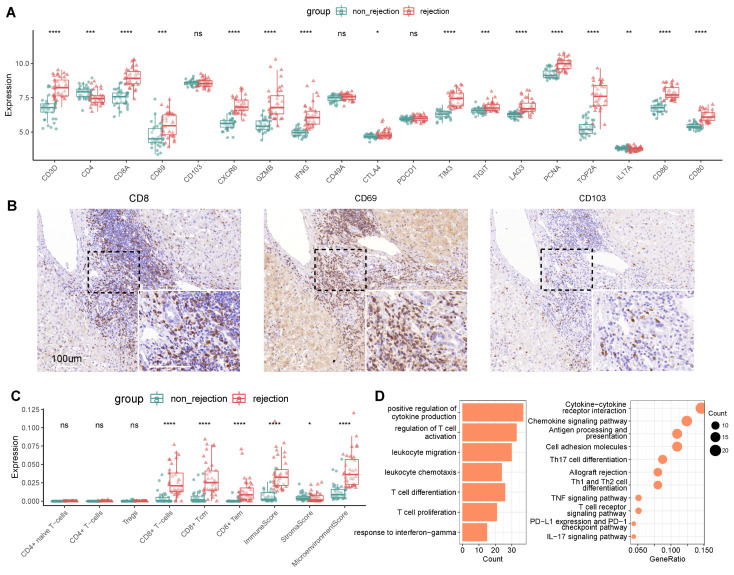
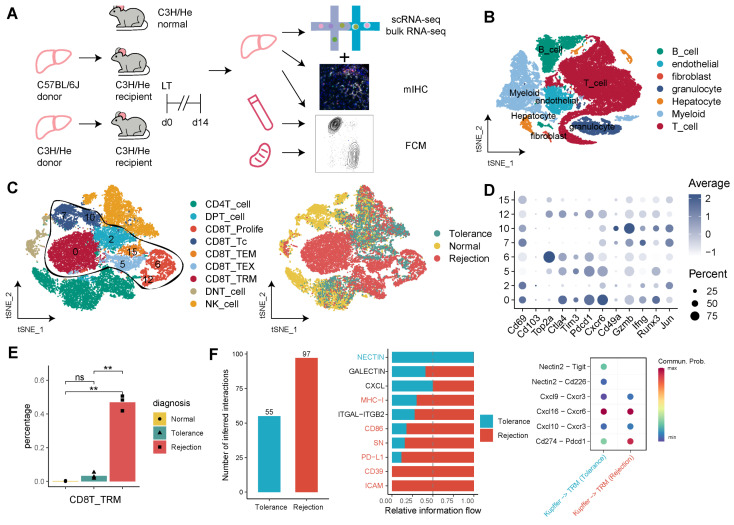
Rationale: Understanding the immune mechanisms associated with liver transplantation (LT), particularly the involvement of tissue-resident memory T cells (TRMs), represents a significant challenge. Methods: This study employs a multi-omics approach to analyse liver transplant samples from both human (n = 17) and mouse (n = 16), utilizing single-cell RNA sequencing, bulk RNA sequencing, and immunological techniques. Results: Our findings reveal a comprehensive T cell-centric landscape in LT across human and mouse species, involving 235,116 cells. Notably, we found a substantial increase in CD8+ TRMs within rejected grafts compared to stable ones. The elevated presence of CD8+ TRMs is characterised by a distinct expression profile, featuring upregulation of tissue-residency markers (CD69, CXCR6, CD49A and CD103+/-,), immune checkpoints (PD1, CTLA4, and TIGIT), cytotoxic markers (GZMB and IFNG) and proliferative markers (PCNA and TOP2A) during rejection. Furthermore, there is a high expression of transcription factors such as EOMES and RUNX3. Functional assays and analyses of cellular communication underscore the active role of CD8+ TRMs in interacting with other tissue-resident cells, particularly Kupffer cells, especially during rejection episodes. Conclusions: These insights into the distinctive activation and interaction patterns of CD8+ TRMs suggest their potential utility as biomarkers for graft rejection, paving the way for novel therapeutic strategies aimed at enhancing graft tolerance and improving overall transplant outcomes.

Keywords: graft rejection; immune tolerance; liver transplantation; multi-omics; tissue-resident memory T cells.


Conflict of interest statement

Competing Interests: The authors have declared that no competing interest exists.

Figures

Figure 1
Figure 1
Single-Cell Atlas of Human Liver Transplantation. A) UMAP plot depicting cell type identification of 115,026 high-quality cells in human liver transplantation. B) UMAP plots colored by spatial distribution of cells among diagnoses (rejection and non-rejection) and tissues (liver and blood). C) Heatmap displaying the top 5 genes of each cell type. D) Bar plots illustrating the proportion of cell types in each sample. E) UMAP plots showing the expression of CD3D, CD68, and CD49A across the landscape. F) HE and immunohistochemistry of CD4 and CD8 in rejection-transplanted liver. Insets highlight areas of T cell infiltration. Whole image scale bar, 200 μm. Inset scale bar, 100 μm. G) Multi-immunohistochemistry of rejection and non-rejection transplanted liver for DAPI (blue), CD4 (white), CD8 (green), FOXP3 (cyan), and PD1 (red). White arrows point to cells co-expressing CD8 and PD1. Whole image scale bar, 200 μm. Inset scale bar, 50 μm. H) KM analysis showing proportion of CD3+ and CD4+ T cells in the peripheral blood of LT patients for one month with prognosis.
Figure 2
Figure 2
Identifying CD4+ T Cell Subsets in Human Transplanted Liver and Blood. A) tSNE plot for re-clustering and cell type identification of 8,836 CD4+ T cells. B) tSNE plot colored by spatial distribution of cells among tissues (liver and blood). C) Dot plots showing the expression of TRM-related genes among clusters. Violin plots illustrating the TRM score among AREG+ TRM, IFNG+ TRM, and other CD4+ T subsets. D) Fractions of CD4+ T subsets among tissues (liver and blood) in rejection samples and diagnoses (rejection and non-rejection) in liver samples. E) Venn plot and violin plots showing the common and different marker genes between two CD4+ TRMs. F) Heatmap of the t-value for the area under the curve score of expression regulation by transcription factors, as estimated using SCENIC. G) Bar plots illustrating the cellular communication between CD4+ TRMs and other cells. Red pathways indicate rejection, while blue pathways indicate non-rejection in prevalence. H) Multi-immunohistochemistry of rejection-transplanted liver for DAPI (blue), CD4 (red), CD69 (cyan), CD103 (white), PD1 (purple), and CD68 (green). White arrows point to cells co-expressing CD4, CD69, and CD103. Whole image/insert scale bar, 100 μm.
Figure 3
Figure 3
Identifying CD8+ T Cell Subsets in Human Transplanted Liver and Blood. A) tSNE plot for re-clustering and cell type identification of 46,117 CD8+ T cells. B) tSNE plot colored by spatial distribution of cells among tissues (liver and blood). C) Fractions of CD8+ TRMs among tissues (liver and blood) in rejection samples and diagnoses (rejection and non-rejection) in liver samples. D) Dot plots showing the expression of TRM-related genes among clusters. Violin plots illustrating the TRM score between CD8+ TRMs and other CD8+ T subsets. E) Violin plots showing the top DEGs of CD8+ TRMs. Bar plots illustrating the GO pathway enrichment analysis for DEGs of CD8+ TRMs. F) Dot plots showing the cellular communications between CD8+ TRMs and Myeloid cell subsets between non-rejection (green) and rejection (red) samples. G) Multi-immunohistochemistry of rejection-transplanted liver for DAPI (blue), CD8 (orange), CD69 (cyan), CD103 (white), PD1 (purple), and CD68 (green). White arrows point to cells co-expressing CD8, CD69, CD103, and PD1. Whole image/insert scale bar, 100 μm.
Figure 4
Figure 4
CD8+ TRM Marker Expression Distinguishes Rejection in Liver Transplantation. A) Gene expression of TRM-related markers between non-rejection (n = 37) and rejection (n = 37) samples using bulk RNA-seq. B) Immunohistochemistry of CD8, CD69, and CD103 in rejection-transplanted liver. Whole/insert image scale bar, 100 μm. C) Analysis of immune infiltration between non-rejection and rejection transplanted liver. D) Bar plots and dot plots illustrating the GO and KEGG pathway enrichment analysis for DEGs between non-rejection and rejection tissues.
Figure 5
Figure 5
CD8+ TRMs Showing Dynamic Timeline Phenotypes in Mouse Liver Transplantation Models. A) C57BL/6 liver allografts were transplanted into C57BL/6 recipients, and single-cell RNA-seq analysis was performed using 10X genomics. B) UMAP plots showing the distribution of cells among dynamic timelines (pre-LT, 3h, 6h, 12h, 5d, 7d post-LT) and phases (pre, acute, and stable). C) Single-cell atlas of mouse LT in dynamic timelines, comprising different immune and stromal cells. D) Expression of canonical cell markers including Cd3d, Lyz2, Apoa1, Ly6g, Acta2, Bmp2, and Cd79a. E) tSNE plots for re-clustering and cell type identification of 11,480 T cells, especially CD8+ T cells. Dot plots showing the expression of TRM-related genes among CD8+ T clusters. F) Violin plots showing the TRM score among dynamic timelines and phases. G) Pseudotime analysis with identified CD8+ proliferative T cells, TRM, and TEX cells. H) Heatmap of the t-value for the area under the curve score of expression regulation by transcription factors between CD8+ TRM and TEX cells.
Figure 6
Figure 6
Single-Cell Omics Analysis of CD8+ TRMs in Rejection and Tolerance Phases of Mouse Liver Transplantation. A) C57BL/6J (n = 3) or C3H/He (n = 3) liver allografts were transplanted into C57BL/6 recipients, and single-cell RNA-seq analysis was performed using 10X genomics. B) Single-cell atlas of mouse LT in different diagnoses, comprising different immune and stromal cells. C) tSNE plots for re-clustering, cell type identification, and tissue distribution of 28,408 T cells, especially CD8+ T cells. D) Dot plots showing the expression of TRM-related genes among CD8+ T clusters. E) Fractions of CD8+ TRMs among diagnoses (rejection, non-rejection, and normal). F) Bar plots and dot plots illustrating the cellular communication between CD8+ TRMs and Kupffer cells. Red indicating rejection and cyan indicating non-rejection.
Figure 7
Figure 7
Bulk RNA-seq analysis of Rejected Liver Transplants. A) PCA of Bulk RNA-seq for Three Groups, Including Rejection, Tolerance, and Normal, in Mouse. B) Volcano plots and Venn plots illustrating the DEGs of rejection/normal and rejection/tolerance groups using bulk RNA-seq. C) Dot plots presenting the GO pathway enrichment analysis for DEGs of rejection/normal and rejection/tolerance groups. D) Heatmap displaying the expression of TRM-related genes among diagnoses.
Figure 8
Figure 8
Flow Cytometry and mIHC Confirm Dominance of CD103-CD8+ TRMs in Rejected Liver Transplants. A) Flow cytometry depicting the distribution of CD3+, CD8+, CD69+CD103+/- T cells among tissues (liver, spleen, and blood). B) Flow cytometry showing the dynamic changes of CD69+CD103- and PD1+ CD69+CD103- T cells in liver after different LT timelines (1W, 2W and 3W). C) Flow cytometry showing the dynamic changes of CD69+CD103- and PD1+CD69+CD103- T cells in spleen and blood after different LT timelines (1W, 2W and 3W). D) Multi-immunohistochemistry of different LT timelines (1W, 2W, 4W and 3M) in liver for CD8 (cyan), CD69 (purple), CD103 (red) and PD1 (yellow). Inset scale bar, 50 μm.

Similar articles

Cited by

References

    1. Wood-Trageser MA, Lesniak D, Gambella A, Golnoski K, Feng S, Bucuvalas J. et al. Next-generation pathology detection of T cell-antigen-presenting cell immune synapses in human liver allografts. Hepatology. 2023;77:355–66. - PMC - PubMed
    1. Lefaucheur C, Louis K, Morris AB, Taupin JL, Nickerson P, Tambur AR. et al. Clinical recommendations for posttransplant assessment of anti-HLA (Human Leukocyte Antigen) donor-specific antibodies: A Sensitization in Transplantation: Assessment of Risk consensus document. Am J Transplant. 2023;23:115–32. - PubMed
    1. Montano-Loza AJ, Rodriguez-Peralvarez ML, Pageaux GP, Sanchez-Fueyo A, Feng S. Liver transplantation immunology: Immunosuppression, rejection, and immunomodulation. J Hepatol. 2023;78:1199–215. - PubMed
    1. Que W, Ma K, Hu X, Guo WZ, Li XK. Combinations of anti-GITR antibody and CD28 superagonist induce permanent allograft acceptance by generating type 1 regulatory T cells. Sci Adv. 2022;8:eabo4413. - PMC - PubMed
    1. Mederacke YS, Nienen M, Jarek M, Geffers R, Hupa-Breier K, Babel N. et al. T cell receptor repertoires within liver allografts are different to those in the peripheral blood. J Hepatol. 2021;74:1167–75. - PubMed

Publication types

MeSH terms