. 2025 Apr;61(4):1812-1828.
doi: 10.1002/jmri.29583. Epub 2024 Sep 6.

Longitudinal Multiparametric Quantitative MRI Evaluation of Acute and Chronic Multiple Sclerosis Paramagnetic Rim Lesions

Affiliations

Longitudinal Multiparametric Quantitative MRI Evaluation of Acute and Chronic Multiple Sclerosis Paramagnetic Rim Lesions

Ahmed M Elkady et al. J Magn Reson Imaging. 2025 Apr.

Abstract

Background: Multiple sclerosis (MS) paramagnetic rim lesions (PRLs) are markers of chronic active biology and exhibit complex iron and myelin changes that may complicate quantification when using conventional MRI approaches.

Purpose: To conduct a multiparametric MRI analysis of PRLs.

Study type: Retrospective/longitudinal.

Subjects: Ninety-five progressive MS subjects with at least one persistent PRL who were enrolled in the CONSONANCE trial.

Field strength/sequence: 3-T/Susceptibility-weighted, T1-weighted, T2-weighted, and fluid-attenuated inversion recovery.

Assessment: Acute/chronic PRLs and non-PRLs were measured at screening, 24, 48, and 96 weeks using quantitative magnetic susceptibility (QS), R2*, and standardized T1w/T2w ratio (sT1w/T2w). PRL analyses were performed for whole lesion, core, and rim. The correlations between PRL core and rim sT1w/T2w, QS, and R2* were assessed.

Statistical tests: Linear mixed models. A P-value <0.05 was considered significant.

Results: There was a significant decrease in sT1w/T2w (-0.24 ± -5.3 × 10⁻³) and R2* (-3.6 ± 2.2 Hz) but a significant increase in QS (+21 ± 1.3 ppb) using whole-lesion analysis of chronic PRLs compared to non-PRLs at screening. Tissue damage accumulated at the 96-week time point was more evident in acute/chronic PRLs compared to acute/chronic non-PRLs (ΔsT1w/T2w = -0.21/-0.24 ± 0.033/0.0053; ΔR2* = -4.4/-3.6 ± 1.4/2.2 Hz). New, acute PRL sT1w/T2w significantly increased in lesion core (+4.3 × 10⁻³ ± 1.2 × 10⁻⁴) and rim (+5.6 × 10⁻³ ± 1.2 × 10⁻⁴) 24 weeks post lesion inception, suggestive of partial recovery. Chronic PRLs, contrastingly, showed significant decreases in sT1w/T2w over the initial 24 weeks for both core (-2.1 × 10⁻⁴ ± 2.0 × 10⁻⁵) and rim (-2.4 × 10⁻⁴ ± 2.0 × 10⁻⁵), indicative of irreversible tissue damage. Significant positive correlations between PRL core and rim sT1w/T2w (R2 = 0.53), R2* (R2 = 0.69) and QS (R2 = 0.52) were observed.

Data conclusion: Multiparametric assessment of PRLs has the potential to be a valuable tool for assessing complex iron and myelin changes in chronic active PRLs of progressive MS patients.

Level of evidence: 2 TECHNICAL EFFICACY: Stage 3.

Keywords: R2* mapping; T1w/T2w; iron; myelin; paramagnetic rim lesions; quantitative susceptibility mapping.


Conflict of interest statement

A.M.E. is a part‐time employee of NeuroRx Research. D.A.R. reports no competing interests. C.E., D.F., D.A. and Z.K. are employees of NeuroRx Research. S.N. has received research funding from Roche (not related to the current study), is a consultant for Sana Biotech, has received a speaker's honorarium from Novartis Canada, and is a part‐time employee of NeuroRx Research. D.L.A. received personal fees for consulting from Biogen, Eli Lilly, EMD Serono, Frequency Therapeutics, Gossamer Bio, Merck, Novartis, Race to Erase MS, Roche, and Sanofi‐Aventis, and has an ownership interest in NeuroRx Research.

Figures
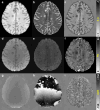
Figure 1
Figure 1
Precontrast T1w image (a) with T2w image (b) used to compute sT1w/T2w map (c). Multiecho gradient echo magnitude images are shown for echoes 1 (d) and 6 (e). These were employed to compute an R2* map (f). The bottom row identifies raw unwrapped phase images for echoes 1 (g) and 6 (h). These were applied as part of the input data to compute the QS map (i).
Figure 2
Figure 2
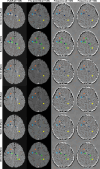
FLAIR, postgadolinium contrast agent injection T1w images demonstrating acute enhancement, and susceptibility weighted high‐pass filtered frequency maps for a progressive MS patient at screening, week 24, week 48, and week 96. The images show gadolinium enhancing lesions at screening that were classified as persistent PRL (dark blue arrows) and non‐PRL (light blue arrows) at week 96 and non‐enhancing lesions that were classified as persistent PRL (yellow arrows) and non‐persistent PRL (orange arrows). Manually‐drawn rim labels (green) overlaid on screening (second row) and week 96 (sixth row) images were used to determine persistent rim labels (Fig. 3).
Figure 3
Figure 3
Magnified screening time point views of FLAIR (first column), Postgadolinium T1w (Post‐Gd T1w, second column), standardized T1w/T2w ratio MR (sT1w/T2w, third column), apparent transverse relaxation rate (R2*, fourth column), susceptibility weighted high‐pass filtered frequency (fifth column), and quantitative susceptibility (QS, sixth column) images acquired for a progressive MS patient enrolled in the CONSONANCE trial. The images show a non‐PRL and two persistent PRLs that were acute at screening (first row) with overlaid Gd contrast enhancement (pink, second row), PRL persistent rim labels (green, third row), and PRL persistent core labels (red, fourth row). Persistent labels were computed as the intersection of screening and week 96 rim (Fig. 2) and core labels.
Figure 4
Figure 4
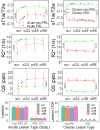
Least‐mean square trajectories of sT1w/T2w, R2*, and QS for acute (dashed lines, left column) and chronic (solid lines, right column) PRLs (red) and non‐PRLs (green) at screening (scr), week 24 (w24), week 48 (w48), and week 96 (w96) time points using whole‐lesion analysis. Corresponding sample sizes for each lesion type at each time point are shown in the bottom panels with the number of subjects with acute lesions at screening shown in between brackets. Error bars represent 95% confidence intervals; ****P ≤ 0.0001, ***P ≤ 0.001, **P ≤ 0.01; *P ≤ 0.05.
Figure 5
Figure 5
Least‐mean square trajectories showing the average changes in sT1w/T2w, R2*, and QS for acute (dashed lines) and chronic (solid lines) lesions. The columns denote the sT1w/T2w, R2*, and QS values for whole non‐PRL (green) and PRL (red) (left two panels), as well as core (middle panel), and rim (right panel) portions of PRL lesions. Points represent mean values of lesions calculated from a least square mean categorical, repeated measures linear mixed model at screening (scr), week 24 (w24), week 48 (w48), and week 96 (w96) time points. Error bars represent 95% confidence intervals. ****P ≤ 0.0001, ***P ≤ 0.001, **P ≤ 0.01; *P ≤ 0.05.
Figure 6
Figure 6
Linear correlation between the rim and core signals for each of the quantitative MRI parameters (sT1w/T2w, QS, and R2*) used in our study (first column). The second, third, and fourth columns show the correlations between quantitative MRI parameters (sT1w/T2w, QS, and R2*) for whole lesion (second column), rim (third column), and core (fourth column).

References

    1. Meaton I, Altokhis A, Allen CM, et al. Paramagnetic rims are a promising diagnostic imaging biomarker in multiple sclerosis. Mult Scler 2022;28:2212‐2220. - PMC - PubMed
    1. Altokhis AI, Hibbert AM, Allen CM, et al. Longitudinal clinical study of patients with iron rim lesions in multiple sclerosis. Mult Scler 2022;28:2202‐2211. - PMC - PubMed
    1. Frischer JM, Weigand SD, Guo Y, et al. Clinical and pathological insights into the dynamic nature of the white matter multiple sclerosis plaque. Ann Neurol 2015;78:710‐721. - PMC - PubMed
    1. Absinta M, Sati P, Masuzzo F, et al. Association of chronic active multiple sclerosis lesions with disability in vivo. JAMA Neurol 2019;76:1474‐1483. - PMC - PubMed
    1. Coffman CH, White R, Subramanian K, Buch S, Bernitsas E, Haacke EM. Quantitative susceptibility mapping of both ring and non‐ring white matter lesions in relapsing remitting multiple sclerosis. Magn Reson Imaging 2022;91:45‐51. - PubMed