. 2025 Feb 1;156(3):623-637.
doi: 10.1002/ijc.35176. Epub 2024 Sep 6.

14-3-3σ restricts YY1 to the cytoplasm, promoting therapy resistance, and tumor progression in colorectal cancer

Affiliations

14-3-3σ restricts YY1 to the cytoplasm, promoting therapy resistance, and tumor progression in colorectal cancer

Amol Lonare et al. Int J Cancer. .

Abstract

14-3-3σ functions as an oncogene in colorectal cancer and is associated with therapy resistance. However, the mechanisms underlying these observations are not clear. The results in this report demonstrate that loss of 14-3-3σ in colorectal cancer cells leads to a decrease in tumor formation and increased sensitivity to chemotherapy. The increased sensitivity to chemotherapy is due to a decrease in the expression of UPR pathway genes in the absence of 14-3-3σ. 14-3-3σ promotes expression of the UPR pathway genes by binding to the transcription factor YY1 and preventing the nuclear localization of YY1. YY1, in the absence of 14-3-3σ, shows increased nuclear localization and binds to the promoter of the UPR pathway genes, resulting in decreased gene expression. Similarly, a YY1 mutant that cannot bind to 14-3-3σ also shows increased nuclear localization and is enriched on the promoter of the UPR pathway genes. Finally, inhibition of the UPR pathway with genetic or pharmacological approaches sensitizes colon cancer cells to chemotherapy. Our results identify a novel mechanism by which 14-3-3σ promotes tumor progression and therapy resistance in colorectal cancer by maintaining UPR gene expression.

Keywords: 14‐3‐3σ; 5‐fluorouracil; colorectal cancer; unfolded protein response.


Conflict of interest statement

The authors declare no conflicts of interest.

Figures
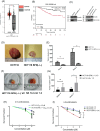
FIGURE 1
FIGURE 1
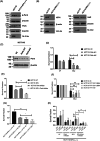
14‐3‐3σ is required for tumor progression and therapy resistance. (A) 14‐3‐3σ (SFN) expression in colon cancer patients and normal individuals was determined using the GIPEA tool. Note that 14‐3‐3σ expression is higher in tumor samples than in normal tissues. (B) Survival analysis of the colon cancer patient samples showing the high or low expression of 14‐3‐3σ (SFN) obtained using the KM plotter tool. (C) Protein extracts prepared from the HCT116, HCT116 SFN(−/−), and HA 14‐3‐3σ clones and the vector control cells were resolved on SDS‐PAGE gels followed by Western blots with the indicated antibodies. Western blots for β‐actin served as a loading control. (D and E) Mice were injected subcutaneously with the HCT116 and HCT116 SFN(−/−) cells and tumor volumes were measured in the 4th and 5th week. Representative images are shown (D), and the mean and standard deviation are plotted (E). (F and G) Mice were injected with the HCT116 SFN(−/−) derived vector control (VC) and HA14‐3‐3σ expressing cells, and tumor volumes were measured in the 4th and 5th weeks. Representative images are shown (F), and the mean and standard deviation are plotted (G). (H and I) Clonogenic assays were carried out by treating the indicated cell lines with different concentrations of 5FU, and survival curves were generated where the mean and standard deviation were plotted. Where indicated p values were determined using Student t‐test (*p < .05; **p < .01; ***p < .001; ns, non‐significant).
FIGURE 2
FIGURE 2
14‐3‐3σ regulates subcellular localization of YY1. (A–D) The HCT116 and HCT116 SFN(−/−) cells were stained with antibodies against YY1 and 14‐3‐3σ and nuclei were counter‐stained with DAPI. Representative images are shown (A and C) and 50 cells were counted in three independent experiments, the average intensity of YY1 per nucleus was measured, and the mean and standard deviation were plotted on the Y axis (B and D). Scale bars = 20 μm. (E) Protein extracts from HCT116 cells were incubated with the indicated fusion proteins and the reactions resolved on SDS‐PAGE gels followed by Western blots with the indicated antibodies. The panel on the left is a Ponceau stain of the blot showing the levels of the fusion proteins, and the panels on the right are the Western blots. Western blots for plakophilin3 (PKP3) served as a positive control. (F) Protein extracts from cells expressing the indicated YY1 mutants were incubated with the indicated fusion proteins and the reactions resolved on SDS‐PAGE gels followed by Western blots with the indicated antibodies. The upper panel is a ponceau stain of the membrane, and the lower panel is the Western blot. (G and H) HCT116 cells transfected with the indicated constructs were stained with antibodies to the FLAG epitope, and the nuclei counter‐stained with DAPI. Representative images are shown (G). The nuclear intensity was measured in 30 cells in three independent experiments, and the mean and standard deviation were plotted on the Y axis. Scale bars = 10 μm. Where indicated p values were determined using Student t‐test (*p < .05; **p < .01; ***p < .001; ns, non‐significant).
FIGURE 3
FIGURE 3
HCT116 SFN(−/−) cells show a decrease in expression of UPR pathway genes. (A) Differentially regulated genes were identified using RNA seq data using the TGCA database, and pathway analysis was carried out in the 14‐3‐3σ high versus YY1 low category. Chaperonin‐mediated protein folding, also known as the unfolded protein response pathway, is highlighted by the red box. (B) mRNA levels of UPR‐related genes were determined by qRT‐PCR in HCT116 and HCT116 SFN(−/−) cells, the fold change in gene expression was calculated, and then the mean and standard deviation were plotted on the Y‐axis. (C–E) Levels of different proteins of the UPR pathway were determined by Western blotting in the indicated cell lines. β‐ Actin served as a loading control. (F) The indicated cells were treated with the ER stress inducer tunicamycin (TM) and processed for electron microscopy. The arrows indicate the endoplasmic reticulum. Scale bars = 500 nm. Where indicated p values were determined using Student t‐test (*p < .05; **p < .01; ***p < .001; ns, non‐significant).
FIGURE 4
FIGURE 4
The UPR pathway is required for resistance to 5FU in HCT116 cells. (A–C) Protein extracts from the indicated cells were resolved on SDS‐PAGE gels followed by Western blotting with the indicated proteins. Blots for β‐actin served as a loading control. (D–H) Cells were either transfected with the indicated constructs or treated with the drugs (5FU or the PERK inhibitor 3 ) as described following which clonogenic assays were performed and colonies were counted after 14 days. The survival fraction was calculated, and the mean and standard deviation from three independent experiments were plotted on the Y‐axis. Where indicated p values were determined using Student t‐test (*p < .05, **p < .01; ***p < .001; ns, non‐significant).
FIGURE 5
FIGURE 5
YY1 negatively regulates the expression of UPR pathway genes. (A) Enrichment of YY1 on the promoters of the UPR pathway genes, GRP78, PERK, and IRE1α, in HCT116 cells was determined by analyzing data from the ENCODE database. (B and C) ChIP assays were performed using the antibodies to either YY1 (anti‐YY1) or non‐specific IgG in the indicated cell lines as described to determine the occupancy of YY1 on the promoters of GRP78 and PERK genes. The mean and standard deviation of three independent experiments are plotted on the Y axis. (D and E) ChIP assays were performed on cells transfected with the indicated FLAG‐tagged YY1 constructs using either antibodies to the FLAG epitope or non‐specific IgG. The mean and standard deviation of three independent experiments were plotted on the Y‐axis. (F) Protein extracts from HCT116 cells transfected with the FLAG‐tagged YY1 constructs were resolved on SDS‐PAGE gels, followed by Western blots with the indicated antibodies. Western blots for β‐actin served as loading controls. (G) YY1 expression was inhibited by siRNA targeting YY1 in HCT116 SFN(−/−) cells. Protein extracts prepared from the transfected cells were resolved on SDS‐PAGE gels, followed by Western blots with the indicated antibodies. β‐Actin served as loading control. Where indicated, p values were determined using the Student t‐test (*p < .05; **p < .01; ***p < .001; ns, non‐significant).
FIGURE 6
FIGURE 6
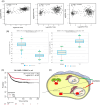
Expression of genes in the UPR pathway correlates with the expression of 14‐3‐3σ and negatively correlates with YY1. (A) The correlation between the expression of 14‐3‐3σ and UPR pathway genes GRP78/HSPA5, PERK/EIF2AK3, and IRE1α/ ERN1 was analyzed using GIPEA online database available for colon adenocarcinoma. The correlation was determined using the Spearman correlation coefficient. (B) Expression of YY1, GRP78, and PERK was analyzed using the ChIP v 2.0 online database for colon adenocarcinoma. (C) Survival analysis of the colon cancer patient samples showing the high or low expression of YY1 obtained using the KM plotter tool. (D) Model demonstrating the regulation of subcellular localization of YY1 by 14‐3‐3σ.

Similar articles

References

    1. Briffa R, Langdon SP, Grech G, Harrison DJ. Acquired and intrinsic resistance to colorectal cancer treatment. In: Chen J, ed. Colorectal Cancer—Diagnosis, Screening and Management. Intech Open; 2018:57‐81.
    1. Kozovska Z, Gabrisova V, Kucerova L. Colon cancer: cancer stem cells markers, drug resistance and treatment. Biomed Pharmacother. 2014;68:911‐916. - PubMed
    1. Aitken A. 14‐3‐3 proteins: a historic overview. Semin Cancer Biol. 2006;16:162‐172. - PubMed
    1. Muslin AJ, Tanner JW, Allen PM, Shaw AS. Interaction of 14‐3‐3 with signaling proteins is mediated by recognition of phosphoserine. Cell. 1996;84:889‐897. - PubMed
    1. Yaffe MB, Rittinger K, Volinia S, et al. The structural basis for 14‐3‐3 phosphopeptide binding specificity. Cell. 1997;91:961‐971. - PubMed

MeSH terms