. 2024 Sep;132(9):97005.
doi: 10.1289/EHP13864. Epub 2024 Sep 6.

Exposome-Wide Ranking to Uncover Environmental Chemicals Associated with Dyslipidemia: A Panel Study in Healthy Older Chinese Adults from the BAPE Study

Affiliations

Exposome-Wide Ranking to Uncover Environmental Chemicals Associated with Dyslipidemia: A Panel Study in Healthy Older Chinese Adults from the BAPE Study

Enmin Ding et al. Environ Health Perspect. 2024 Sep.

Abstract

Background: Environmental contaminants (ECs) are increasingly recognized as crucial drivers of dyslipidemia and cardiovascular disease (CVD), but the comprehensive impact spectrum and interlinking mechanisms remain uncertain.

Objectives: We aimed to systematically evaluate the association between exposure to 80 ECs across seven divergent categories and markers of dyslipidemia and investigate their underpinning biomolecular mechanisms via an unbiased integrative approach of internal chemical exposome and multi-omics.

Methods: A longitudinal study involving 76 healthy older adults was conducted in Jinan, China, and participants were followed five times from 10 September 2018 to 19 January 2019 in 1-month intervals. A broad spectrum of seven chemical categories covering the prototypes and metabolites of 102 ECs in serum or urine as well as six serum dyslipidemia markers [total cholesterol, high-density lipoprotein cholesterol, low-density lipoprotein cholesterol, apolipoprotein (Apo)A1, ApoB, and ApoE4] were measured. Multi-omics, including the blood transcriptome, serum/urine metabolome, and serum lipidome, were profiled concurrently. Exposome-wide association study and the deletion/substitution/addition algorithms were applied to explore the associations between 80 EC exposures detection frequency >50% and dyslipidemia markers. Weighted quantile sum regression was used to assess the mixture effects and relative contributions. Multi-omics profiling, causal inference model, and pathway analysis were conducted to interpret the mediating biomolecules and underlying mechanisms. Examination of cytokines and electrocardiograms was further conducted to validate the observed associations and biomolecular pathways.

Results: Eight main ECs [1-naphthalene, 1-pyrene, 2-fluorene, dibutyl phosphate, tri-phenyl phosphate, mono-(2-ethyl-5-hydroxyhexyl) phthalate, chromium, and vanadium] were significantly associated with most dyslipidemia markers. Multi-omics indicated that the associations were mediated by endogenous biomolecules and pathways, primarily pertinent to CVD, inflammation, and metabolism. Clinical measures of cytokines and electrocardiograms further cross-validated the association of these exogenous ECs with systemic inflammation and cardiac function, demonstrating their potential mechanisms in driving dyslipidemia pathogenesis.

Discussion: It is imperative to prioritize mitigating exposure to these ECs in the primary prevention and control of the dyslipidemia epidemic. https://doi.org/10.1289/EHP13864.


Figures
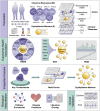
Figure 1 is an illustrative flowchart with four steps, namely, Population, Exposome-health association, Integrated analysis, and Biological interpretation. Step 1: Population: During five visits, 76 Chinese elderly persons had questionnaire, blood, and urine tests. There are 80 chemical exposure samples, which include 8 phthalates, 9 per- and polyfluoroalkyl compounds, 14 organophosphate esters, 6 polycyclic aromatic hydrocarbons, 2 monoaromatic hydrocarbons, bisphenol A, and 40 metals. There are six Dyslipidemia marker samples. Omics includes 19,936 samples of Transcriptome, 1,906 samples of Metabolome, and 630 samples of Lipidome. Clinical measurements include 21 Cytokine samples and 7 ECG samples. Step 2: Exposome-Health Association: The exposome-wide association research covers Monoaromatic hydrocarbons, Bisphenol A, Metals, Phthalates, Per- and polyfluoroalkyl compounds, Organophosphate esters, and Polycyclic aromatic hydrocarbons. The Deletion/substitution/addition method covers Phthalates, Per- and polyfluoroalkyl compounds, Organophosphate esters, Polycyclic aromatic hydrocarbons, Monoaromatic hydrocarbons, Bisphenol A, and Metals. The Deletion/substitution/addition method produced Dyslipidemia indicators. Weighted quantile sum regression is represented graphically. Step 3: Integrated Analysis: Organophosphate esters, Per- and polyfluoroalkyl compounds, and Polycyclic aromatic hydrocarbons are among the most significant pollutants. The major pollutants prompted Multi-omics. Multi-omics produced Dyslipidemia markers. Step 4: Biological interpretation involves Pathway enrichment, Disease prediction, and Literature overlap. Cytokines and electrocardiograms are now being clinically validated.
Figure 1.
Overview of the study design of the China BAPE panel study between September 2018 and January 2019 (n=353 collections over 5 visits). The internal chemical exposome of 76 healthy older Chinese adults 60–69 years of age (50% female) was assessed by the targeted chemical analysis, using five monthly longitudinal blood and urine samples. Serum dyslipidemia markers, multi-omics (peripheral blood transcriptome, serum metabolome, urine metabolome, and serum lipidome), clinical cytokines, and ECGs were measured. An EWAS was conducted, together with multi-omics integrative analysis, to identify the key ECs of the internal chemical exposome. Integrative analysis was implemented to disclose the transcripts, metabolites, and lipids identified by multi-omics as mediating the effects of ECs on dyslipidemia. Pathway enrichment, disease prediction, and literature overlap were used to interpret the potentially biological mechanisms, with cytokine and ECG measurements to validate the biological interpretation. Note: BAPE, Biomarkers of Air Pollutants Exposure in healthy older adults (study); BPA, bisphenol A; DSA, deletion/substitution/addition algorithm; ECG, electrocardiogram; ECs, environmental contaminants; EWAS, exposome-wide association study; MACHs, monoaromatic hydrocarbons; OPEs, organophosphate esters; PAEs, phthalates; PAHs, polycyclic aromatic hydrocarbons; PFAS, per- and polyfluoroalkyl substances; WQS, weighted quantile sum regression.
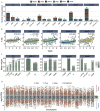
Figure 2A is a set of eight forest plots titled Blood metals, Blood organophosphate esters, Blood per- and polyfluoroalkyl substances, Urine metals, Urine organophosphate esters, Urine polycyclic aromatic hydrocarbons, Urine phthalates, and Others, plotting Percentage change (percentage), ranging from negative 10 to 30 in increments of 10; negative 10 to 20 in increments of 10; negative 10 to 20 in increments of 10; negative 10 to 20 in increments of 10; negative 10 to 30 in increments of 10; and negative 10 to 10 in increments of 10 (left y-axis) and Total cholesterol, High-density lipoprotein cholesterol, Low-density lipoprotein cholesterol, Apolipoprotein A1, Apolipoprotein B, and Apolipoprotein E4 (right y-axis) across Aluminum, Arsenic, Calcium, Cadmium, Cobalt, Copper, Iron, Mercury, Lithium, Magnesium, Manganese, Molybdenum, Nickel, Lead, Antimony, Selenium, Thallium, and Zinc; EHDPP, TBP, TCEP, TCIPP, TEHP, TEP, TiBP, TnBP, TPHP; F-35B, PFBA, PFDA, PFHpS, PFHxS, PFNA, PFOA, PFOS, and PFUnDA; Aluminum, Arsenic, Calcium, Cadmium, Cobalt, and Chromium; Copper, Iron, Mercury, Lithium, Magnesium, Molybdenum, Nickel, Lead, Antimony, Selenium, Tin, Thorium, Thallium, Uranium, Vanadium, and Zinc; BDCPP, BMPP, DBP, DEHP, DPHP; 1-NAP,1-PYR, 2-FLUO,2-NAP, 2-PHEN, 3-FLUO; MBzP, MEHHP, MEHP, MEOHP, MEP, MiBP, MMP, and MnBP; and BPA, SPMA, and TTMA (x-axis) for Trend, including negative, not significant, and positive, respectively. Figure 2B is a set of stacked bar graphs plus forest plots titled Total cholesterol, High-density lipoprotein cholesterol, Low-density lipoprotein cholesterol, Apolipoprotein A1, Apolipoprotein B, and Apolipoprotein E4, plotting Relative effect of estimates (percentage), ranging from 0.00 to 1.00 in increments of 0.25; Part variance, including metals, organophosphate esters, phthalates, polycyclic aromatic hydrocarbons; metals, polycyclic aromatic hydrocarbons, per- and polyfluoroalkyl substances; metals, organophosphate esters, phthalates, polycyclic aromatic hydrocarbons; metals, polycyclic aromatic hydrocarbons; BPA, metals, organophosphate esters, polycyclic aromatic hydrocarbons; and metals, phthalates, per- and polyfluoroalkyl substances (y-axis) across Parameter estimate, ranging from negative 0.3 to 0.3 in increments of 0.3, negative 0.3 to 0.3 in increments of 0.3, negative 0.3 to 0.3 in increments of 0.3, negative 0.3 to 0.3 in increments of 0.3, negative 0.3 to 0.6 in increments of 0.3, and negative 0.2 to 0.1 in increments of 0.1 (x-axis), respectively. The Deletion or substitution or addition frequency: Tin is 66 precent, Cobalt, is 10 percent, Lithium is 26 percent, Chromium is 66 precent, DBP is 98 percent, TPHP is 70 percent, MEHP is 61 percent, 2-FLUO is 18 percent, 1-NAP is 29 percent, 1-PY is 66 percent; Zinc is 13 percent, Chromium is 14 percent, 2-FLUO is 31 percent, 1-PYR is 82 percent, PFOA is 39 percent; Cobalt, is 8 percent, Tin is 6 percent, DBP is 86 percent, TPHP is 34 percent, MnBP is 12 percent, 1-PYR is 12 percent; Tin is 94 percent, Nickel is 15 percent, Cobalt, is 12 percent, Vanadium is 94 percent, 2-FLUO is 8 percent, 1-NAP is 25 percent, 1-PYR is 83 percent; BPA is 34 percent, Lithium is 60 percent, TPHP is 100 percent, 2-FLUO is 8 percent, 1-PYR is 94 percent; Arsenic is 8 percent, Nickel is 42 percent; Zinc is 8 percent, Aluminum is 98 percent, MiBP is 48 percent, MEHHP is 99 percent, PFOS is 99 percent, PFDA is 15 percent, and PFUnDA is 99 percent.
Figure 2.
Associations between internal chemical exposome and dyslipidemia markers among healthy older adults using EWAS and DSA models in the China BAPE panel study between September 2018 and January 2019 (n=353 collections over 5 visits). (A) Forest plot showing percentage change and 95% CI in each of six dyslipidemia markers (TC, HDL-C, LDL-C, ApoA1, ApoB, and ApoE4) for each SD increase in chemical concentration, using a linear mixed-effect model adjusted for age, sex, BMI, educational attainment, blood cotinine concentration, household income, frequency of other diet, time of physical activity, frequency of medication usage, supplement usage, tea consumption, alcohol consumption, and sampling time point. * indicates FDR <0.05 after multiple testing correction. Metals and ECs are listed on the x-axis. Numeric data can be found in Excel Table S2. (B) Forest plots of the parameter estimates (standardized regression coefficients) of the DSA model predictors with 95% CI and percentage stack histograms of the relative importance of each EC class, expressed as the percentage (%) of explained part variance for dyslipidemia markers (TC, HDL-C, LDL-C, ApoA1, ApoB, and ApoE4) on the left. p-Values show the statistical significance based on adjusted multivariate linear mixed-effect models. A heatmap of the occurrence frequency (%) of each predictor in the 1,000-time DSA algorithm fittings is shown on the right. Numeric data can be found in Excel Table S6. Environmental chemicals and metals are defined in Table 1. Note: ApoA1, apolipoprotein A1; ApoB, apolipoprotein B; ApoE4, apolipoprotein E4; BAPE, Biomarkers of Air Pollutants Exposure in healthy older adults (study); BMI, body mass index; CI, confidence intervals; DSA, deletion/substitution/addition; ECs, environmental contaminants; EWAS, exposome-wide association study; FDR, false discovery rate; HDL-C, high-density lipoprotein cholesterol; LDL-C, low-density lipoprotein cholesterol; OPEs, organophosphate esters; PAEs, phthalates; PAHs, polycyclic aromatic hydrocarbons; PFAS, per- and polyfluoroalkyl substances; SD, standard deviation; TC, total cholesterol.
Figure 3A is a set of six stacked bar graphs titled Total cholesterol, High-density lipoprotein cholesterol, Low-density lipoprotein cholesterol, Apolipoprotein A1, Apolipoprotein B, and Apolipoprotein E4, plotting Number of associations, ranging from 0 to 30 in increments of 10 (y-axis) across exposome-wide association study, deletion or substitution or addition, and common (x-axis) for Metals, Organophosphate esters, Others, Phthalates, Polycyclic aromatic hydrocarbons, and Per- and polyfluoroalkyl substances, respectively. Figure 3B is a set of five scatter plots with ribbon graphs titled Total cholesterol, High-density lipoprotein cholesterol, Low-density lipoprotein cholesterol, Apolipoprotein A1, and Apolipoprotein B, plotting uppercase y adjusted ranging from negative 3 to 6 in increments of 3; negative 2 to 4 in increments of 2; negative 2 to 4 in increments of 2; negative 2 to 4 in increments of 2; and negative 2 to 4 in increments of 2 (y-axis) across Weighted quantile sum, ranging from 0 to 8 in increments of 2; 0.0 to 7.5 in increments of 2.5; 0 to 8 in increments of 2; 0.0 to 7.5 in increments of 2.5; and 0 to 8 in increments of 2 (x-axis), respectively. Figure 3C is a set of five bar graphs titled Total cholesterol, High-density lipoprotein cholesterol, Low-density lipoprotein cholesterol, Apolipoprotein A1, and Apolipoprotein B, plotting Mean weight, ranging from 0.0 to 0.3 in increments of 0.1; 0.0 to 0.6 in increments of 0.2; 0.0 to 0.4 in increments of 0.1, 0.0 to 0.6 in increments of 0.2, and 0.0 to 0.4 in increments of 0.1 (y-axis) across 1-Naphthalene, 1-Pyrene, Chromium, Dibutyl phosphate, and Tri-phenyl phosphate; 1-Pyrene and Chromium; 1-Pyrene, Dibutyl phosphate, and Tri-phenyl phosphate; 1-Naphthalene, 1-Pyrene, and Vanadium; and 1-Pyrene, 2-Fluorene, Lithium, and Tri-phenyl phosphate (x-axis), respectively. A scale ranges from 0.00 to 1.00 in decrements of 0.25. Figure 3D is a Manhattan plot, plotting negative log 10 (false discovery rate), ranging from negative 10 to 10 in increments of 5 (left y-axis) and negative and positive (right y-axis) across Chromosome (x-axis) for Organophosphate esters, Polycyclic aromatic hydrocarbons, Metals, and Not significant.
Figure 3.
Quantifying the association between environmental mixtures and dyslipidemia markers among healthy older adults using WQS regression in the China BAPE panel study between September 2018 and January 2019 (n=353 collections over 5 visits). (A) Bar plots for the number and category of common and exclusive ECs associated with the dyslipidemia markers TC, HDL-C, LDL-C, ApoA1, ApoB, and ApoE4, using EWAS and DSA models. (B) Scatter diagrams and fitted curves of the changes in z-scores of dyslipidemia markers (TC, HDL-C, LDL-C, ApoA1, and ApoB) with the increase of the WQS index by WQS analyses. p-Values represent the statistical significance of WQS. (C) Bar plots of the relative weight of each key EC within chemical mixtures for their impact on dyslipidemia markers (TC, HDL-C, LDL-C, ApoA1, and ApoB) by WQS analyses. Dashed line represents the threshold (0.1) of the weight. (D) A Manhattan plot of the number and direction of the associations between key ECs and the blood transcriptome using LMMs, with the genomic coordinates displayed along the x-axis and the negative logarithm of the FDR-value displayed on the y-axis. Numeric data can be found in Excel Tables S7–S10. Note: 1-NAP, 1-naphthalene; 1-PYR, 1-pyrene; 2-FLUO, 2-fluorene; ApoA1, apolipoprotein A1; ApoB, apolipoprotein B; ApoE4, apolipoprotein E4; BAPE, Biomarkers of Air Pollutants Exposure in healthy older adults (study); Cr, chromium; DBP, dibutyl phosphate; DSA, deletion/substitution/addition; ECs, environmental contaminants; EWAS, exposome-wide association study; FDR, false discovery rate; HDL-C, high-density lipoprotein cholesterol; LDL-C, low-density lipoprotein cholesterol; Li, lithium; LMM, linear mixed-effects model; OPEs, organophosphate esters; PAEs, phthalates; PAHs, polycyclic aromatic hydrocarbons; PFAS, per- and polyfluoroalkyl substances; TC, total cholesterol; TPHP, tri-phenyl phosphate; V, vanadium; WQS, weighted quantile sum.
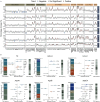
Figure 4A is a set of eight volcano plots titled 1-Naphthalene, 1-Pyrene, 2-Fluorene, Tri-phenyl phosphate, Dibutyl phosphate, Mono-(2-ethyl-5-hydroxyhexyl) phthalate, Chromium, and Vanadium under Serum metabolome, plotting negative log 10 (false discovery rate), ranging from 0 to 8 in increments of 2; 0 to 10 in increments of 5; 0 to 10 in increments of 5; 0 to 25 in increments of 5; 0 to 9 in increments of 3; 0 to 8 in increments of 2; 0 to 10 in increments of 5; and 0 to 5 in unit increments (y-axis) across Percentage change (percentage), ranging from negative 25 to 25 in increments of 25 (x-axis) for Positive, Negative, and Not significant, respectively. Figure 4B is a set of eight volcano plots titled 1-Naphthalene, 1-Pyrene, 2-Fluorene, Tri-phenyl phosphate, Dibutyl phosphate, Mono-(2-ethyl-5-hydroxyhexyl) phthalate, Chromium, and Vanadium under Urine metabolome, plotting negative log 10 (false discovery rate), ranging from 0 to 9 in increments of 3; 0 to 4 in unit increments, 0 to 6 in increments of 2, 0 to 8 in increments of 2, 0 to 15 in increments of 5, 0 to 9 in increments of 3, 0 to 8 in increments of 2, and 0.0 to 7.5 in increments of 2.5 (y-axis) across Percentage change (percentage), ranging from negative 25 to 25 in increments of 25 (x-axis) for Positive, Negative, and Not significant, respectively. Figure 4C is a set of eight volcano plots titled 1-Naphthalene, 1-Pyrene, 2-Fluorene, Tri-phenyl phosphate, Dibutyl phosphate, Mono-(2-ethyl-5-hydroxyhexyl) phthalate, Chromium, and Vanadium under Serum lipidome, plotting negative log 10 (false discovery rate), ranging from 0 to 8 in increments of 2, 0 to 9 in increments of 3, 0 to 10 in increments of 5, 0 to 25 in increments of 5, 0 to 20 in increments of 5, 0 to 4 in unit increments, 0 to 15 in increments of 5, and 0 to 8 in increments of 2 (y-axis) across Percentage change (percentage), ranging from negative 25 to 25 in increments of 25 (x-axis) for Positive, Negative, and Not significant, respectively. Figures 4D and 4E depict network maps of the relationships between important environmental pollutants and the serum metabolome and lipidome, such as tri-phenyl phosphate, 2-fluorene, 1-naphthalene, 1-pyrene, mono-(2-ethyl-5-hydroxyhexyl) phthalate, dibutyl phosphate, vanadium, and chromium. A scale illustrates the effect, spanning from negative 0.3 to 0.3 in 0.3 increments, respectively. Figure 4F is ten horizontal stacked bar graphs under Serum metabolome. On the left, the five graphs, plotting Organophosphate esters, including Dibutyl phosphate and Tri-phenyl phosphate; Phthalates, including Mono-(2-ethyl-5-hydroxyhexyl) phthalate; Polycyclic aromatic hydrocarbons, including 2-Fluorene, 1-Pyrene, and 1-Naphthalene; Metals, including Vanadium and Chromium; and Overall (y-axis) across percentage of positive metabolites, ranging from 200 to 0 in decrements of 50 (x-axis) for Lipid, Xenobiotics, Amino acid, Carbohydrate, Cofactors and vitamins, Nucleotide, Energy, Peptide, and Partially characterized molecules. On the right, the five graphs, plotting Organophosphate esters, including Dibutyl phosphate and Tri-phenyl phosphate; phthalates, including Mono-(2-ethyl-5-hydroxyhexyl) phthalate; Polycyclic aromatic hydrocarbons, including 2-Fluorene, 1-Pyrene, and 1-Naphthalene; Metals, including Vanadium and Chromium; and Overall (y-axis) across Percentage of positive metabolites, ranging from 0 to 200 in increments of 50 (x-axis) for Lipid, Xenobiotics, Amino acid, Carbohydrate, Cofactors and vitamins, Nucleotide, Energy, Peptide, and Partially Characterized molecules. Figure 4G is ten horizontal stacked bar graphs under Serum lipidome. On the left, the five graphs, plotting Organophosphate esters, including Dibutyl phosphate and Tri-phenyl phosphate; Phthalates, including Mono-(2-ethyl-5-hydroxyhexyl) phthalate; Polycyclic aromatic hydrocarbons, including 2-Fluorene, 1-Pyrene, and 1-Naphthalene; Metals, including Vanadium and Chromium; and Overall (y-axis) across Percentage of positive metabolites, ranging from 250 to 0 in decrements of 50 (x-axis) for Glycerophospholipids, Sphingolipids, Glycerolipids, Fatty acyls, Sterol lipids, and Prenol lipids. On the right, the five graphs, plotting Organophosphate esters, including Dibutyl phosphate and Tri-phenyl phosphate; Phthalates, including Mono-(2-ethyl-5-hydroxyhexyl) phthalate; Polycyclic aromatic hydrocarbons, including 2-Fluorene, 1-Pyrene, and 1-Naphthalene; Metals, including Vanadium and Chromium; and Overall (y-axis) across Percentage of positive metabolites, ranging from 0 to 250 in increments of 50 (x-axis) for Glycerophospholipids, Sphingolipids, Glycerolipids, Fatty acyls, Sterol lipids, and Prenol lipids.
Figure 4.
Multi-omics profiling of the key EC exposures among healthy older adults in the China BAPE panel study between September 2018 and January 2019 (n=353 collections over 5 visits). (A–C) Volcano plots of the coefficient estimate for key EC exposures (weight>10%) vs. FDR values among the associations between the EC exposures and the serum metabolome (A), urine metabolome (B), and serum lipidome (C). Coefficient estimates are given in effect estimates of dyslipidemia markers (TC, HDL-C, LDL-C, ApoA1, ApoB, and ApoE4) for a 1-SD change in a given EC exposure by LMM. The dashed horizontal line indicates the point with the FDR=0.05. (D,E) Network map of the associations between key ECs and the serum metabolome (D) and lipidome (E) (only metabolites and lipids with the associations of FDR <0.001 are shown owing to layout limit). The size of the nodes represents the degree of EC–metabolite/lipid connections, and the color of the edges represents the coefficient estimate of EC–metabolite/lipid associations by LMM. (F,G) Stacking histograms of the percentages (%) of the positively and negatively associated metabolites within each class, as well as the overall average for the serum metabolome (F) and lipidome (G) with FDR <0.05. Numeric data for (A–E) can be found in Excel Tables S11–S13; data for (F,G) can be found in Tables S2–S4. Note: 1-NAP, 1-naphthalene; 1-PYR, 1-pyrene; 2-FLUO, 2-fluorene; ApoA1, apolipoprotein A1; ApoB, apolipoprotein B; ApoE4, apolipoprotein E4; BAPE, Biomarkers of Air Pollutants Exposure in healthy older adults (study); Cr, chromium; DBP, dibutyl phosphate; ECs, environmental contaminants; FDR, false discovery rate; HDL-C, high-density lipoprotein cholesterol; LDL-C, low-density lipoprotein cholesterol; LMM, linear mixed-effects model; MEHHP, mono-(2-ethyl-5-hydroxyhexyl) phthalate; OPEs, organophosphate esters; PAEs, phthalates; PAHs, polycyclic aromatic hydrocarbons; SD, standard deviation; TC, total cholesterol; TPHP, tri-phenyl phosphate; V, vanadium.
Figure 5A depicts a tripartite network of the inferred causal relationships linking the key environmental contaminants to the dyslipidemia markers, including Total cholesterol, High-density lipoprotein cholesterol, Low-density lipoprotein cholesterol, Apolipoprotein A1, Apolipoprotein B, and Apolipoprotein E4 across Mono-(2-ethyl-5-hydroxyhexyl) phthalate, 1-Pyrene, 1-Naphthalene, Vanadium, Chromium, Dibutyl phosphate, and Tri-phenyl phosphate through serum or urine metabolite and serum lipid mediators by causal inference test analysis. The size of each node indicates the degree of environmental contaminant–metabolite or lipid–dyslipidemia marker interactions. The bar graphs depict the number of positive and negative connections between individual environmental contaminants. The dashed and dotted boxes indicate positive and negative relationships, respectively. Figure 5B is a dot plot, plotting Glutathione biosynthesis, Proline degradation, Glutamine degradation 1, Asparagine degradation 1, Asparagine biosynthesis 1, Super-pathway of citrulline metabolism, Citrulline–nitric oxide cycle, MYC mediated apoptosis signaling, LPS-stimulated MAPK signaling, Peroxisome proliferator-activated receptor alpha or retinoid X receptor alpha activation, Peroxisome proliferator-activated receptor signaling, Liver X receptor or retinoid X receptor activation, Toll-like receptor signaling, HMGB1 signaling, Hepatic fibrosis signaling pathway, Hepatic fibrosis or hepatic stellate cell activation, Interleukin-17A signaling in fibroblasts, Interleukin-17 signaling, Interleukin-10 signaling, Interleukin-8 signaling, Interleukin-6 signaling, Macrophage classical activation signaling pathway, Cardiac hypertrophy signaling (enhanced), Triacylglycerol biosynthesis, Atherosclerosis signaling, HIF1a signaling, Hypoxia signaling in the cardiovascular system, iNOS signaling, VEGF signaling (y-axis) across Chromium, Vanadium, Tri-phenyl phosphate, Dibutyl phosphate, 1-Naphthalene, 1-Pyrene, 2-Fluorene, and Mono-(2-ethyl-5-hydroxyhexyl) phthalate (x-axis) for Metals, Organophosphate esters, Polycyclic aromatic hydrocarbons, and Phthalates. A scale depicts the ratio ranging from 0.00 to 1.00 in increments of 0.25. A scale of log lowercase p ranges from 2 to 5 in unit increments. Class is divided into three parts, namely, Adaptive immunity, Anti-inflammatory, and Pro-inflammatory. Category is divided into four parts, namely, Metals, Organophosphate esters, Phthalates, and Polycyclic aromatic hydrocarbons. A scale depicts Estimate ranging from negative 0.4 to 0.4 in increments of 0.2. Figure 5C is a set of sixteen bar graphs. On the left, the five graphs are titled Cardiac disease, plotting 1-Naphthalene, 1-Pyrene, 2-Fluorene, Chromium, Dibutyl phosphate, Mono-(2-ethyl-5-hydroxyhexyl) phthalate, Tri-phenyl phosphate, and Vanadium (left y-axis) and negative log to the base 10 (lowercase q), ranging from 1 to 3 in increments of 2 and 3 to 10 in increments of 7 (right y-axis) across Atheroscierosis, Myocardial infarction, ST-elevation myocardial infarction, Atherothrombosis, Venous thromboembolism, Disorder of blood pressure, Mean arterial pressure, Ischemic injury, and Embolic stroke (x-axis) for Type, including Cardiac disease and Cardiac function. On the right, the five graphs are titled Cardiac function, plotting 1-Naphthalene, 1-Pyrene, 2-Fluorene, Chromium, Dibutyl phosphate, Mono-(2-ethyl-5-hydroxyhexyl) phthalate, Tri-phenyl phosphate, and Vanadium (left y-axis) and negative log to the base 10 (lowercase q), ranging from 1 to 3 in increments of 2 and 3 to 10 in increments of 7 (right y-axis) across Calcification of coronary artery, Inflammation of myocardium, Hypertrophy of heart cells, Proliferation of endothelial cells, Stimulation of endothelial cells, Chemotaxis of endothelial cells, Vasculogenesis, and Occlusion of artery (x-axis) for type, including Cardiac disease and Cardiac function. Figure 5D is a heatmap titled Inflammatory cytokine, plotting Class with Category, ranging as Adaptive immunity with Interleukin-7, Interleukin-5, Interleukin-4, Interleukin-21, Interleukin-2, and Granulocyte-macrophage colony-stimulating factor; Anti-inflammatory with Interleukin-13, Interleukin-12 (p70), and Interleukin-10; and Pro-inflammatory with Tumor necrosis factor alpha, Macrophage inflammatory protein-3 alpha, Macrophage inflammatory protein-1 beta, Macrophage inflammatory protein-1 alpha, Interferon-inducible T-cell, Interleukin-8, Interleukin-6, interleukin-23, Interleukin-17A, Interleukin-1 beta, Interferon-gamma, and Fractalkine (y-axis) across 1-Naphthalene, 1-Pyrene, 2-Fluorene, Tri-phenyl phosphate, Dibutyl phosphate, Mono-(2-ethyl-5-hydroxyhexyl) phthalate, Chromium, and Vanadium (x-axis) for Polycyclic aromatic hydrocarbons, Organophosphate esters, Phthalates, and Metals.
Figure 5.
Inferred biomolecular intermediators of key ECs and dyslipidemia markers, IPA, and measurements of cytokines and ECG parameters among healthy older adults in the China BAPE panel study between September 2018 and January 2019 (n=353 collections over 5 visits). (A) A tripartite network of the inferred causal relationships (only causal inference analysis with FDR <0.05 are shown) linking the key ECs to the dyslipidemia markers (TC, HDL-C, LDL-C, ApoA1, ApoB, and ApoE4) via serum/urine metabolite and serum lipid mediators by CIT analyses. The size of each node represents the degree of EC–metabolite/lipid–dyslipidemia marker connections. The number of positive and negative associations for individual ECs are shown as length of bar plots. Dashed and dotted boxes represent positive and negative associations, respectively. (B) Dot plots of canonical pathways with the significant biomolecular intermediators (blood transcripts, serum/urine metabolites, and serum lipids) for each key EC (p<0.05) by IPA. The negative logarithm of the p-value and transcript/metabolite/lipid ratio are displayed as the size and color of the dot, respectively. (C) A bar plot of the significant cardiac diseases and functions predicated by IPA for each key EC. The negative logarithm of the q-value is displayed as the size of the bar. (D) A heatmap of the associations between the key ECs and inflammatory cytokines (x-axis) by LMM. The darkness of the color indicates estimate between ECs and inflammatory cytokines, which is described in the key to the left of the table. The number indicates FDR-value of each association. Numeric data can be found in Excel Tables S15–S18. Note: 1-NAP, 1-naphthalene; 1-PYR, 1-pyrene; 2-FLUO, 2-fluorene; ApoA1, apolipoprotein A1; ApoB, apolipoprotein B; ApoE4, apolipoprotein E4; BAPE, Biomarkers of Air Pollutants Exposure in healthy older adults (study); CIT, causal inference test; Cr, chromium; CVD, cardiovascular disease; DBP, dibutyl phosphate; ECG, electrocardiogram; ECs, environmental contaminants; FDR, false discovery rate; GM-CSF, granulocyte–macrophage colony-stimulating factor; HDL-C, high-density lipoprotein cholesterol; HIF, hypoxia-inducible factor; HMGB, high mobility group box; IFN, interferon; IL, interleukin; iNOS, inducible nitric oxide synthase; IPA, integrative pathway analysis; ITAC, IFN-inducible T-cell α-chemoattractant; LDL-C, low-density lipoprotein cholesterol; LMM, linear mixed-effects model; LPS, lipopolysaccharides; LXR, liver X receptor; MAPK, mitogen-activated protein kinase; MEHHP, mono-(2-ethyl-5-hydroxyhexyl) phthalate; MIP, macrophage inflammatory protein; MYC, myelocytomatosis; OPEs, organophosphate esters; PAEs, phthalates; PAHs, polycyclic aromatic hydrocarbons; PPAR, peroxisome proliferators-activated receptor; RXR, retinoid X receptor; TC, total cholesterol; TNF, tumor necrosis factor; TPHP, tri-phenyl phosphate; V, vanadium; VEGF, vascular endothelial growth factor.
Figure 6 is an illustrative flowchart with four steps. Step 1: Environmental contaminants: Environmental pollutants include Polycyclic aromatic hydrocarbons such as 1-Naphthalene, 1-Pyrene, and 2-Fluorene, Organophosphate esters such as Tri-phenyl phosphate and Dibutyl phosphate, Phthalates such as Mono-(2-ethyl-5-hydroxyhexyl) phthalate, and Metals such as Chromium and Vanadium. Step 2: Effect pathways: Hypoxia-inducible factor 1 alpha signaling, including decrease in hypoxia-inducible factor 1 alpha and increase in rhoptry-associated protein-1 beta; Triglyceride biosynthesis, including increase in elongation of long-chain fatty acids family member 6 and decrease in glycerol-3-phosphate acyltransferase 3; interleukin-6 or 8 signaling, including decrease in C X C L 8, decrease in C D 14, decrease in interleukin-6, decrease in interleukin-8; and Citrulline–nitric oxide cycle, including increase in citrulline and increase in L-aspartic acid. Step 3: Development of Risk Factors: Risk factors emerge, including Dyslipidemia, Endothelial dysfunction, and Systemic inflammation. Step 4: Cardiovascular outcomes: Cardiovascular consequences include Atherosclerosis, Abnormal electrocardiograms, and Myocardial infarctions.
Figure 6.
Putative mechanistic framework linking key EC exposures to cardiovascular outcomes. Putative mechanisms linking key EC exposures and cardiovascular outcomes include effector pathway perturbations (e.g., HIF-1α, TG biosynthesis, IL-6/8 signaling, citrulline–NO cycle) and risk factor developments (e.g., dyslipidemia, endothelial dysfunction, systemic inflammation). Note: 1-NAP, 1-naphthalene; 1-PYR, 1-pyrene; 2-FLUO, 2-fluorene; Cr, chromium; DBP, dibutyl phosphate; ECG, electrocardiogram; HIF, hypoxia-inducible factor; HSC, hepatic stellate cell; IL, interleukin; MEHHP, mono-(2-ethyl-5-hydroxyhexyl) phthalate; OPEs, organophosphate esters; NO, nitric oxide; NOS, nitric oxide synthase; PAEs, phthalates; PAHs, polycyclic aromatic hydrocarbons; TG, triglyceride; TPHP, tri-phenyl phosphate; V, vanadium.

References

    1. GBD 2019 Risk Factors Collaborators. 2020. Global burden of 87 risk factors in 204 countries and territories, 1990–2019: a systematic analysis for the Global Burden of Disease Study 2019. Lancet 396(10258):1223–1249, PMID: 33069327, 10.1016/s0140-6736(20)30752-2. - DOI - PMC - PubMed
    1. Zhao D, Liu J, Wang M, Zhang X, Zhou M. 2019. Epidemiology of cardiovascular disease in China: current features and implications. Nat Rev Cardiol 16(4):203–212, PMID: 30467329, 10.1038/s41569-018-0119-4. - DOI - PubMed
    1. Wang W, Liu Y, Liu J, Yin P, Wang L, Qi J, et al. . 2021. Mortality and years of life lost of cardiovascular diseases in China, 2005–2020: empirical evidence from national mortality surveillance system. Int J Cardiol 340:105–112, PMID: 34453974, 10.1016/j.ijcard.2021.08.034. - DOI - PubMed
    1. Lechner K, von Schacky C, McKenzie AL, Worm N, Nixdorff U, Lechner B, et al. . 2020. Lifestyle factors and high-risk atherosclerosis: pathways and mechanisms beyond traditional risk factors. Eur J Prev Cardiol 27(4):394–406, PMID: 31408370, 10.1177/2047487319869400. - DOI - PMC - PubMed
    1. Kopin L, Lowenstein C. 2017. Dyslipidemia. Ann Intern Med 167(11):ITC81–ITC96, PMID: 29204622, 10.7326/AITC201712050. - DOI - PubMed

LinkOut - more resources