. 2024 Sep 10;121(37):e2408699121.
doi: 10.1073/pnas.2408699121. Epub 2024 Sep 6.

Sugar signaling modulates SHOOT MERISTEMLESS expression and meristem function in Arabidopsis

Affiliations

Sugar signaling modulates SHOOT MERISTEMLESS expression and meristem function in Arabidopsis

Filipa L Lopes et al. Proc Natl Acad Sci U S A. .

Abstract

In plants, development of all above-ground tissues relies on the shoot apical meristem (SAM) which balances cell proliferation and differentiation to allow life-long growth. To maximize fitness and survival, meristem activity is adjusted to the prevailing conditions through a poorly understood integration of developmental signals with environmental and nutritional information. Here, we show that sugar signals influence SAM function by altering the protein levels of SHOOT MERISTEMLESS (STM), a key regulator of meristem maintenance. STM is less abundant in inflorescence meristems with lower sugar content, resulting from plants being grown or treated under limiting light conditions. Additionally, sucrose but not light is sufficient to sustain STM accumulation in excised inflorescences. Plants overexpressing the α1-subunit of SUCROSE-NON-FERMENTING1-RELATED KINASE 1 (SnRK1) accumulate less STM protein under optimal light conditions, despite higher sugar accumulation in the meristem. Furthermore, SnRK1α1 interacts physically with STM and inhibits its activity in reporter assays, suggesting that SnRK1 represses STM protein function. Contrasting the absence of growth defects in SnRK1α1 overexpressors, silencing SnRK1α in the SAM leads to meristem dysfunction and severe developmental phenotypes. This is accompanied by reduced STM transcript levels, suggesting indirect effects on STM. Altogether, we demonstrate that sugars promote STM accumulation and that the SnRK1 sugar sensor plays a dual role in the SAM, limiting STM function under unfavorable conditions but being required for overall meristem organization and integrity under favorable conditions. This highlights the importance of sugars and SnRK1 signaling for the proper coordination of meristem activities.

Keywords: Arabidopsis thaliana; plant development; shoot apical meristem; sugar signaling.


Conflict of interest statement

Competing interests statement:The authors declare no competing interest.

Figures

Fig. 1.
Fig. 1.
Effect of light on STM expression. (A–C), STM-VENUS expression in SAMs of pSTM::STM-VENUS plants grown under HL (170 μmol m−2 s−1) or LL (60 μmol m−2 s−1) conditions or transferred from HL to darkness (D) or kept under HL for the indicated times. (A) Representative STM-VENUS images of SAMs from HL and LL-grown plants and of plants transferred to D for 48 h. (Scale bar, 50 µm.) (B and C) Quantification of STM-VENUS signal. (B) Plots show SAM measurements of plants grown as three independent batches normalized by the mean of the HL condition of each batch (HL, n = 44; LL, n = 45). Student’s t test (P-value shown). (C) Plots show SAM measurements of plants grown as two to three independent batches normalized by the mean of the HL condition of each batch (0 h, n = 18; 24 h L, n = 19; 24 h D, n = 18; 48 h L, n = 19; 48 h D, n = 18; 72 h L, n = 9; 72 h D, n = 12). The 0 h sample serves as control for both L and D treatments. Different letters indicate statistically significant differences (Kruskal–Wallis with Dunn's test; P < 0.05). (D) Immunoblot analyses of STM and TUBULIN (TUB) protein levels in SAMs of pSTM::STM-VENUS plants grown under HL or LL conditions or grown in HL and transferred to D for 48 h. Ponceau staining serves as loading control. Numbers refer to mean STM-VENUS amounts in LL and D as compared to HL (n = 2; each a pool of five SAMs; in parentheses, SEM). (E) RT-qPCR analyses of STM and STM target genes AIL7 and HB25 in SAMs of pSTM::STM-VENUS plants grown in HL and transferred to D or kept in HL for 48 h. Graphs show the average of three independent samples, each consisting of a pool of five SAMs. Paired ratio t test (P-values shown).
Fig. 2.
Fig. 2.
Effect of sugars on STM levels. (A) Effect of light on the levels of soluble sugars in SAMs of pSTM::STM-VENUS plants grown in HL and transferred to darkness (D) or kept in HL for 48 h. Suc, sucrose; Tre6P, trehalose 6-phosphate; Glc, glucose; Fru, fructose. Plots show measurements of five to six samples, each consisting of a pool of five SAMs from plants grown as two independent batches. Welch’s t test (P-value shown). (B) Effect of light on STM-VENUS levels in cut inflorescences. Inflorescences of pSTM::STM-VENUS/pSTM::TFP-N7 plants grown under HL were cut and placed in medium without sugar for 48 h under HL (L) or dark (D) conditions, after which the SAMs were dissected and imaged (VENUS). Upper panel, representative STM-VENUS images of SAMs. (Scale bar, 50 µm.) Lower panel, plots showing SAM measurements of plants grown as one to two independent batches normalized by the mean of the uncut condition of each batch (uncut, n = 31, two batches; 48 h L, n = 14, one batch; 48 h D, n = 21, two batches). Different letters indicate statistically significant differences (Kruskal–Wallis with Dunn's test; P < 0.05). (C) Effect of sugar on STM-VENUS levels in cut inflorescences. Inflorescences of pSTM::STM-VENUS/pSTM::TFP-N7 plants grown under HL condition were cut and placed under darkness for 48 h in medium with sucrose (Suc; 2% and 5%) or sorbitol (Sor; 1% and 2.5%) as osmotic control. SAMs were thereafter dissected and imaged (VENUS). Upper panel, representative STM-VENUS images of SAMs. (Scale bar, 50 µm.) Lower panel, plots showing SAM measurements of plants grown as one to three independent batches normalized by the mean of the uncut condition of each batch (uncut, n = 31, three batches; 1% Sor, n = 21, two batches; 2% Suc, n = 28, three batches; 2.5% Sor, n = 7, one batch; 5% Suc, n = 6, one batch). Different letters indicate statistically significant differences (Kruskal–Wallis with Dunn's test; P < 0.05).
Fig. 3.
Fig. 3.
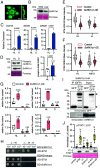
SnRK1 is expressed in the SAM and affects STM response to light. (A) SnRK1α1-GFP imaging in the SAM. Right panel, SAM longitudinal section. (Scale bars, 50 µm.) (B) Immunoblot analyses of SnRK1α1 in SAMs and rosette leaves of pSTM::STM-VENUS plants grown under HL. Samples of 35 µg of total protein were loaded from SAM and leaf extracts. Ponceau staining serves as loading control. Similar results were obtained from two independent experiments. (C) RT-qPCR analyses of SnRK1 signaling marker genes (DIN10, SEN5, DRM2) in SAMs of pSTM::STM-VENUS plants grown in HL and transferred to darkness (D) or kept in HL for 48 h. Graphs show the average of three independent samples, each consisting of a pool of five SAMs. Paired ratio t-test (P-values shown). (D) Left, representative immunoblot of SnRK1α1 T-loop phosphorylation in SAMs of the plants described in (C), using antibodies recognizing the T175 phosphorylation (phospho-SnRK1α) or the total SnRK1α1 protein. Right, quantification of the mean SnRK1α phosphorylation (phospho-SnRK1α/total SnRK1α1) in D as compared to the ratio in HL (n = 3; each a pool of five SAMs). Paired ratio t test (P-value shown). (E and F) STM-VENUS expression in SAMs of control and SnRK1α1-OE plants grown under HL or LL conditions (E) or grown under HL and transferred to darkness (D) or kept under HL for 48 h (F). The same batches of HL-grown plants served as controls for the experiments shown in (E) and (F). HL and LL-grown STM-VENUS samples are replotted from Fig. 1B as a reference. Plots show SAM measurements of plants grown as three independent batches normalized by the mean of the HL condition of each batch (control, HL: n = 44, LL: n = 45, D: n = 45; SnRK1α1-OE, HL: n = 45, LL: n = 45; D: n = 45). Different letters indicate statistically significant differences (Kruskal–Wallis with Dunn's test; P < 0.05). (G) Effect of light on the levels of sugars in SAMs of SnRK1α1-OE plants as compared to the control. Suc, sucrose; Tre6P, trehalose 6-phosphate; Glc, glucose; Fru, fructose. Plots show measurements of five to six samples, each consisting of a pool of five SAMs from plants grown as two independent batches. Welch’s t test (mutant vs. control for each condition; P-values shown). (H) Yeast-two hybrid assays examining the interaction of SnRK1α1 with STM. Protein interaction was determined by monitoring yeast growth in medium lacking Leu, Trp, and His (-L-W-H) compared with control medium only lacking Leu and Trp (-L-W). Upper panel, yeast growth in cells coexpressing AD-STM, with BD-SnRK1α1. Lower panel, negative controls of yeast transfected with the indicated AD/BD-constructs and the complementary BD/AD-empty vectors. BD and AD, DNA binding and activation domains of the GAL4 TF, respectively. Increasing dilutions of transformed yeast cells are shown (10−1, 10−2, 10−3). Experiments were performed three times with similar results. (I) Coimmunoprecipitation (co-IP) experiments using Arabidopsis Col-0 mesophyll cell protoplasts coexpressing SnRK1α1-HA with STM-GFP or GFP alone. GFP-tagged proteins were immunoprecipitated and coimmunoprecipitation of SnRK1α1 was assessed by immunoblotting with an HA antibody. Arrowheads, STM-GFP (Upper) and GFP (Lower). Experiments were performed three times with similar results. (J) Impact of SnRK1 on STM activity, measured as the induction of the pCUC1::LUC reporter in Arabidopsis mesophyll protoplasts expressing STM and SnRK1α1 in the indicated combinations. SnRK1α1-KD, kinase-dead SnRK1α1K48M variant. Plots show normalized luciferase (LUC) activity values (n = 13 transfections using eight biologically independent protoplast preparations). Different letters denote statistically significant differences (Brown–Forsythe and Welch ANOVA, P < 0.05). Lower panels, immunoblot analyses of the indicated samples and Ponceau staining of the membrane.
Fig. 4.
Fig. 4.
Silencing SnRK1α in the SAM leads to reduced STM expression. (A) Schematic localization of amiRα-1 and amiRα-2 target sites (gray triangles) in the SnRK1α1 and SnRK1α2 transcripts. Yellow blocks correspond to exons. (B) Immunoblot analyses of SnRK1α T-loop phosphorylation in SAMs of plants expressing pSTM::amiRα-1 (amiRα-1) or pSTM::amiRα-2 (amiRα-2), using antibodies recognizing total SnRK1α1 or SnRK1α phosphorylated on T175 (phospho-SnRK1α). Ponceau staining serves as loading control. Numbers refer to mean SnRK1α1 amounts or mean SnRK1α phosphorylation (phospho-SnRK1α/total SnRK1α1) in the amiRα lines relative to the control STM-VENUS line (n = 2; each a pool of five SAMs; in parentheses, SEM). (C) Representative meristems expressing STM-VENUS together with pSTM::amiRα-1, pSTM::amiRα-2, or pSTM::TFP-N7 as a control, and whose membranes were labeled with FM4-64. Left panels show the sum-slice projections of the STM-VENUS signal (color-coded using the Fire representation in ImageJ), and the Right panels, the sum-slice projection of the FM4-64 signal. (Scale bars, 50 µm.) P1 and P2, youngest visible and older flower primordia, respectively. (D) Quantification of the STM-VENUS signal in the SAMs shown in (C). Plots show SAM measurements of plants grown as two independent batches (except amiRα-1#2, which was grown as a single batch) normalized by the mean of the control line of each batch (control, n=34; amiRα-2#1, n=16; amiRα-2#2, n=22; amiRα-1#1, n=25; amiRα-1#2 n=10). Different letters indicate statistically significant differences (Kruskal–Wallis with Dunn's test; P < 0.05). (E) Immunoblot analyses of STM-VENUS and TUBULIN (TUB) protein levels in SAMs of the amiRα lines and the STM-VENUS control. Ponceau staining serves as loading control. Numbers refer to mean STM-VENUS amounts in the amiRα lines as compared to the control (n = 2; each a pool of five SAMs; in parentheses, SEM). (F) Sum-slice projection of control line and amiRα-2 showing additional defects in meristem organization. Red arrows point at bract-like structures while yellow arrows point at fusions between adjacent floral primordia. (Scale bars, 50 µm.)
Fig. 5.
Fig. 5.
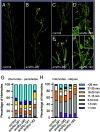
Silencing of SnRK1α in the SAM affects meristem function and plant architecture. (AF) Representative images of control (STM-VENUS, A and C) and amiRα (B and DF) plants showing irregular internode length (A and B), clusters of leaves (C, D, and F) and siliques (A, B, and E), and termination of the main inflorescence (F) in the amiRα lines. Insets show organ fusion between leaves of an aerial rosette (D) and between pedicels and the stem (F). (G and H) Quantification of the internode length defects in control and two independent lines of amiRα-1 and amiRα-2 mutants. Internode length was determined by measuring the length of the internodes between paraclades (G) and between the first 12 siliques (H), all counted acropetally. Internode length was scored in the indicated size ranges from the main inflorescence of 18 plants of each genotype. Graphs show the relative frequencies of each size class in the total number of internodes scored. All phenotypes were scored from plants grown under equinoctial conditions until the completion of flowering.
Fig. 6.
Fig. 6.
Model for the role of sugars and SnRK1 signaling in the SAM. Left, under favorable conditions, basal SnRK1 activity is required for meristem organization, with local SnRK1α silencing causing severe phenotypes related to SAM dysfunction and, likely as a consequence, reduced STM expression. The mechanisms underlying these SnRK1 effects remain unknown (indicated by a question mark). Right, under limiting light conditions or other unfavorable situations, sugar levels decrease, leading to a strong activation of SnRK1 signaling. This results in decreased STM protein accumulation, potentially through direct action of SnRK1α1 on STM or an STM partner to reduce SAM activity and growth.

References

    1. Barton M. K., Twenty years on: The inner workings of the shoot apical meristem, a developmental dynamo. Dev. Biol. 341, 95–113 (2010). - PubMed
    1. Galli M., Gallavotti A., Expanding the regulatory network for meristem size in plants. Trends Genet. 32, 372–383 (2016). - PubMed
    1. Lopes F. L., Galvan-Ampudia C., Landrein B., WUSCHEL in the shoot apical meristem: Old player, new tricks. J. Exp. Bot. 72, 1527–1535 (2021). - PubMed
    1. Long J. A., Moan E. I., Medford J. I., Barton M. K., A member of the KNOTTED class of homeodomain proteins encoded by the STM gene of Arabidopsis. Nature 379, 66–69 (1996). - PubMed
    1. Barton M. K., Poethig R. S., Formation of the shoot apical meristem in Arabidopsis thaliana: An analysis of development in the wild type and in the shoot meristemless mutant. Development 119, 823–831 (1993).

MeSH terms

LinkOut - more resources