. 2024 Sep 6;19(9):e0309553.
doi: 10.1371/journal.pone.0309553. eCollection 2024.

Metadynamics simulations reveal mechanisms of Na+ and Ca2+ transport in two open states of the channelrhodopsin chimera, C1C2

Affiliations

Metadynamics simulations reveal mechanisms of Na+ and Ca2+ transport in two open states of the channelrhodopsin chimera, C1C2

Lindsey A Prignano et al. PLoS One. .

Abstract

Cation conducting channelrhodopsins (ChRs) are a popular tool used in optogenetics to control the activity of excitable cells and tissues using light. ChRs with altered ion selectivity are in high demand for use in different cell types and for other specialized applications. However, a detailed mechanism of ion permeation in ChRs is not fully resolved. Here, we use complementary experimental and computational methods to uncover the mechanisms of cation transport and valence selectivity through the channelrhodopsin chimera, C1C2, in the high- and low-conducting open states. Electrophysiology measurements identified a single-residue substitution within the central gate, N297D, that increased Ca2+ permeability vs. Na+ by nearly two-fold at peak current, but less so at stationary current. We then developed molecular models of dimeric wild-type C1C2 and N297D mutant channels in both open states and calculated the PMF profiles for Na+ and Ca2+ permeation through each protein using well-tempered/multiple-walker metadynamics. Results of these studies agree well with experimental measurements and demonstrate that the pore entrance on the extracellular side differs from original predictions and is actually located in a gap between helices I and II. Cation transport occurs via a relay mechanism where cations are passed between flexible carboxylate sidechains lining the full length of the pore by sidechain swinging, like a monkey swinging on vines. In the mutant channel, residue D297 enhances Ca2+ permeability by mediating the handoff between the central and cytosolic binding sites via direct coordination and sidechain swinging. We also found that altered cation binding affinities at both the extracellular entrance and central binding sites underly the distinct transport properties of the low-conducting open state. This work significantly advances our understanding of ion selectivity and permeation in cation channelrhodopsins and provides the insights needed for successful development of new ion-selective optogenetic tools.


Conflict of interest statement

Sandia National Laboratories is a multimission laboratory managed and operated by National Technology & Engineering Solutions of Sandia, LLC, a wholly owned subsidiary of Honeywell International, Inc., for the U.S. DOE’s National Nuclear Security Administration under contract DE-NA-0003525. This does not alter our adherence to PLOS ONE policies on sharing data and materials. There are no patents, products in development or marketed products associated with this research to declare.

Figures

Fig 1
Fig 1. Structure of all-trans retinal.
Chemical structure and carbon numbering scheme of the retinal chromophore in C1C2 in the all-trans, 15-anti configuration. The retinal is covalently bound to lysine 296 on helix VII via protonated Schiff base linkage.
Fig 2
Fig 2. Key structural features involved in ion permeation and gating in C1C2.
One protomer of our dimeric C1C2 wild-type model in the dark-adapted closed state is shown. The putative permeation pathway predicted by the crystal structure of closed state C1C2 (PDBID: 3UG9) is marked by a green double arrow. The pathway can be divided into three regions (viewed from the extracellular side): (A) The extracellular vestibule located between the tops of helices I, II, III, and VII forms a water-filled access channel that extends down to the central gate. (B) The central gate, including the protonated Schiff base of the retinal and its primary proton acceptor, D292. Hydrogen bonds between residues S102, E129, and N297 block the passage of water and ions from the extracellular side. Residues studied by mutational analysis in this work are N297 and V125 (labeled with red text). (C) The intracellular gate as seen from the central gate. Hydrogen bonds among these residues link helices II and VII and occlude the pore on the cytosolic side. Regions outside the permeation pathway that are involved in pore formation and cation conductance are (side views): (D) A highly conserved cluster of residues that borders the predicted channel entrance in cation ChRs. (E) The “DC-gate” formed by C167 and D195. Mutations at or near these two residues severely affect gating kinetics and ion selectivity. In all parts of the figure, the protein backbone is shown in transparent gray cartoon. Individual residues are shown as sticks in cyan, and retinal is green. Water inside the protein is displayed as transparent light blue-gray surfaces. Black dotted lines connecting sidechains represent hydrogen bonds. The other protomer, membrane lipids, bulk solvent, and nonpolar protons are hidden for clarity.
Fig 3
Fig 3. Photocycle of C1C2.
The branched double photocycle model applied in this work, proposed by Kuhne et al. and features two parallel reaction cycles. The conformation of the retinal Schiff base (RSB) in each state is shown. Blue lightning bolts indicate light-activated transitions. Subscripts are the wavelength of maximum absorption characteristic of each photointermediate state. Orange text indicates the associated kinetic state from the four-state model used in previous works. For a population of channels on a cell membrane in the dark, all channels start in the dark-adapted first closed state D470/C1 with residues E129 and D195 protonated, retinal in the all-trans, 15-anti conformation and a protonated Schiff base. This state is also referred to as the ground state. Under single-turnover conditions, where the channels are activated with a very brief laser flash, the first reaction pathway is followed (anti-cycle). Residue E129 remains protonated throughout the anti-cycle. Photoisomerization of retinal from all-trans, 15-anti → 13-cis, 15-anti forms the first photointermediate state, P500. Next, proton transfer from the RSBH+ to the primary proton acceptor D292 forms the second photointermediate, the “pre-open” P390 state. Reprotonation of the RSB leads to the high-conducting first open state, P520/O1, that generates a transient peak current before decaying exponentially back to the baseline. Under continuous illumination, the photocycle branches from the ground state such that about half of the channels follow the anti-cycle reaction pathway while the other half follow a second reaction pathway, called the syn-cycle. In the syn-cycle, a double photoisomerization from all-trans, 15-anti → 13-cis, 15-syn retinal and deprotonation of E129 leads to formation of the light-adapted/desensitized second closed state P480/C2. Residue E129 stays deprotonated throughout the syn-cycle. Photoactivation of the P480/C2 state with 480 nm blue light triggers the third and final isomerization reaction from 13-cis, 15-syn → all-trans, 15-syn retinal that leads to the low-conducting or “inactivated” second open state, I530/O2. The two open states reach an equilibrium that generates a steady-state current until the light is turned off, at which point the current decays exponentially back to the baseline.
Fig 4
Fig 4. Setup of MWWT-MetaD with 8 “walkers”.
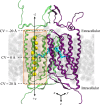
Representative diagram of the simulated system showing initial positions of Na+ (yellow spheres) in each of the 8 replicas or “walkers” extracted from the SMD trajectory. Retinal is shown as sticks in cyan, protomer A is shown in green, protomer B is in purple, and lipids are light-gray space-filling molecules in the background. To prevent the ion from diffusing out of the channel, a harmonic wall potential was applied to limit the movement of the sodium ion to an area defined by a 14-Å radius cylinder (shown in orange) centered around the z-axis of the pore (solid black double arrow). The collective variable (CV) used for free energy calculations was defined as the z-axis component of the ion’s distance away from the center of mass of the helical core of protomer A. Thus, a CV value of zero was located about halfway through the membrane near the retinal (middle black dashed line), negative CV values were toward the extracellular side, and positive CV values were toward the intracellular side. Foreground lipids, water, and other ions are hidden for clarity.
Fig 5
Fig 5. Characterization of ion selectivity in C1C2 wild-type and mutant channels.
(A) Current-voltage relationships extracted from photocurrent traces of wild-type and N297D expressed in X. laevis oocytes immersed in the indicated bath solution at pH 7. Plotted values are the average of 6–9 cells ± SEM measured at peak current. (B) Current-voltage relationships extracted from photocurrent traces of N297V expressed in X. laevis oocytes immersed in the indicated Na+ or K+ bath solution at pH 7 or 9. Plotted values are an average of 5–6 cells ± SEM measured at stationary current. The reversal potential (Erev) is the membrane potential (Vm) at the x-intercept of each curve in A and B. Reversal potential values measured in all bath solutions for all variants are listed in S1 Table. (C) Permeability ratios calculated from the difference in measured reversal potentials at peak current and (D) at stationary current. Ratios for V125L were only calculated for stationary current due the lack of peak current recovery after the initial light pulse. Proton permeability ratios PH/PNa are scaled by a factor of 107 for display purposes. Values are an average of 3–18 cells ± SEM. Statistical significance is denoted by * for p < 0.05 and ** for p < 0.01. Values shown in C and D are also available in numerical format in S2 Table.
Fig 6
Fig 6. Retinal kink and conformational change upon channel opening.
Structural alignment of one protomer of the wild-type C1C2 dimer comparing differences between the initial D470/C1 closed state (gray) and the high-conducting P520/O1 open state (cyan; S3 Table, model #6) in the vicinity of the retinal. View is from the extracellular side of the channel. Orange arrows indicate the direction of movement of residues and helices. The curved orange arrow traces the path taken by the sidechain of C167 upon channel opening, whose initial position in the D470/C1 closed state model is partially obscured by the retinal polyene chain of the P520/O1 open state model. Black dotted lines represent hydrogen bonds. The other protomer, nonpolar protons, solvent, ions, and lipids are hidden for clarity.
Fig 7
Fig 7. Predicted vs. actual permeation pathway in C1C2.
Merged image of all frames of a 100-ns trajectory of one of eight walkers from metadynamics simulations of the wild-type P520/O1 open state model (anti-cycle) showing the actual permeation path taken by Na+ through the pore (yellow spheres) compared to the pathway predicted by the crystal structure (green double arrow). The window on the left shows a close-up snapshot of Na+ and coordinated waters as it passes through the pore entrance located between helices I and II on the extracellular side. This perspective is rotated 90° relative to the view on the right. The protein backbone is in pink with select individual residues represented as sticks in cyan. Na+ is shown in yellow, and coordinated waters are shown as red and white space-filling molecules. Gray bars mark the membrane boundaries. The other protomer, bulk solvent, and lipids are hidden for clarity. ECG, extracellular gate.
Fig 8
Fig 8. Correlation of PMFs to pore structure of the P520/O1 open state of the wild-type channel.
(A) PMF profiles of Na+ (yellow line) and Ca2+ (purple line) permeation through one protomer of the wild-type C1C2 channel in the high-conducting P520/O1 open state calculated from metadynamics simulations. (B) Snapshot of the permeation pathway from metadynamics simulations as Na+ (yellow sphere) passes through the central gating region of the pore. (C) Snapshot of the permeation pathway from metadynamics simulations showing Ca2+ (purple sphere) in a binding site at the intracellular entrance to the pore. The snapshots in B and C are aligned to the reaction coordinate (CV value) of the PMF profile in A, where the horizontal black dashed lines correlate points on the PMF with important cation-sidechain interactions as the ion traverses the pore. Small, black dotted lines connecting sidechains indicate hydrogen bonds. The protein backbone is shown in transparent gray cartoon, sidechains of select residues are represented as sticks in cyan, and retinal is in green. The other protomer, solvent, lipids, and nonpolar protons are hidden for clarity.
Fig 9
Fig 9. Comparison of pore size in the two open states.
The average pore diameter during Na+ translocation is plotted as a function of the CV value for the wild-type C1C2 channel in the P520/O1 open state (solid blue line) and the I530/O2 open state (gray dashed line). Pore dimensions were measured with the software program HOLE as described in the data analysis section of the Methods. Shaded areas are ± SEM, where n = 8. The green dotted line at 4.8 Å marks the diameter of hydrated Na+ or Ca2+ defined as twice the peak of the radial distribution of the ion’s first hydration shell.
Fig 10
Fig 10. Comparison of PMF profiles for cation permeation in the high- and low-conducting open states of wild-type C1C2 and N297D mutant channels.
Potential of mean force (PMF) profiles calculated from MWWT-MetaD simulations of Na+ (yellow line) and Ca2+ (purple line) translocation through the indicated structure. For reference, the channel entrance on the extracellular side corresponds to CV ≈ -18 Å, and positive CV values >15 Å correspond to the bulk cytosolic solution.
Fig 11
Fig 11. Charge density and number of coordinating ligands in central gate governs selectivity.
View of Na+ passing through the central gate of (A) wild-type C1C2 in the P520/O1 open state, (B) wild-type C1C2 in the I530/O2 open state, (C) N297D in the P520/O1 open state, and (D) N297D in the I530/O2 open state. Results for Ca2+ coordination were similar to Na+ except for in the low-conducting I530/O2 open states (B and D), where Ca2+ associated strongly with the charged D292 sidechain instead of S102, as discussed in the text. View is from the extracellular side of the channel and corresponds to CV ≈ -2 Å. Black dotted lines indicate hydrogen bonds, the protein backbone is in transparent gray cartoon, select residues are shown as sticks in cyan, retinal is in green, and yellow spheres are Na+. The other protomer, solvent, lipids, and nonpolar protons are hidden for clarity.
Fig 12
Fig 12. Sidechain D297 mediates Ca2+ transfer between central and cytosolic binding sites.
Shown above is a series snapshots from MWWT-MetaD simulations comparing the mechanisms of Ca2+ permeation between the wild-type channel (top row) and the N297D mutant (bottom row) in the I530/O2 open state as the ion travels from the free energy minimum in frame 1 (CV ≈ -5 Å) to the pore exit on the intracellular side in frame 4 (CV ≈ +10 Å). All views are taken from the channel’s interior facing helix I and oriented with the extracellular side at the top of the image. Only transmembrane helices I, II, and VII and relevant sidechains are visible, while the remainder of the protein and the retinal at position 296 are hidden for clarity. In all parts of the figure, the protein backbone is in transparent gray cartoon, the sidechain at position 297 is shown as green sticks while all other sidechains are colored cyan, black dotted lines represent hydrogen bonds, purple spheres are Ca2+, and waters belonging to the ion’s inner hydration shell are shown as red and white space-filling molecules. The other protomer, nonpolar protons, bulk solvent, other pore waters, and membrane lipids are hidden for clarity.

Similar articles

Cited by

References

    1. Sineshchekov OA, Jung KH, Spudich JL. Two rhodopsins mediate phototaxis to low- and high-intensity light in Chlamydomonas reinhardtii. Proc Natl Acad Sci. 2002. Jun 25;99(13):8689–94. doi: 10.1073/pnas.122243399 - DOI - PMC - PubMed
    1. ichi Wakabayashi K, Isu A, Ueki N. Channelrhodopsin-Dependent Photo-Behavioral Responses in the Unicellular Green Alga Chlamydomonas reinhardtii. In: Yawo H, Kandori H, Koizumi A, Kageyama R, editors. Optogenetics: Light-Sensing Proteins and Their Applications in Neuroscience and Beyond. Singapore: Springer; 2021. p. 21–33. - PubMed
    1. Xiao N, Privman E, Venton BJ. Optogenetic Control of Serotonin and Dopamine Release in Drosophila Larvae. ACS Chem Neurosci. 2014. Aug 20;5(8):666–73. - PMC - PubMed
    1. Mastro KJ, Zitelli KT, Willard AM, Leblanc KH, Kravitz AV, Gittis AH. Cell-specific pallidal intervention induces long-lasting motor recovery in dopamine-depleted mice. Nat Neurosci. 2017. Jun;20(6):815–23. doi: 10.1038/nn.4559 - DOI - PMC - PubMed
    1. Sahel JA, Boulanger-Scemama E, Pagot C, Arleo A, Galluppi F, Martel JN, et al.. Partial recovery of visual function in a blind patient after optogenetic therapy. Nat Med. 2021. Jul;27(7):1223–9. doi: 10.1038/s41591-021-01351-4 - DOI - PubMed

LinkOut - more resources