. 2024 Sep 6;9(99):eadp0344.
doi: 10.1126/sciimmunol.adp0344. Epub 2024 Sep 6.

Convergent evolution of monocyte differentiation in adult skin instructs Langerhans cell identity

Affiliations

Convergent evolution of monocyte differentiation in adult skin instructs Langerhans cell identity

Anna Appios et al. Sci Immunol. .

Abstract

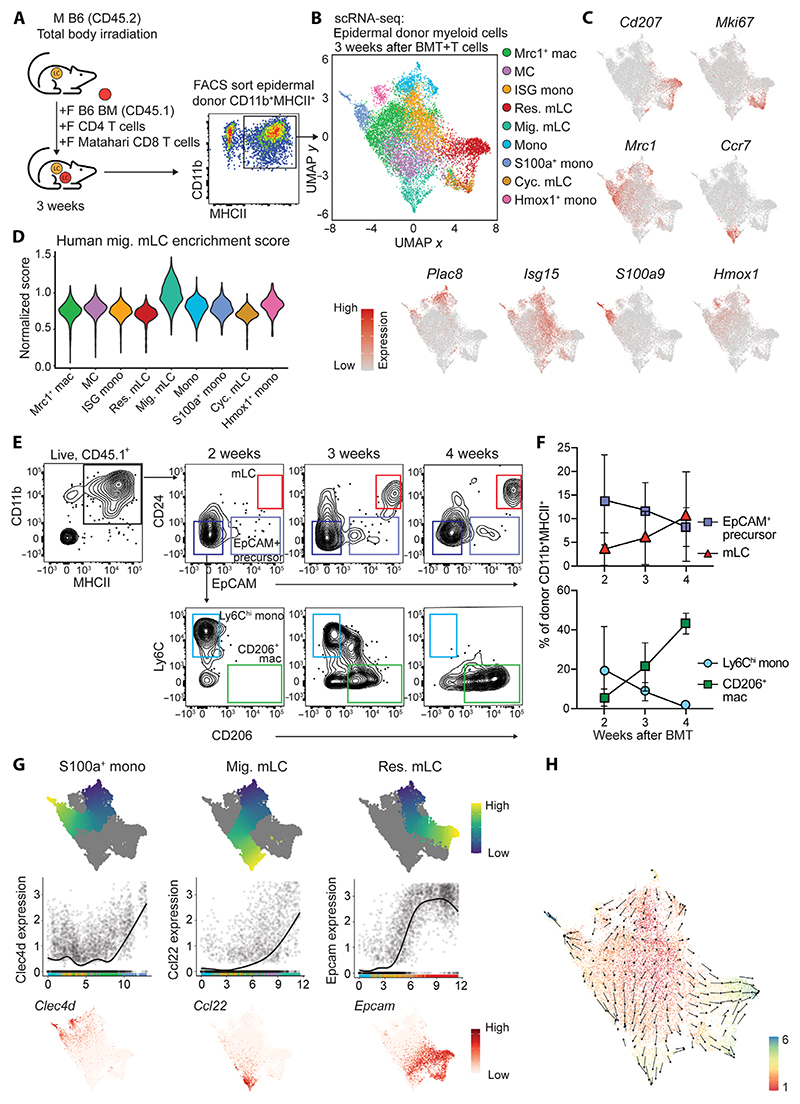
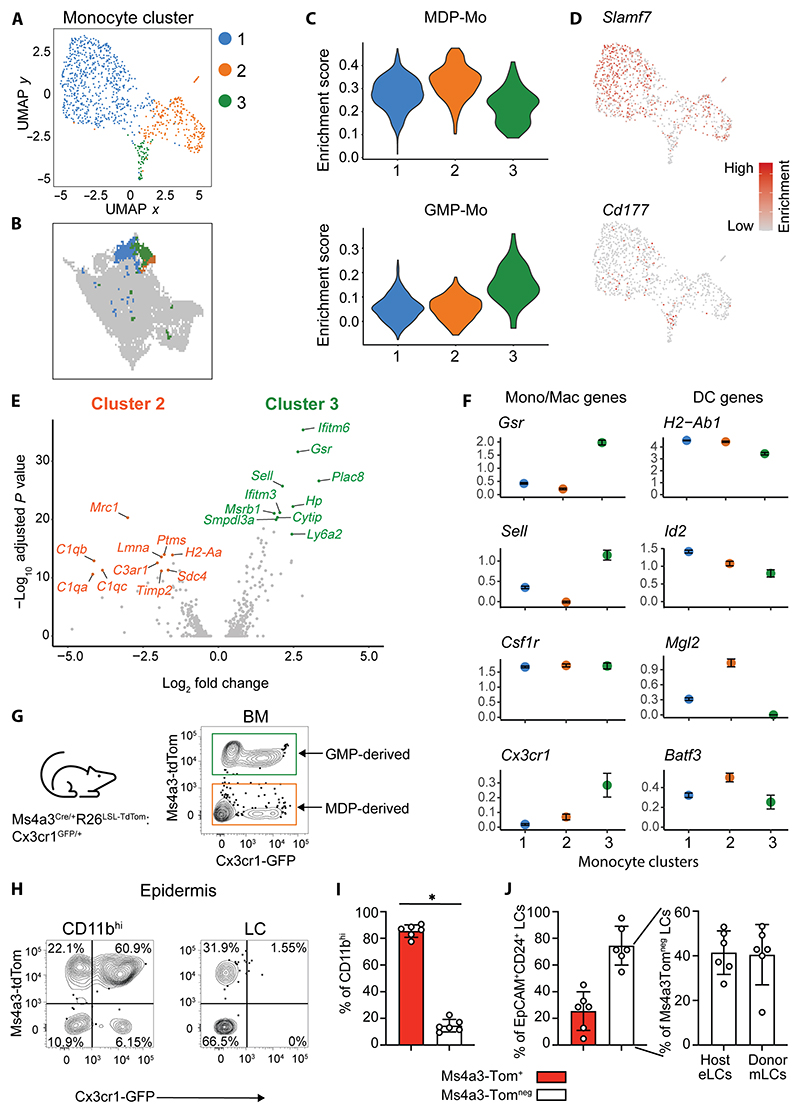
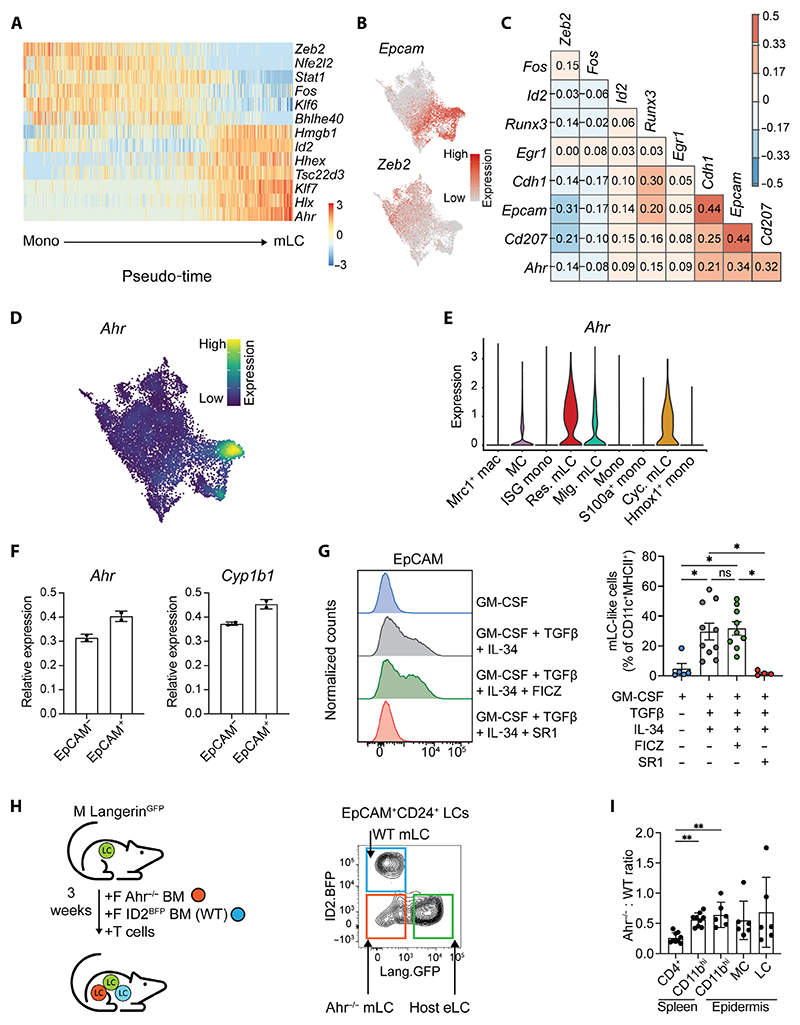
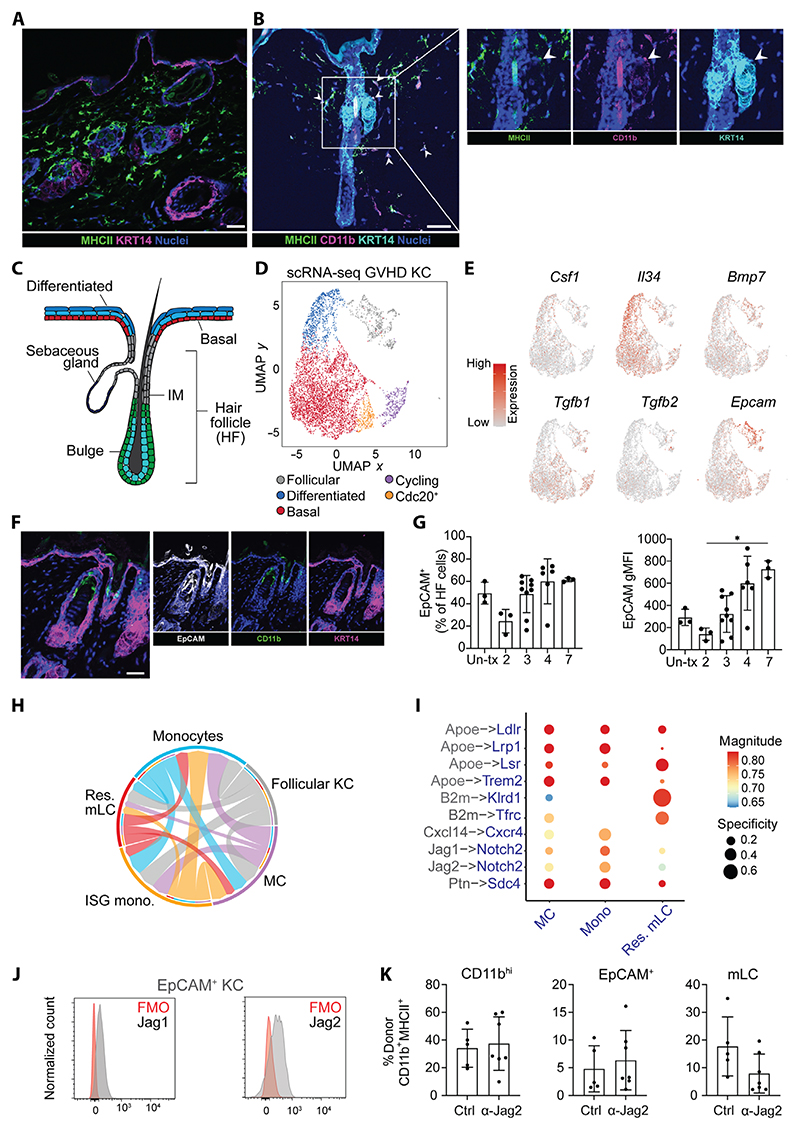
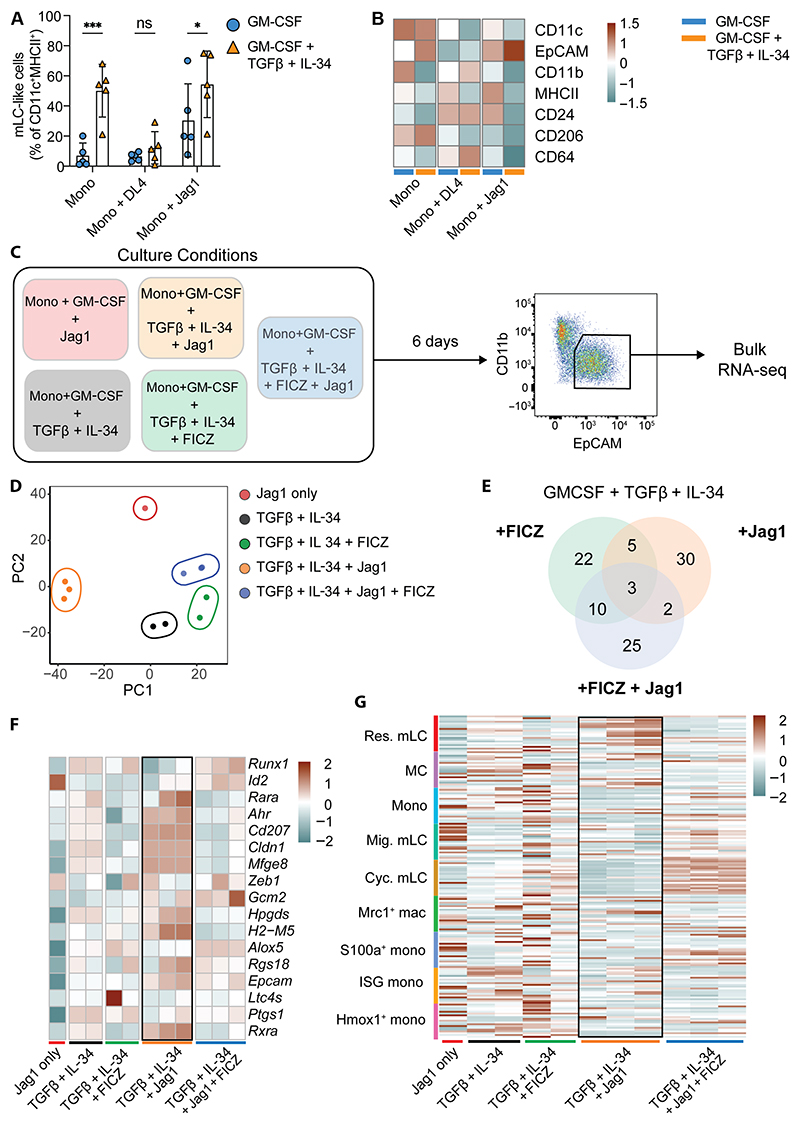
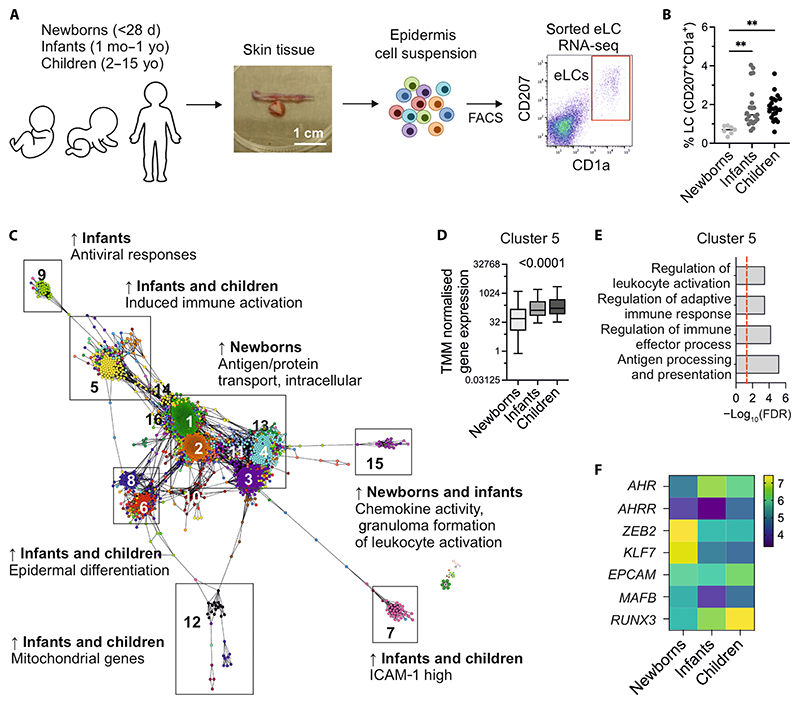
Langerhans cells (LCs) are distinct among phagocytes, functioning both as embryo-derived, tissue-resident macrophages in skin innervation and repair and as migrating professional antigen-presenting cells, a function classically assigned to dendritic cells (DCs). Here, we demonstrate that both intrinsic and extrinsic factors imprint this dual identity. Using ablation of embryo-derived LCs in the murine adult skin and tracking differentiation of incoming monocyte-derived replacements, we found intrinsic intraepidermal heterogeneity. We observed that ontogenically distinct monocytes give rise to LCs. Within the epidermis, Jagged-dependent activation of Notch signaling, likely within the hair follicle niche, provided an initial site of LC commitment before metabolic adaptation and survival of monocyte-derived LCs. In the human skin, embryo-derived LCs in newborns retained transcriptional evidence of their macrophage origin, but this was superseded by DC-like immune modules after postnatal expansion. Thus, adaptation to adult skin niches replicates conditioning of LC at birth, permitting repair of the embryo-derived LC network.


Conflict of interest statement

Competing interests: M.E.P. is currently employed at Johnson and Johnson innovative medicine. Johnson and Johnson innovative medicine or any of employees/stakeholders have not been involved in any part or aspect of the project or manuscript. All other authors declare that they have no competing interests.

Figures

Fig. 1
Fig. 1. scRNA-seq reveals monocyte-derived cell heterogeneity in the inflamed epidermis.
(A) Experimental design showing murine bone marrow transplant model and cells sorted for scRNA-seq from murine epidermis. M, male; F, female. For the full gating strategy, see fig. S1A. (B) Uniform Manifold Approximation and Projection (UMAP) and clustering of murine donor CD11b+MHCII+ cells from murine GVHD epidermis analyzed by scRNA-seq. Data are from two combined independent sorting and sequencing experiments using epidermis from 4 and 10 pooled mice. Mac, macrophage; res. mLC, resident mLC; mig. mLC, migratory mLC; mono, monocyte; cyc. mLC, cycling mLC. (C) Heatmap overlays showing expression of indicated genes across the dataset. Expression scales: Cd207, 0 to 4; Mki67, 0 to 4; Mrc1, 0 to 5; Ccr7, 0 to 4; Plac8, 0 to 5; Isg15, 0 to 4; S100a9, 0 to 6; Hmox1, 0 to 5. (D) Violin plot showing enrichment scores for a human mig. LC gene signature across clusters. (E) Representative flow plots showing donor CD11b+MHCII+ cells from murine GVHD epidermis at the indicated time points after BMT + T cells. Cells were pregated on live, singlet, CD45.1+ (donor) cells. (F) Quantification of populations indicated in (E). Data are presented as means ± S D, (n = 2 for 2 weeks, 8 for 3 weeks, and 2 for 4 weeks). Data are pooled from three independent experiments. (G) Differentiation trajectories calculated with Slingshot overlaid onto UMAP from (B) (above), normalized expression of indicated genes (y axis) across pseudo-time (x axis) for the indicated trajectories (middle), and feature plots showing normalized expression of indicated genes overlaid onto UMAP from (B) (below). Expression scales: Clec4d, 0 to 4; Ccl22, 0 to 6; Epcam, 0 to 4. (H) RNA velocity analysis applied to data from (B). Arrow directions indicate inferred cell trajectory.
Fig. 2
Fig. 2. Monocyte ontogeny determines mLC repopulation.
(A) UMAP and subclustering of monocytes from GVHD epidermis. (B) Clusters from (A) overlaid onto UMAP from Fig. 1B. (C) Violin plots showing enrichment scores for MDP-Mo (top) and GMP-Mo (bottom) gene signatures across clusters from (A). (D) Heatmap overlays showing normalized expression of indicated genes. Expression scales: Slamf7, 0 to 2; Cd177, 0 to 1.5. (E) Volcano plot showing DEGs between cluster 2 and cluster 3 from (A). The top 10 significant DEGs are highlighted. (F) Scatterplots of selected genes across monocyte clusters. (G) Schematic and representative flow plot showing Ms4a3-tdTom and Cx3cr1-GFP expression on live cells isolated from Ms4a3Cre/+R26LSL-TdTomato:Cx3cr1GFP/+ BM. (H) Representative contour plots showing Ms4a3-tdTom and Cx3cr1-GFP expression on epidermal CD11bhigh monocytes and LCs 3 weeks after BMT + T cells. (I) Bar graph showing the frequency of GMP-derived (tdTom+) and MDP-derived (tdTom) cells within epidermal CD11bhigh cells. Data are represented as means ± SD (n = 6; *P = 0.03, Wilcoxon matched pair test). (J) Left: Bar graph showing the frequency of tdTom+ and tdTom epidermal LCs. Right: Bar graph showing the frequency of host (CD45+) and donor (CD45++) cells within the tdTom EpCAM+CD24+ LC gate. Data are represented as means ± SD (n = 6). Data were pooled from two independent experiments.
Fig. 3
Fig. 3. mLC differentiation is associated with loss of Zeb2 and up-regulation of Ahr.
(A) Heatmap showing scaled gene expression of transcription factors that are differentially expressed along the differentiation trajectory (pseudotime) from monocyte to res. mLC. (B) Heatmap overlays showing normalized expression of indicated genes across UMAP from Fig. 1B. Expression scales: Epcam, 0 to 4; Zeb2, 0 to 3. (C) Correlation of selected LC-defining genes (y axis) across all clusters of the scRNA-seq dataset. (D) Density plot showing expression Ahr across cells from scRNA-seq dataset; expression scale from 0 to 0.06. (E) Violin plot showing normalized expression of Ahr across clusters from the scRNA-seq dataset. (F) Bar graphs showing the relative expression (means ± SD) of Ahr and Cyp1b1 in sorted CD11b+EpCAMneg and CD11b+EpCAM+ cells generated in vitro in the presence of FICZ. Expression is normalized to cells treated with GM-CSF + TGFβ + IL-34 alone (n = 2 independent experiments). (G) Representative histogram overlay (left) of EpCAM expression by monocytes cultured for 6 days under the indicated conditions and summary bar graph (right) of mLC-like cells generated from these conditions (for gating, see fig. S4D). Data are represented as means ± SD (n = 5 independent experiments). Statistical differences were assessed using Kruskal-Wallis with Dunn’s multiple comparison test, *P < 0.05. ns, not significant. (H) Left: Schematic showing the experimental setup to generate competitive chimeras. Male LangerinDTR.GFP.B6 mice received a 1:1 mix of BM from female Ahr-replete [Ahr+/+.Id2BFP.B6 reporter mice, wild-type (WT)] or Ahr-deficient (Ahr−/−.B6) donors with Matahari T cells, and donor chimerism was assessed in the epidermis and spleen 3 weeks after transplant. Right: Representative contour plot showing gating of the different populations in the epidermis. (I) Bar graph showing ratio of Ahr−/− to WT frequencies of indicated cell types in the spleens and epidermis of transplanted mice. Data are represented as means ± SD (n = 6 for epidermis and 9 for spleens, from two or three independent experiments). Significant differences were assessed using Kruskal-Wallis with Dunn’s multiple comparison test, **P < 0.01.
Fig. 4
Fig. 4. A specialized follicular keratinocyte niche imprints mLC fate.
(A) Immunofluorescence (IF) image of murine epidermis 4 weeks after BMT + T cells: MHCII+ cells (green), KRT14+ keratinocytes (magenta), and nuclei (blue). Scale bar, 20 μm. (B) IF merged and single images of murine epidermis highlighting CD11b+MHCII+ cells at a KRT14+ upper hair follicle. Scale bar, 50 μm. (C) Schematic of murine hair follicle. IM, isthmus. (D) UMAP visualization of keratinocytes 3 weeks after BMT + T cells analyzed by scRNA-seq. Data were from epidermal cells of five pooled mice 3 weeks after BMT+ T cells. KC, keratinocytes. (E) Heatmap overlays showing normalized expression of indicated genes overlaid onto UMAP from (D). Expression scales: Csf1, 0 to 1.5; Il34, 0 to 2; Bmp7, 0 to 2.5; Tgfb1, 0 to 2; Tgfb2, 0 to 2; Epcam, 0 to 3. (F) Merged and single IF images of murine epidermis 4 weeks after BMT + T cells: EpCAM (white), CD11b (green), and KRT14 (magenta). Scale bar, 20 μm. (G) Bar graphs showing frequency and geometric mean fluorescent intensity (gMFI) of EpCAM+-expressing hair follicle cells from untransplanted (Un-tx) mice or after BMT + T cells. Data are means ± SD (n = 3 control; 2 weeks, n = 3; 3 weeks, n = 9; 4 weeks, n = 7; 7 weeks, n = 3), pooled from three independent experiments. Significance was calculated using Kruskal-Wallis with Dunn’s multiple comparison test, *P < 0.05. (H) Chord plot showing receptor-ligand interactions between follicular KC (gray) and monocytes (blue), ISG monos (orange), MC (purple), and res.mLC (red) assessed by LIANA. The width/weight of each arrow indicates the number of potential interactions identified. (I) Dot plot showing the specificity (NATMI edge specificity) and magnitude (sca LR score) of interactions between follicular KC (gray) and indicated populations (blue). (J) Representative histograms of Jag1 and Jag2 expression by EpCAM+ KC in the epidermis. FMO, fluorescence minus one. (K) Bar graphs showing frequency of CD11bhigh, EpCAM+ precursors and mLCs in mice treated with anti–Jag2 antibodies or anti–IgG isotype control (Ctrl). Data are shown as means ± SD (control, n = 4; anti-Jag2, n = 7) and were pooled from two independent experiments.
Fig. 5
Fig. 5. Notch signaling is sufficient to program mLC differentiation.
(A) Bar graph showing the proportion of mLC-like cells generated from monocytes cultured with GM-CSF alone or GM-CSF, TGFβ, and IL-34 in the presence or absence of indicated Notch ligands (see fig. S7A for gating strategy). Data are shown as means ± SD (n = 5). Significance was calculated by two-way ANOVA with uncorrected Fisher’s least significant difference for multiple comparisons, *P < 0.05; ***P < 0.001. (B) Heatmap showing average gMFI of indicated markers from BM-derived monocytes cultured and analyzed by flow cytometry as indicated in (A) (n = 5). (C) Experimental setup for bulk RNA-seq of mLC-like cells generated under the indicated conditions. (D) PCA plot of bulk RNA-seq samples colored by culture condition. (E) Venn diagram showing numbers of common and unique DEGs between the indicated conditions. (F) Heatmap showing scaled expression of LC signature genes across samples. (G) Heatmap showing expression of gene signatures from epidermal myeloid cell clusters (defined as top 20 DEGs) (y axis) across bulk RNA-seq samples (x axis).
Fig. 6
Fig. 6. Postnatal maturation of eLCs in the human skin induces expression of DC-like immune gene programs that mirror mLC development.
(A) Schematic showing human LC isolation workflow. Skin samples were collected from healthy donors aged 0 to 15 years old, and epidermal cell suspensions were obtained. CD207+CD1a+ cells were FACS purified directly into TRIzol. d, days; mo, months; yo, years old. (B) Percentage of CD207+CD1a+ cells across newborns, infants, and children. Significance was calculated by one-way ANOVA with Tukey’s multiple comparison test, **P < 0.01. (C) Transcript to transcript clustering with visualization using Graphia, 2447 genes, r = 0.75, Markov Cluster (MCL) = 1.7 identified 21 clusters with n > 10 genes, encoding distinct transcriptional programs in human LCs. Arrows indicate enrichment. ICAM-1, intercellular adhesion molecule–1. (D) Average trimmed mean of M (TMM normalized gene expression levels in cluster 5 across newborns, infants, and children. Significance was calculated using one-way ANOVA. (E) Gene ontology ranked with FDR-corrected P values given for cluster 5. (F) Heatmap showing normalized expression of indicated genes.

References

    1. Jakob T, Udey MC. Epidermal Langerhans cells: From neurons to nature’s adjuvants. Adv Dermatol. 1999;14:209–258. - PubMed
    1. Mass E, Ballesteros I, Farlik M, Halbritter F, Günther P, Crozet L, Jacome-Galarza CE, Händler K, Klughammer J, Kobayashi Y, Gomez-Perdiguero E, et al. Specification of tissue-resident macrophages during organogenesis. Science. 2016;353:aaf4238. doi: 10.1126/science.aaf4238. - DOI - PMC - PubMed
    1. Kaplan DH. Ontogeny and function of murine epidermal Langerhans cells. Nat Immunol. 2017;18:1068–1075. doi: 10.1038/ni.3815. - DOI - PMC - PubMed
    1. Ginhoux F, Tacke F, Angeli V, Bogunovic M, Loubeau M, Dai X-M, Stanley ER, Randolph GJ, Merad M. Langerhans cells arise from monocytes in vivo. Nat Immunol. 2006;7:265–273. doi: 10.1038/ni1307. - DOI - PMC - PubMed
    1. Zhang S, Edwards TN, Chaudhri VK, Wu J, Cohen JA, Hirai T, Rittenhouse N, Schmitz EG, Zhou PY, McNeil BD, Yang Y, et al. Nonpeptidergic neurons suppress mast cells via glutamate to maintain skin homeostasis. Cell. 2021;184:2151–2166.:e16. doi: 10.1016/j.cell.2021.03.002. - DOI - PMC - PubMed

Publication types