. 2024 Sep 6;10(36):eadn6858.
doi: 10.1126/sciadv.adn6858. Epub 2024 Sep 6.

Excitable Rho dynamics control cell shape and motility by sequentially activating ERM proteins and actomyosin contractility

Affiliations

Excitable Rho dynamics control cell shape and motility by sequentially activating ERM proteins and actomyosin contractility

Seph Marshall-Burghardt et al. Sci Adv. .

Abstract

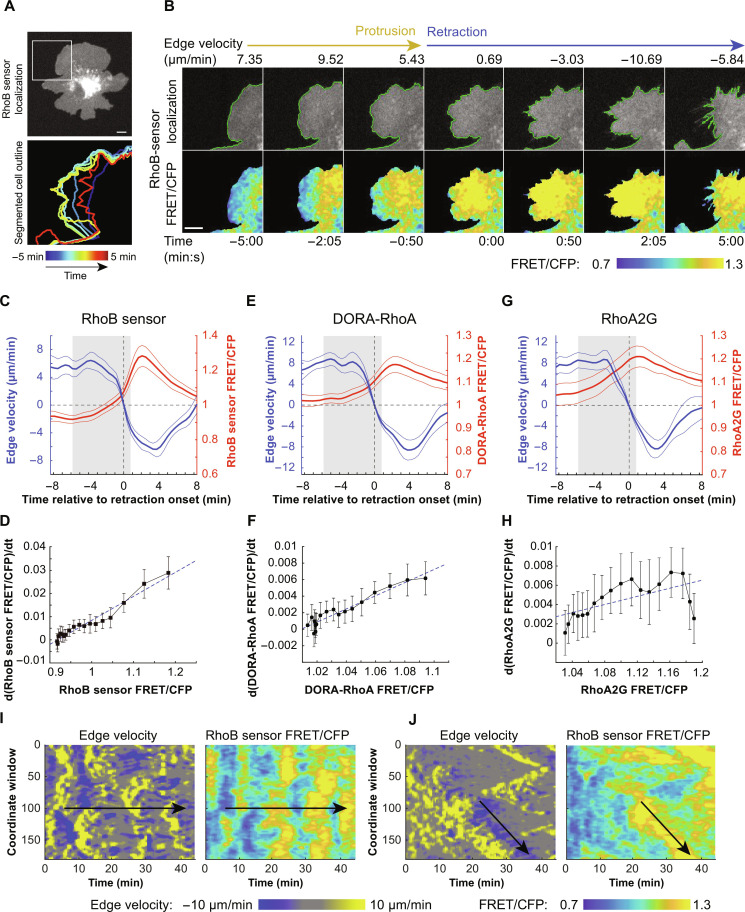
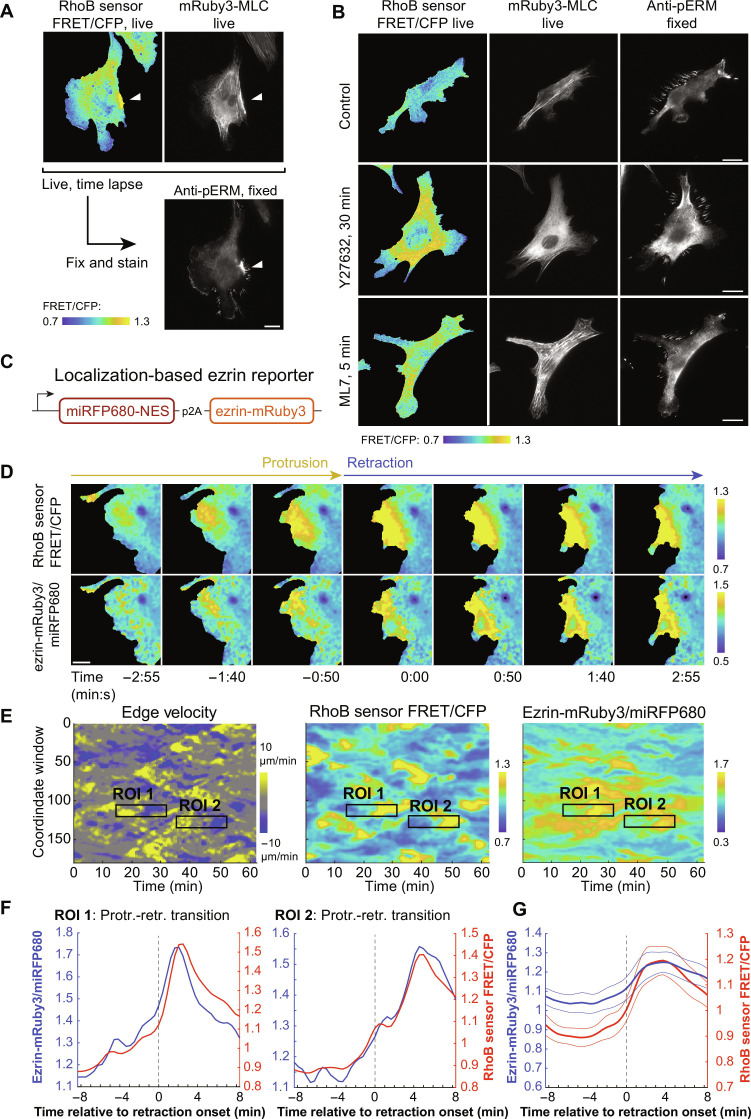
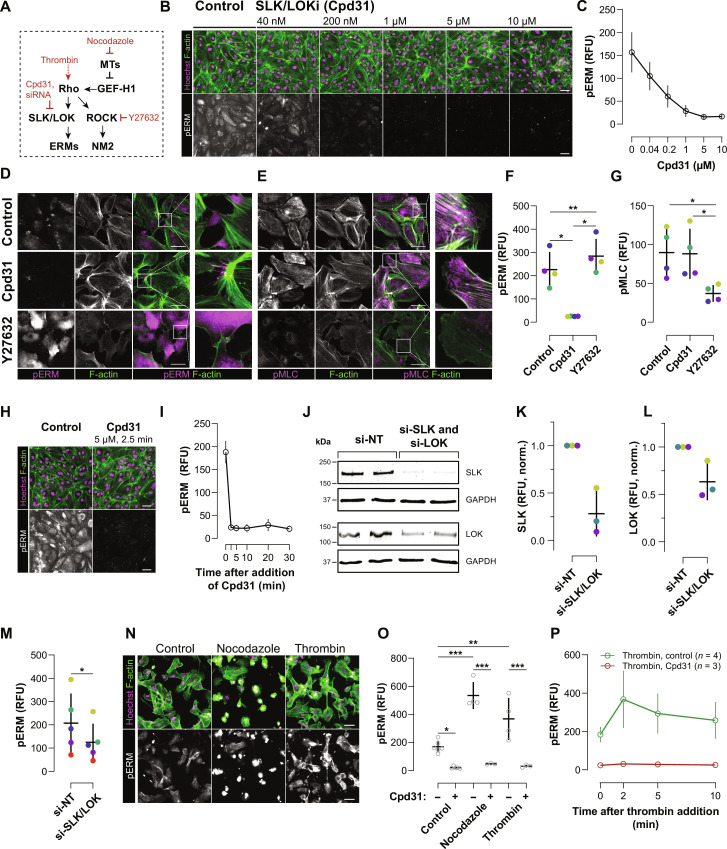
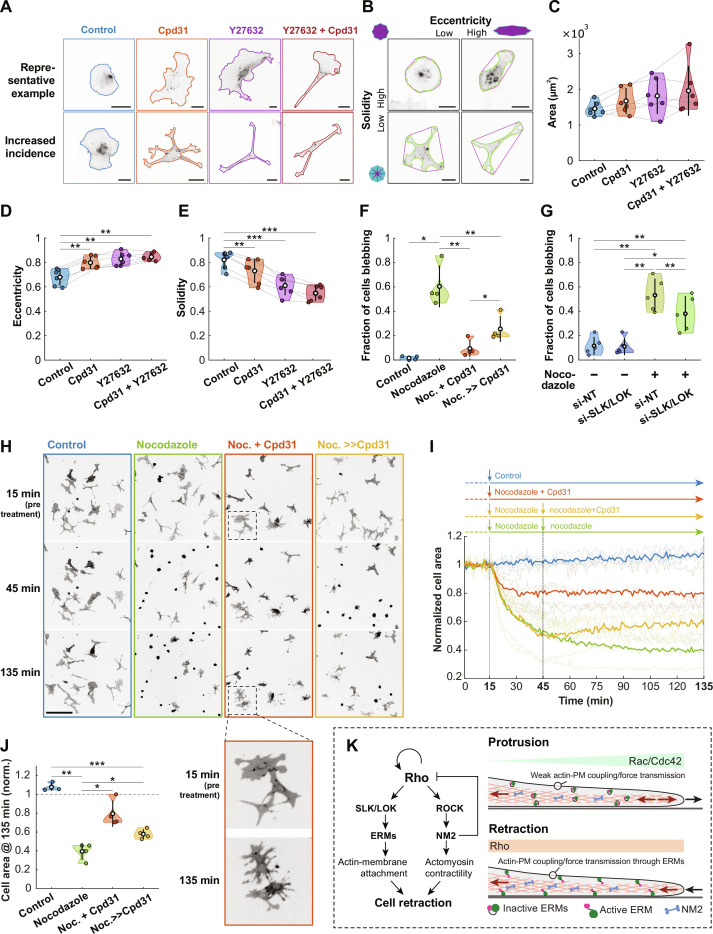
Migration of endothelial and many other cells requires spatiotemporal regulation of protrusive and contractile cytoskeletal rearrangements that drive local cell shape changes. Unexpectedly, the small GTPase Rho, a crucial regulator of cell movement, has been reported to be active in both local cell protrusions and retractions, raising the question of how Rho activity can coordinate cell migration. Here, we show that Rho activity is absent in local protrusions and active during retractions. During retractions, Rho rapidly activated ezrin-radixin-moesin proteins (ERMs) to increase actin-membrane attachment, and, with a delay, nonmuscle myosin 2 (NM2). Rho activity was excitable, with NM2 acting as a slow negative feedback regulator. Strikingly, inhibition of SLK/LOK kinases, through which Rho activates ERMs, caused elongated cell morphologies, impaired Rho-induced cell contractions, and reverted Rho-induced blebbing. Together, our study demonstrates that Rho activity drives retractions by sequentially enhancing ERM-mediated actin-membrane attachment for force transmission and NM2-dependent contractility.


Figures

Fig. 1.
Fig. 1.. Random motility of HT-HUVEC, cell-edge velocity tracking, and validation of FRET probes for Rho, Rac, and Cdc42 in HT-HUVEC.
(A) HT-HUVEC cell expressing the RhoB sensor, overlayed with temporally color-coded cell outlines to illustrate protrusion-retraction cycles over 60 min. Scale bar, 10 μm. (movie S1). (B) Illustration of cell edge velocity analysis (Materials and Methods). Left: Masked HT-HUVEC cell expressing RhoB sensor. Scale bar, 10 μm. Right: Close-up showing equally spaced cell edge windows (red) and per frame displacement (blue, yellow arrows). (C) Left: Corresponding cell-edge velocity map from (A), (top right) segmented protrusions and (bottom right) retractions, based on defined spatiotemporal parameters (Materials and Methods). (D) Spatiotemporal parameters of individual protrusions and retractions as identified in (C). Data points are individual events, and violin plot displays means ±25th/75th percentile of events as bolded black lines from n = 54 cells from three biological replicates. (E) FRET probes for Rho (RhoB sensor, DORA-RhoA, and RhoA2G) were stably expressed in HT-HUVEC, and their responses to thrombin (1 U/ml) were measured over 55 min in subconfluent cultures. Responses normalized to control-treated cells, means of n = number of FOV analyzed as indicated ±95% confidence interval (CI), from two biological replicates. (F) Responses of the RhoB sensor and FRET probes for Rac and Cdc42 (RaichuEV-Rac and RaichuEV-Cdc42) to thrombin stimulation (0.5 U/ml) were assessed, similar to (E). Means of n = 20 fields of view (FOV) per condition ±95% CI, from two biological replicates. (G) Strategy to acutely (in)activate RhoGTPases by plasma membrane translocation of RhoGEF and RhoGAP domains through addition of rapamycin. (H to K) HT-HUVEC expressing RhoB sensor, RaichuEV-Rac, or RaichuEV-Cdc42 were transiently contransfected with Lyn-FRB and mCherry-FKBP-RhoGEF/GAP as indicated, and RhoGTPase FRET/CFP signals were measured in response to rapamycin addition (0.5 μM). Means ±95% CI, normalized to untransfected cells, from n = number cells as indicated, from two biological replicates.
Fig. 2.
Fig. 2.. Spatiotemporal analysis of Rac, Cdc42, and Rho activities in HT-HUVEC.
(A) RaichuEV-Rac. (B) RaichuEV-Cdc42. (C) RhoB sensor. (D) DORA-RhoA. (E) RhoA2G (movies S2 to S6). (a) Graphs showing differences in relative FRET activity in thresholded protrusions and retractions for each probe tested at a window edge depth of 1.95 μm. Protrusions > 3.86 μm/min, retractions < −3.86 μm/min, each minimum 25 pixels on edge velocity heatmaps. Individual protrusions and retractions were normalized to edge-proximal FRET activity in nonmoving edge areas during the same time span. Left x axis shows probability density functions (PDF) of retractions in blue and protrusions in yellow. Box plot on the right x axis: the bolded center line denotes dataset median, colored boxes show 25th and 75th percentiles, and whiskers show total dataset range. Outliers are shown with red crosses. Data for each probe were from three biological replicates. RaichuEV-Rac: 30 cells, 489 protrusions, 299 retractions. RaichuEV-Cdc42: 29 cells, 552 protrusions, 308 retractions, RhoB sensor: 36 cells, 726 protrusions, 413 retractions. DORA-RhoA: 30 cells, 771 protrusions, 672 retractions, RhoA2G: 40 cells, 1100 protrusions, 1021 retractions. ***P < 0.001, Mann-Whitney U test. (b) Examples of spatiotemporal heatmaps for individual cells from 62.5-min time-lapse acquisitions. Left: Edge velocity, with protrusions in yellow and retractions in blue. Middle: Corresponding RhoGTPase activity, measured within 1.95 μm from the cell edge. Right: Cross-correlation between edge velocity and RhoGTPase activity from the two heatmaps. (c) Cross-correlation of RhoGTPase activity relative to edge velocity for each probe at a window depth of 1.95 μm. Pink traces represent single cells, and bold black traces are means. Negative lag denotes peak RhoGTPase activity following peak edge velocity and vice versa. RaichuEV-Rac, n = 34 cells; RaichuEV-Cdc42, n = 28 cells; and RhoB sensor, n = 27 cells, from two biological replicates. DORA-RhoA, n = 29 cells and RhoA2G, n = 40 cells, from three biological replicates.
Fig. 3.
Fig. 3.. Pulsatile activation of Rho in cell-edge retractions.
(A) Top: HT-HUVEC expressing the RhoB sensor, with region of interest (ROI) denoted by white box. Scale bar, 10 μm. Bottom: Local cell-edge displacements over 10 min of the protrusion-retraction event shown in (B). (B) Time-lapse illustrating RhoB sensor activation during a protrusion-retraction event during a 10-min interval. Time = 00:00 denotes retraction onset. Scale bar, 10 μm. (movie S8). (C, E, and G) Activity buildup plots displaying averaged RhoB sensor, DORA-RhoA, and RhoA2G activities, respectively, compared during protrusion-retraction transitions. Time = 0 denotes the protrusion-retraction transition. Gray shaded region shows time points included in the rate-of-change analysis in (D), (F), and (H). Means ±95% CI. RhoB sensor: n = 23 events, DORA-RhoA: n = 33 events, RhoA2G: n = 25 events, from three biological replicates. (D, F, and H) Plot of the rate of change in Rho activation as a function of Rho activity from approximately t = −6 min to t = 1 min (18 25-s time points) from the buildup plots for RhoB sensor, DORA-RhoA, and RhoA2G. Black boxes denote time point means, and error bars show ±95% CI. Linear line of best fit shown by dotted blue line. (I and J) Edge velocity (left) and RhoB sensor activity maps (right) (window depth 1.95 μm) of representative cells illustrating (I) pulsatile activity and (J) a propagating wave of RhoB sensor activity. ROI was denoted by black arrows on both sets of maps (movies S9 and S10).
Fig. 4.
Fig. 4.. Rho, ROCK, and NM2 are part of an excitable system during membrane retractions.
(A) Time-lapse showing Rho activation and NM2 accumulation in a RhoB sensor and mRuby3-MLC–expressing HT-HUVEC. Red edge windows show 1.95-μm window depth for RhoB sensor and 6.5 μm for MLC-mRuby3. t = 0 denotes retraction onset. Scale bar, 10 μm. (movie S11). (B) Thirty protrusion-retraction events from three biological replicates. RhoB sensor window depth, 1.95 μm; mRuby3-MLC window depth, 6.5 μm. Bolded lines represent means, bordered by ±95% CI. (C, D, and G) RhoB sensor activity responses to acute inhibition of MLCK (ML7, 20 μM), ROCK (Y27632, 20 μM), or ROCK and MLCK (Y27632 + ML7, both 20 μM). Drug responses were normalized to control-treated samples. Bolded lines denote means, bordered by ±95% CI. Twenty-six FOV for each condition, from three biological replicates. (E) Effect of MLCK inhibition (ML7, 20 μM) on RhoB sensor activity (top) and mRuby3-MLC distribution (bottom). RhoB sensor FRET/CFP signal labeled above top row, and standard deviation of pixel distribution to measure granularity of MLC signal labeled below bottom row. Scale bar, 10 μm. (movie S12). (F) Effect of ROCK inhibition (Y27632, 20 μM) on RhoB sensor activity (top) and mRuby3-MLC distribution (bottom). RhoB sensor activity labeled above top row, and SD of pixel distribution to measure granularity of mRuby3-MLC signal labeled below bottom row. Scale bar, 10 μm. (movie S13). (H) Percent area change of cell adhesion surface 30 min after addition of control, 20 μM Y27632, 20 μM ML7, or a combination of 20 μM Y27632 and 20 μM ML7. Bolded circles denote median, black lines denote 25th/75th percentiles, and individual data points for n = 26 FOV each for control, Y27632, and ML7 conditions, from three biological replicates. *P < 0.05 and ***P < 0.001, one-way ANOVA/Tukey-Kramer. (I) Diagram illustrating the relationship between Rho’s downstream effectors ROCK and NM2 and the drugs used in (C) to (H).
Fig. 5.
Fig. 5.. Rho activity and ERM activation are spatiotemporally coupled.
(A) HT-HUVEC coexpressing RhoB sensor and mRuby3-MLC showing RhoB FRET activity (live), mRuby3-MLC (live), and corresponding anti-pERM signals following fixation and immunostaining. White arrowhead denotes retraction site. Scale bar, 20 μm. (movie S14). (B) HT-HUVEC coexpressing RhoB sensor and mRuby3-MLC were imaged after no treatment, 30 min after 10 μM Y27632 addition, or 5 min after 5 μM ML7 addition; fixed; and processed for anti-pERM immunostaining. Drug-induced increases of RhoB sensor activity colocalized with increased pERM staining. Scale bars, 20 μm. (C) Schematic of the localization-based ezrin reporter. (D) Time-lapse showing RhoB sensor activity and ezrin-mRuby3/miRFP680 ratio during an individual protrusion-retraction transition. Time = 0:00 denotes retraction onset. Scale bar, 10 μm. (movie S15). (E) Spatiotemporal heat maps depicting edge velocity, RhoB sensor activity, and ezrin-mRuby3/miRFP680 ratio, both measured at 1.95-μm window depths. ROIs 1 and 2 correspond to the regions used to generate the correspondingly labeled individual activity buildup plots in (F). (F) Protrusion-retraction events outlined in (E) displaying average ezrin-mRuby3/miRFP680 ratios in blue and averaged RhoB sensor activities in red. Time = 0 denotes retraction onset. (G) Compiled protrusion-retraction transitions showing normalized ezrin-mRuby3/miRFP680 ratios in blue and RhoB sensor activities in red. Time = 0 denotes protrusion-retraction transition. Bolded lines represent means, bordered by ±95% CI. Nineteen events from three biological replicates.
Fig. 6.
Fig. 6.. Rho rapidly activates ERMs via SLK/LOK.
(A) Perturbation strategies to investigate Rho-induced ERM activation. (B) pERM signal in HT-HUVEC in response to increasing concentrations of the SLK/LOK inhibitor Cpd31 (4 hours). (C) Quantification of (B) using quantitative immunofluorescence (Materials and Methods), means ± SD from n = 3 biological replicates. (D and E) HT-HUVEC treated with Cpd31 (5 μM, 1 hour) or Y27632 (20 μM, 1 hour) and stained for F-actin, pERM, and pMLC. (F and G) Quantifications of pERM and pMLC in response to Cpd31 and Y27632 using quantitative immunofluorescence. Means ± SD from n = 4 biological replicates. Colors of datapoints are matched by replicate. *P < 0.05 and **P < 0.01, one-way ANOVA/Tukey-Kramer. (H and I) Cells rapidly lose pERM signals when treated with Cpd31 (5 μM). Quantitative immunofluorescence, means ± SD from n = 3 biological replicates. (J) Lysates of control (si-NT) or SLK/LOK codepleted (si-SLK/si-LOK) cells were analyzed by Western blotting. (K and L) Quantifications of (J), means ± SD from n = 3 biological replicates. Colors of data points are matched by replicate. (M) Reduced pERM in cells codepleted of SLK/LOK (si-SLK/LOK), as determined by quantitative immunofluorescence. Means ± SD from n = 5 biological replicates. Colors of data points are matched by replicate. *P < 0.05, two-tailed, paired t test. (N) Treatment with nocodazole (15 μM, 30 min) or thrombin (1 U/ml, 2 min) increased pERM in HT-HUVEC. (O) Nocodazole and thrombin-induced increases in pERM were abolished when Cpd31 (5 μM) was present. Means ± SD from n = 3 to 6 biological replicates are shown. *P < 0.05, **P < 0.01, and ***P < 0.001, one-way ANOVA/Tukey-Kramer. (P) pERM signals rapidly increased upon thrombin stimulation (1 U/ml), except when Cpd31 (5 μM) was present. Means ± SD from n = 4 (thrombin) or n = 3 (thrombin + Cpd31) biological replicates. Scale bars, 50 μm. RFU, relative fluorescence unit.
Fig. 7.
Fig. 7.. SLK/LOK-dependent ERM activation regulates cell morphology and is required for Rho-driven cell contractions.
(A) HT-HUVEC plated without (control) or with Cpd31 (5 μM), Y27632 (10 μM), or Cpd31 and Y27632 present. Representative cell shapes with average (top) and increased incidence (bottom) morphologies. (B) Examples of varying solidity and eccentricity. (C) Average cell area, (D) eccentricity, and (E) solidity. Means ± SD and data points from n = 6 biological replicates (control: 1141 cells, Cpd31: 966 cells, Y27632: 776 cells, and Cpd31 and Y27632: 696 cells). (F) Fraction of HT-HUVEC expressing RhoB sensor blebbing after control treatment, 2 hours nocodazole (15 μM), 2 hours nocodazole (15 μM) and Cpd31 (5 μM), or 2 hours nocodazole (15 μM), with Cpd31 (5 μM) added after 30 min [as depicted in schematic in (I), t = 135 min]. (G) Fraction of blebbing HT-HUVEC, expressing mScarlet3-CAAX and transfected with either si-NT or si-SLK/LOK, control treated or treated with nocodazole (15 μM, 2 hours). Means ± SD and data points from n = 5 biological replicates. (H) HT-HUVEC expressing RhoB sensor treated as depicted in the schematic in (I). Nocodazole (15 μM) and Cpd31 (5 μM). RhoB sensor localization was used to visualize cells. Zoom-in shows fragmented cells in nocodazole and Cpd31 condition (movie S17). (I) Average area covered by cells per FOV as a function of time, normalized to average cell area pre-addition. First treatment 15 min; second treatment, 45 min (black dashed lines). Bold traces denote means of n = 4 biological replicates (dashed lines). (J) Average cell-covered area per FOV in (I) at t = 135 min for each condition, normalized to pretreatment. (I, and J) Means from n = 4 biological replicates (control: 14, nocodazole: 13, nocodazole + Cpd31: 14, and nocodazole ≫ Cpd31: 14 FOVs). (K) Model for how excitable Rho activity drives cell contractions through both ERM activation via SLK/LOK and ROCK-mediated actomyosin contractility (see main text). *P < 0.05, **P < 0.01, and ***P < 0.001, one-way ANOVA/Tukey-Kramer. Scale bars, 20 μm (A and B) and 200 μm (H).

References

    1. Dubin-Thaler B. J., Hofman J. M., Cai Y., Xenias H., Spielman I., Shneidman A. V., David L. A., Döbereiner H.-G., Wiggins C. H., Sheetz M. P., Quantification of cell edge velocities and traction forces reveals distinct motility modules during cell spreading. PLOS ONE 3, e3735 (2008). - PMC - PubMed
    1. Allard J., Mogilner A., Traveling waves in actin dynamics and cell motility. Curr. Opin. Cell Biol. 25, 107–115 (2013). - PMC - PubMed
    1. Verkhovsky A. B., The mechanisms of spatial and temporal patterning of cell-edge dynamics. Curr. Opin. Cell Biol. 36, 113–121 (2015). - PubMed
    1. Lou S. S., Diz-Muñoz A., Weiner O. D., Fletcher D. A., Theriot J. A., Myosin light chain kinase regulates cell polarization independently of membrane tension or Rho kinase. J. Cell Biol. 209, 275–288 (2015). - PMC - PubMed
    1. SenGupta S., Parent C. A., Bear J. E., The principles of directed cell migration. Nat. Rev. Mol. Cell Biol. 22, 529–547 (2021). - PMC - PubMed

Publication types