. 2024 Sep 6;20(9):e1012509.
doi: 10.1371/journal.ppat.1012509. eCollection 2024 Sep.

The triglyceride-synthesizing enzyme diacylglycerol acyltransferase 2 modulates the formation of the hepatitis C virus replication organelle

Affiliations

The triglyceride-synthesizing enzyme diacylglycerol acyltransferase 2 modulates the formation of the hepatitis C virus replication organelle

Isabelle Reichert et al. PLoS Pathog. .

Abstract

The replication organelle of hepatitis C virus (HCV), called membranous web, is derived from the endoplasmic reticulum (ER) and mainly comprises double membrane vesicles (DMVs) that concentrate the viral replication complexes. It also tightly associates with lipid droplets (LDs), which are essential for virion morphogenesis. In particular acyl-CoA:diacylglycerol acyltransferase 1 (DGAT1), a rate-limiting enzyme in triglyceride synthesis, promotes early steps of virus assembly. The close proximity between ER membranes, DMVs and LDs therefore permits the efficient coordination of the HCV replication cycle. Here, we demonstrate that exaggerated LD accumulation due to the excessive expression of the DGAT1 isozyme, DGAT2, dramatically impairs the formation of the HCV membranous web. This effect depended on the enzymatic activity and ER association of DGAT2, whereas the mere LD accumulation was not sufficient to hamper HCV RNA replication. Our lipidomics data indicate that both HCV infection and DGAT2 overexpression induced membrane lipid biogenesis and markedly increased phospholipids with long chain polyunsaturated fatty acids, suggesting a dual use of these lipids and their possible competition for LD and DMV biogenesis. On the other hand, overexpression of DGAT2 depleted specific phospholipids, particularly oleyl fatty acyl chain-containing phosphatidylcholines, which, in contrast, are increased in HCV-infected cells and likely essential for viral infection. In conclusion, our results indicate that lipid exchanges occurring during LD biogenesis regulate the composition of intracellular membranes and thereby affect the formation of the HCV replication organelle. The potent antiviral effect observed in our DGAT2 overexpression system unveils lipid flux that may be relevant in the context of steatohepatitis, a hallmark of HCV infection, but also in physiological conditions, locally in specific subdomains of the ER membrane. Thus, LD formation mediated by DGAT1 and DGAT2 might participate in the spatial compartmentalization of HCV replication and assembly factories within the membranous web.


Conflict of interest statement

The authors have declared that no competing interests exist.

Figures

Fig 1
Fig 1. Increased DGAT2 expression hampers hepatitis C virus (HCV) infection.
(A) Whole replication cycle assay of JcR2a. Lunet N hCD81 cells overexpressing DGAT2, DGAT2_L83A or DGAT2_HPH161-163AAA were infected with JcR2a and cell lysates were harvested 48 h post infection (hpi) for Renilla luciferase (RLuc) assay. The supernatant was transferred onto Huh-7.5 cells and cell lysates were harvested 72 hpi. Relative light units (RLU) of n = 2–4 were plotted. (B) DGAT2 mRNA expression levels in stable overexpressing Lunet N hDC81 cell lines compared to parental Lunet N hCD81 and primary human hepatocytes (PHHs) were measured by RT-qPCR. Values are normalized to the average DGAT2 mRNA expression levels in Lunet N hCD81 [empty]. Mean ± SEM of n = 3 or 8 for PHH donors are shown. (C) Lunet N hCD81 [empty] or [DGAT2] were treated with a DGAT2 small molecular inhibitor (DGAT2i) 48 h prior to and 4 h post JcR2a infection. Applied inhibitor concentrations ranged from 0–5 μM for DGAT2i. Viral replication was assessed by luciferase assay and values are depicted relative to the respective DMSO control (0 nM inhibitor), n = 3. (D-G) Full-length JcR2a (D), JFH1 NS3-5B subgenomic replicon (SGR) (E), Con1 NS3-5B SGR (F) or DBN3A NS3-5B SGR (G) in vitro transcripts (IVTs) were transfected in Lunet N hCD81 [empty] (black), [DGAT2] (red), [DGAT2_L83A] (light blue), or [DGAT2_HPH161-163AAA] (dark blue) cell lines by electroporation. The replication inhibitor Daclatasvir was added at 1 nM to transfected Lunet N hCD81 [empty] cells as a control for viral replication. Viral replication was measured by luciferase assay at 4–72 hpi. Mean values normalized to 4 hpi ± SEM are shown (n = 3). (H) pIRF1b dual luciferase reporter IVTs were transfected in Lunet N hCD81 [empty] or [DGAT2] cells followed by 8 h incubation in the presence or absence of 20 μM cycloheximide (CHX). Firefly luciferase (FLuc) and RLuc signals were measured and plotted normalized to Lunet N hCD81 [empty]. n = 4. Each dot in (A, B and H) represents one biological replicate. Statistical tests were performed for the individual cell lines against the [empty] (A, B) or untreated (C) control group. In (D-G), significant changes of 72 h values compared to [empty] control group are shown. The asterisk color corresponds to the respective cell line.
Fig 2
Fig 2. Increased DGAT2 expression impairs the formation of HCV replication factories.
(A) Doxycycline (Dox)-inducible HA-DGAT2 Lunet N hCD81 cells were treated with Dox for the indicated time period before lysis for Western blot analysis. The first lane shows Lunet N hCD81 [empty] control cell lysate. HA-DGAT2 (~45–50 kDa) was detected by an anti-HA antibody, GAPDH (~36 kDa) was stained as loading control. (B) Dox-inducible HA-DGAT2 Lunet N hCD81 cells were infected with JcR2a and treated with Dox at different times prior to and post infection (untreated, 24 h prior to infection, 4 or 24 hours post infection (hpi)). Cell lysates were harvested for luciferase assay at 24, 32, 40 and 48 hpi. Each dot represents one biological replicate (n = 3). (C) Localization of HA-DGAT2 in HCV-infected cells. Dox-inducible HA-DGAT2 Lunet N hCD81 cells were infected with Jc1 and treated with DMSO vehicle control (left panel) or Dox (right panel) 4 hpi. The cells were fixed 48 hpi. NS5A (green) and HA-DGAT2 (magenta) were detected by immunofluorescence staining. Nuclei were stained with DAPI (blue). The white box area in the overview image (left side) is enlarged for each channel (right side). The intensity plot profile was computed along the depicted dotted yellow line. Representative images of 3 independent experiments are shown. (D) Automated z-stack image quantification of HCV NS5A puncta. Cell nuclei and NS5A puncta were automatically segmented. NS5A puncta were quantified in the z-stack images after excluding duplicate puncta appearing at the same position in consecutive slides of the z-stack. The number of NS5A puncta was normalized for the nuclear area of HCV-positive cells in each image field. (E) NS5A puncta quantification was performed in stable Lunet N hCD81 cell lines expressing DGAT2, DGAT2_L83A or DGAT2_HPH161-163AAA 48 h post transfection with JcR2a (n = 2). A.U. = arbitrary units. Results of statistical analysis are indicated by asterisks.
Fig 3
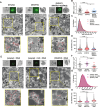
Fig 3. Effect of DGAT2 overexpression and oleic acid treatment on DMV formation.
(A-H) Stable Lunet T7 cells overexpressing [DGAT2] or [DGAT2_HPH161-163AAA] were transfected with the pTM expression vector encoding HCV NS3-5B/5AEGFP. Cells were fixed 24 h post transfection. Transfected cells were first identified by GFP signal then fixed and further processed for CLEM analysis. In panels (E-H), transfected cells were additionally treated after 18 h with BSA (30 μg/mL) or 360 μM oleic acid (OA) combined with BSA. (A, E) Representative images. The upper panel shows from left to right bright-field, fluorescent and electron microscopy overview images of a representative cell. The transmission electron microscopy (TEM) image in the middle panel is further enlarged in the yellow box area and depicted in the lower panel. Red asterisks indicate DMVs. Scale bar for middle image, 1 μm; for magnified image, 500 nm. (B, C, F, G) DMV and (D, H) LD profiles were analyzed using TEM images taken at x4 k magnification. (B, F) Number of DMVs per μm2, (C, G) size distribution of DMVs and (D, H) diameter of LDs in nm, respectively. Statistical tests were performed for the individual cell lines against the [empty] (B, C, D) or [empty]+BSA (F, G, H) control group. Results of statistical analysis are indicated by asterisks.
Fig 4
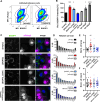
Fig 4. Increased DGAT2 expression increases LD size.
(A) Example plots of flow cytometry assay to determine the LD amount in the tested cell lines. Stable Lunet N hCD81 cell lines were harvested and mixed with mRuby2-positive reference cells prior to staining with the LD dye BODIPY 493/503. BODIPY and mRuby2 signal intensities were measured by flow cytometry. To determine the LD amount in the cell lines of interest, BODIPY mean fluorescence intensity (MFI) was compared in each sample between the cells of interest (mRuby2-negative, bottom gate) and the mRuby2-positive reference cell population (top gate). The vertical line was added to highlight the shift in BODIPY signal intensity between the DGAT2-overexpressing and the reference cells, in the plot on the right. (B) Relative LD amount in the DGAT2-overexpressing or OA-treated (36, 120, 360 μM) cell lines. Values were normalized to [empty] control cells (n = 3). (C) Lunet N hDC81 cells stably expressing [empty], [DGAT2], [DGAT2_L83A] or [DGAT2_HPH161-163AAA] were co-seeded with Lunet N hCD81/mRuby2 cells. Cells were fixed and stained with BODIPY 493/503. Representative images of 2 biological repeats. (D) Histograms of relative LD sizes in the Lunet N hCD81 DGAT2 cell lines (colorful bars) compared to the mRuby2-positive cells (grey bars), n = 2. X-axis indicates the LD area in pixels. (E, F) LD area (E) and LD count per cell (F) in Lunet N hCD81 DGAT2 cell lines normalized to the mRuby2-positive cells. Each dot represents the values for one quantified image of two independent replicates (16–18 images altogether per condition). Results of statistical analysis are indicated by asterisks.
Fig 5
Fig 5. Subcellular localization of HA-tagged DGAT2.
Lunet N hCD81 cells were transduced with lentiviruses to express HA-tagged DGAT2 (A-F). In (E) and (F), cells were treated with 360 μM oleic acid (OA) 6 h prior to fixation. HADGAT2 was detected with anti-HA immunofluorescence staining and depicted in magenta. ER (Calnexin, (A)), mitochondria (CoxIV (B)) and LDs (BODIPY 493/503 (C, E), ADRP (D, F)) were co-stained and depicted in green. Nuclei were stained with DAPI and depicted in blue. The white box area in overview images (upper row of images in each panel) is enlarged in the lower row. Intensity plot profiles were computed along the depicted dotted yellow line. Representative images of at least 3 independent experiments are shown.
Fig 6
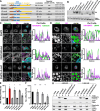
Fig 6. Effect of subcellular localization on the antiviral activity of DGAT2.
(A) A panel of previously described HA-tagged DGAT2 mutants comprising variants deficient in ER (ER mut), LD (LD mut1 and LD mut2) or mitochondria (mito mut1, mito mut2) association was cloned and transduced in Lunet N hCD81 FLuc cells. 48 h post transduction, we analyzed the protein expression (B), localization (C, D), and effect on LD accumulation (E), or infected the cells with JcR2a to measure the effect on HCV at 72 hours post infection (F). (B) Protein expression of HA-tagged DGAT2 mutants tested by Western blot analysis. HA-tagged DGAT2 constructs (~35–50 kDa) were detected by an anti-HA antibody, beta-tubulin (~55 kDa) was stained as loading control. The first and second lanes correspond to the control and untagged [DGAT2]-overexpressing cells, respectively. (C, D) Localization of HA-tagged DGAT2 detected by immunofluorescence. Cells were treated with 100 μM OA overnight prior to fixation. HA-DGAT2 mutants were identified with an anti-HA antibody (magenta). ER (Calnexin (C)) or LDs (LD540 (D)) were co-stained (green). Nuclei were stained with DAPI (blue). The white box area in overview images (upper panel) is enlarged in the second row for each channel. Intensity plot profiles were computed along the depicted dotted yellow line. Representative images of at least 3 independent experiments are shown. Note that the immunofluorescence images of the remaining DGAT2 localization mutants are depicted in S7 Fig. (E) Relative LD content in Lunet N hCD81 cells expressing the DGAT2 mutant panel. LDs were stained with BODIPY 493/503 and LD content was measured by flow cytometry utilizing spiked in [mRuby2] reference cells (see Figs 4A and 5B). Values were normalized to [empty] control cells (n = 3). (F) Effect of DGAT2 mutants on HCV replication. Lunet N hCD81 cells expressing HA-tagged DGAT2 constructs were infected with JcR2a 48 h post transduction. Cell lysates were harvested 72 h post infection and viral replication was measured by luciferase assay (n = 3). Results of statistical analysis are indicated by asterisks. (G) Identification of HA-DGAT2 and DGAT2 ER mut in cytoplasmic (annotated C above the blots) and microsomal fractions (annotated M) with and without OA treatment. HA-DGAT2 variants were detected by anti-HA antibody (~35–42 kDa). ADRP, Calreticulin and GAPDH were detected to control for the purity of the microsomal fractions.
Fig 7
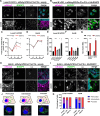
Fig 7. Increased DGAT2 overexpression relocalizes DAG stores.
A DAG sensor, consisting of the DAG-binding domain C1a-C1b of protein kinase C epsilon (PKCe-C1a-C1b) fused to the mRuby3 fluorophore [50], was co-transduced with [empty] (A) or [HA-DGAT2] (B) in Lunet N hCD81 cells. The DAG sensor is depicted in magenta. HA-tagged DGAT2 was detected with an anti-HA antibody. LDs were stained with BODIPY 493/503 (green) and nuclei with DAPI (blue). The white box area in overview images (upper panel) is enlarged in the second row for each channel. Representative images of 3 independent experiments are shown. (C-G) Lunet N hCD81 (C, E and G) or HuH6 cells (D, F and G) were transduced with lentiviruses to express [empty] or [DGAT2]. (C, D) 48 h post transduction, cells were transfected with JcR2a in vitro transcripts using lipofectamine. Viral replication was measured by luciferase assay 4, 24, 48 and 72 hours post transfection (hpt). Mean ±SEM values normalized to 4 hpt are depicted (n = 3). Significant changes after log-transformation are indicated by asterisks. (E, F) LD content 48 h after lentiviral transduction measured by flow cytometry. OA (36, 100 or 360 μM) was added to mock-transduced cells as positive control (n = 3). (G) Relative DGAT2 mRNA expression 48 h after lentiviral transduction. Values were normalized to [empty] control cells (n = 2–3). (H, I) DAG sensor localization in HuH6 cells co-transduced with [empty] (H) or [HA-DGAT2] (I). Fluorescence staining and imaging was performed as in (A, B). Note that in panel (I) one can readily distinguish DGAT2-transduced from non-transduced cells based on the HA staining and that the successfully transduced cells show strong LD accumulation and a different DAG pattern. (J, K) Different DAG sensor localization patterns were observed in Lunet N hCD81 or HuH6 cells upon expression of [empty] or [HA-DGAT2] or OA induction. We classified the observed patterns in perinuclear or punctate localization, as well as an intermediate phenotype. (K) The occurrence of the individual phenotypes was manually counted in images of three independent experiments.
Fig 8
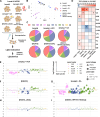
Fig 8. Global lipid profile changes upon HCV infection and DGAT2 expression.
(A) Lunet N hCD81 [empty] cells, either untreated, infected with HCV Jc1 for 48 h, or treated with oleic acid, as well as Lunet N hCD81 [DGAT2], [DGAT2_L83A] or [DGAT2_HPH161-163AAA] were harvested and lysed by Dounce homogenization. Lipids were extracted and concentrated from cytoplasmic extracts and lipidomics analysis was performed using the Lipidyzer platform. Analysis of n = 6 for each condition. (B) Relative proportions (pie-charts) of lipid classes in the whole lipidome of cytoplasmic extracts of the different tested cell lines. (C) Unsupervised principal component analysis (PCA) of the lipid spec of the different conditions. Lipid concentrations were normalized to the total lipid content prior PCA. Missing values were set to 0 and data was center-scaled prior PCA. (D) Heat map of fold changes at the lipid class level in infected, DGAT2-overexpressing or 360 μM OA-treated cells relative to [empty]. Significant changes are indicated by asterisks (p<0.05). TAG, triacylglycerol; CE, cholesterol ester, CER, ceramide; DAG, diacylglycerol; DCER, dihydroceramide; HCER, hydroxyceramide; LCER, lactosylceramide; LPC, lyso-phosphatidylcholine; LPE, lyso-phosphatidylethanolamine; PC, phosphatidylcholine; PE, phosphatidylethanolamine; SM, sphingomyelin. (E-I) Bubble plots of log2 fold changes at the lipid species level in Jc1-infected, OA-treated or DGAT2-overexpressing cells relative to control [empty] cells. Values were normalized to the total membrane lipid concentration of each sample. The point color represents individual lipid classes. The point size represents the corrected p-value (q-value).
Fig 9
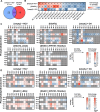
Fig 9. Changes of PC and PE lipid species on fatty acid subspecies level upon HCV infection and DGAT2 expression.
(A) Within 185 measured membrane lipid species, we identified 87 lipid species that were significantly (q-value < 0.1) up- or down-regulated upon HCV infection (52 lipid species, blue) or DGAT2 expression (19 lipid species, red) or both (16 lipid species, purple) in Lunet N hDC81 cells compared to the control cells. (B) Fold changes of significantly regulated membrane lipid species in Jc1-infected, DGAT2-overexpressing or OA-treated cells relative to control [empty] cells are depicted in a heatmap. Note that the heatmap shows the 16 common significantly regulated lipid species of HCV-infected and DGAT2-expressing cells. Significant changes (q-value < 0.1) are highlighted by asterisks. (C) PC and (D) PE lipid species profiles in Lunet N hCD81 cells upon HCV infection, DGAT2 overexpression or OA treatment. The samples and data are the same as in Fig 8, here analyzed for single lipids on fatty acid subspecies level. Fold changes in Jc1-infected or DGAT2-overexpressing cells relative to control [empty] cells are depicted in heatmaps. Significant changes (q-value < 0.1) are highlighted by asterisks.
Fig 10
Fig 10. Model proposing overlapping lipid requirements for HCV DMV synthesis and LD biogenesis upon increased DGAT2 expression.
Both HCV membranous web (left panel) and LD biogenesis (right panel) reshuffle the host cell lipid landscape to favor higher membrane curvature and flexibility and therefore accumulate conical and inverted-conical lipids as well as PUFAs and MUFAs, as described in the main text. Due to the excessive LD biogenesis and DGAT2 specific substrate preferences, we hypothesize that lipids crucial for the DMV synthesis are channeled towards LD expansion sites upon DGAT2 overexpression and their amount becomes limiting for the establishment of the HCV replication organelle. HCV replication factories are represented as blue protein complexes embedded in the ER / DMVs, the replicating genomes are depicted as red wavy lines and DGAT2 is shown as a red membrane-spanning protein. Conical and inverted conical lipids are shown in green and red triangles, respectively. MUFA and PUFA phospholipids are depicted in blue.

References

    1. Goto K, Roca Suarez AA, Wrensch F, Baumert TF, Lupberger J. Hepatitis C Virus and Hepatocellular Carcinoma: When the Host Loses Its Grip. International Journal of Molecular Sciences. 2020. Jan;21(9):3057. doi: 10.3390/ijms21093057 - DOI - PMC - PubMed
    1. Keikha M, Eslami M, Yousefi B, Ali-Hassanzadeh M, Kamali A, Yousefi M, et al.. HCV genotypes and their determinative role in hepatitis C treatment. VirusDisease. 2020. Sep;31(3):235. doi: 10.1007/s13337-020-00592-0 - DOI - PMC - PubMed
    1. Tabata K, Neufeldt CJ, Bartenschlager R. Hepatitis C Virus Replication. Cold Spring Harb Perspect Med. 2020. Jan 3;10(3):a037093. doi: 10.1101/cshperspect.a037093 - DOI - PMC - PubMed
    1. Moradpour D, Penin F. Hepatitis C virus proteins: from structure to function. Curr Top Microbiol Immunol. 2013;369:113–42. doi: 10.1007/978-3-642-27340-7_5 - DOI - PubMed
    1. Miller S, Krijnse-Locker J. Modification of intracellular membrane structures for virus replication. Nat Rev Microbiol. 2008. May;6(5):363–74. doi: 10.1038/nrmicro1890 - DOI - PMC - PubMed

MeSH terms

LinkOut - more resources