. 2024 Nov:381:114944.
doi: 10.1016/j.expneurol.2024.114944. Epub 2024 Sep 5.

A deep learning-based approach for unbiased kinematic analysis in CNS injury

Affiliations

A deep learning-based approach for unbiased kinematic analysis in CNS injury

Maureen C Ascona et al. Exp Neurol. 2024 Nov.

Abstract

Traumatic spinal cord injury (SCI) is a devastating condition that impacts over 300,000 individuals in the US alone. Depending on the severity of the injury, SCI can lead to varying degrees of sensorimotor deficits and paralysis. Despite advances in our understanding of the underlying pathological mechanisms of SCI and the identification of promising molecular targets for repair and functional restoration, few therapies have made it into clinical use. To improve the success rate of clinical translation, more robust, sensitive, and reproducible means of functional assessment are required. The gold standards for the evaluation of locomotion in rodents with SCI are the Basso Beattie Bresnahan (BBB) scale and Basso Mouse Scale (BMS). To overcome the shortcomings of current methods, we developed two separate markerless kinematic analysis paradigms in mice, MotorBox and MotoRater, based on deep-learning algorithms generated with the DeepLabCut open-source toolbox. The MotorBox system uses an originally designed, custom-made chamber, and the MotoRater system was implemented on a commercially available MotoRater device. We validated the MotorBox and MotoRater systems by comparing them with the traditional BMS test and extracted metrics of movement and gait that can provide an accurate and sensitive representation of mouse locomotor function post-injury, while eliminating investigator bias and variability. The integration of MotorBox and/or MotoRater assessments with BMS scoring will provide a much wider range of information on specific aspects of locomotion, ensuring the accuracy, rigor, and reproducibility of behavioral outcomes after SCI.

Keywords: DeepLabCut; Kinematics; Machine learning; Spinal cord injury; Traumatic brain injury.


Conflict of interest statement

Declaration of competing interest The authors declare no conflicts of interest. The funders had no role in the design of the study in the collection, analyses, or interpretation of data; in the writing of the manuscript, or in the decision to publish the results.

Figures
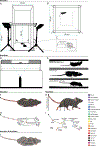
Figure 1.
Figure 1.. MB and MR equipment and virtual tracking.
(A) Schematic of the MB chamber, with camera placement and lighting setup. (B) Field of view from the bottom where DLC tracking occurs within the MB apparatus. (C) 3D printed ski boot mount for positioning of GoPro camera. (D) Schematic of the MR linear runway, with camera placement and recording filed. (E) The lateral and ventral views form the MR. (F) Virtual label placement for DLC tracking in the MB. (G) Skeleton schematic representing unique metrics assessed with the MB. (H) Virtual label placement for DLC tracking in the MR. (G) Skeleton schematic representing unique metrics assessed with the MR. (J) Metrics and virtual marks overlapping in MB and MR.
Figure 2.
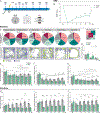
Figure 2.. Detection of SCI-induced changes in exploration patterns and ambulation metrics.
(A) Experimental timeline for behavioral testing of sham and SCI mice. (B) Evaluation of locomotor function over time with BMS. (C) Analysis of mouse exploratory behavior with the MB at baseline, 7 and 35 dpi in sham and SCI mice; top panels: time spent in each area of the apparatus; bottom panels: mouse tracking using tail base ad snout as virtual marks. (D) Time spent in the inner field (IF) of the MB at baseline (BL) at 7 and 35 dpi. (E-G) Speed metrics over time measured with the MB: (E) mouse speed (tail base used as reference mark), (F) right forepaw speed, and (G) right hindpaw speed. (H-J) Speed metrics over time measured with the MR: (H) mouse speed (tail base used as reference mark), (I) right forepaw speed, and (J) right hindpaw speed; n=10/group. *p≤0.05, **p≤0.01, ***p≤0.001 between sham and SCI. ^p≤0.05, ^^p≤0.01, ^^^p≤0.001 compared to BL, Repeated Measures Two-Way ANOVA.
Figure 3.
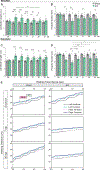
Figure 3.. Detection of SCI-induced changes in range of motion.
(A, B) Range of motion measured as distance from left hindpaw to tail base (A), and right hindpaw to tail base (B) with the MB. (C) Body extension measured from base of the neck and lower abdomen. (D, E) Range of motion measured as distance from left hindpaw to tail base (D), and right hindpaw to tail base (E) with the MR. (F-I) Joint angles measured with the MR: (F) right scapulocoracoid, (G) right wrist, (H) right iliac crest, and (I) right ankle angles; n=10/group. *p≤0.05, **p≤0.01, ***p≤0.001 between sham and SCI. ^p≤0.05, ^^p≤0.01, ^^^p≤0.001 compared to BL, Repeated Measures Two-Way ANOVA.
Figure 4.
Figure 4.. Detection of transient deficits due to acute SCI (4 dpi).
(A-C) Range of motion metrics with the MB: (A) Representative internal hindlimb angles measured from the two hindpaws to the tail base at BL and 4 dpi; (B) Quantification of internal hindlimb angles; (C) Body extension measured at BL and 4 dpi. (D-F) Range of motion metrics with the MR: (D) Right hindpaw range at BL and 4 dpi, (E) hindpaw spread, (F) and right elbow angle at BL and 4 dpi time points; n=10/group. *p≤0.05, **p≤0.01, ***p≤0.001 between sham and SCI. ^p≤0.05, ^^p≤0.01, ^^^p≤0.001 compared to BL, Repeated Measures Two-Way ANOVA.
Figure 5.
Figure 5.. Detection of SCI-induced changes in gait and coordination.
(A, C) Movement stride measured as distance from left hindpaw to left forepaw using both MB (A) and MR (C). (B, D) Hindlpaw spread measured as distance from left to right hindpaw using both MB (B), and MR (D). (E) Diagrams illustrating synchronous and asynchronous movement patterns of the four limbs and reciprocal positioning during a 0.6 second travel time in the MR apparatus; n=10/group. *p≤0.05, **p≤0.01, ***p≤0.001 between sham and SCI. ^p≤0.05, ^^p≤0.01, ^^^p≤0.001 compared to BL, Repeated Measures Two-Way ANOVA.
Figure 6.
Figure 6.. Detection of SCI-induced changes in limb swing dynamics.
(A) Swing counts of the left hindpaw assessed with the MR. (B) Swing amplitude (peak amplitude) of the steps taken by the left hindpaw in the MR. (C) Representative diagram illustrating the process of correcting for fisheye distortion and detecting peaks (swing amplitude) and troughs (time in stance) in sham and SC mice at 7 dpi. (D) Representative swing curve shapes at 7 and 14 dpi illustrating the prolonged hindpaw lift off the ground in SCI mice compared to sham. (E) Quantification of the average area under the swing curve (AUC) for both hindpaws in the MR. (F) Percent of time spent performing incomplete swings in the MR; n=10/group. *p≤0.05, **p≤0.01, ***p≤0.001 between sham and SCI. ^p≤0.05, ^^p≤0.01, ^^^p≤0.001 compared to BL, Repeated Measures Two-Way ANOVA.
Figure 7.
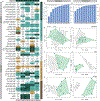
Figure 7.. Comparisons of MB and MR with BMS.
(A) Correlation matrix between BMS score and MB and MR metrics calculated with Pearson Correlation at each time point. (B, C) Summated loading scores from PCA analysis run on all time points across all MB (B) and MR (C) variables, where the dotted line represents 80% of the variance; Summated Variance accounted for (VAF) for the first 10 principal components of all MB and BMS (B) or MR and BMS (C) metrics across all time points for SCI mice where the dotted line represents 80% of the variance. (D-I) PCA scatter plots comparing shams against SCI mice at baseline, 7 dpi (F, G), and 35 dpi (H, I) for MB (D, F, H) and MR (E, G, I) based on VAF scores. The x-axis shows the first PC, and the y-axis shows the second PC, with the percentage of variance explained by each component indicated; n=10/group.

Update of

References

    1. Adams MM, and Hicks AL. 2005. Spasticity after spinal cord injury. Spinal Cord 43:577–586. - PubMed
    1. Ahuja CS, Wilson JR, Nori S, Kotter MRN, Druschel C, Curt A, and Fehlings MG. 2017. Traumatic spinal cord injury. Nat Rev Dis Primers 3:17018. - PubMed
    1. Aljovic A, Zhao S, Chahin M, de la Rosa C, Van Steenbergen V, Kerschensteiner M, and Bareyre FM. 2022. A deep learning-based toolbox for Automated Limb Motion Analysis (ALMA) in murine models of neurological disorders. Commun Biol 5:131. - PMC - PubMed
    1. All AH, and Al-Nashash H. 2021. Comparative analysis of functional assessment for contusion and transection models of spinal cord injury. Spinal Cord 59:1206–1209. - PubMed
    1. All AH, Al Nashash H, Mir H, Luo S, and Liu X. 2020. Characterization of transection spinal cord injuries by monitoring somatosensory evoked potentials and motor behavior. Brain Res Bull 156:150–163. - PubMed

LinkOut - more resources