. 2024 Sep 6;12(1):53.
doi: 10.1038/s41413-024-00355-3.

Osteopontin deficiency promotes cartilaginous endplate degeneration by enhancing the NF-κB signaling to recruit macrophages and activate the NLRP3 inflammasome

Affiliations

Osteopontin deficiency promotes cartilaginous endplate degeneration by enhancing the NF-κB signaling to recruit macrophages and activate the NLRP3 inflammasome

Yanqiu Wang et al. Bone Res. .

Abstract

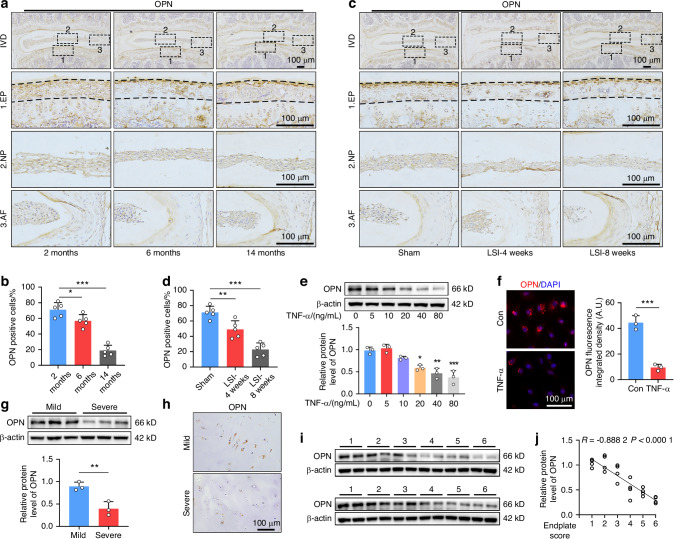
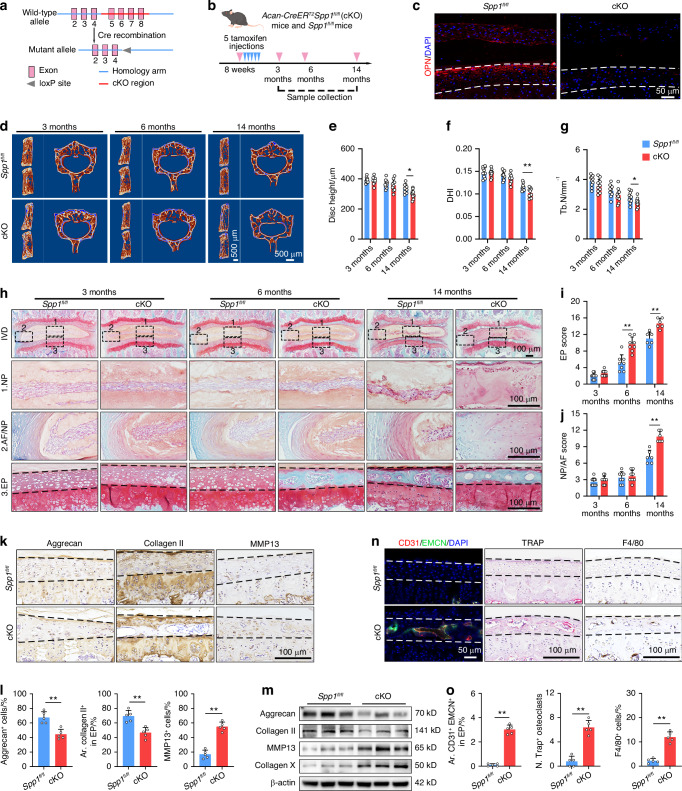
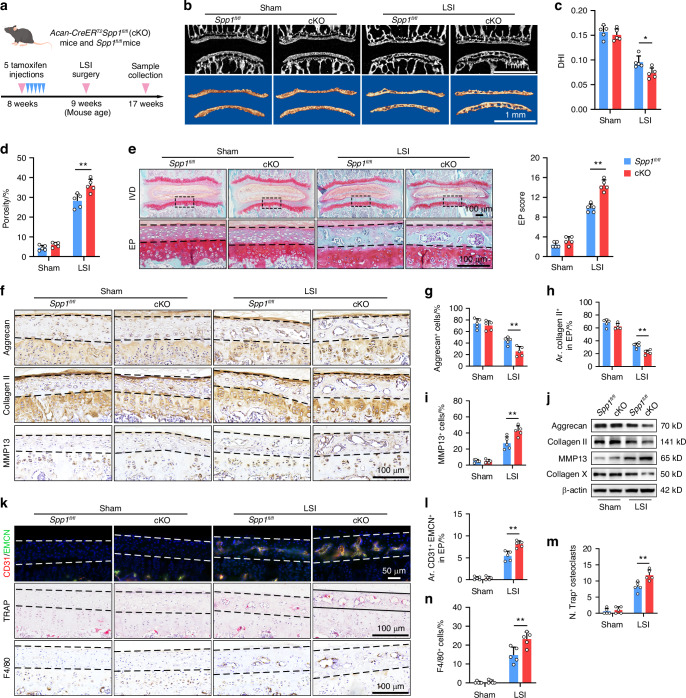
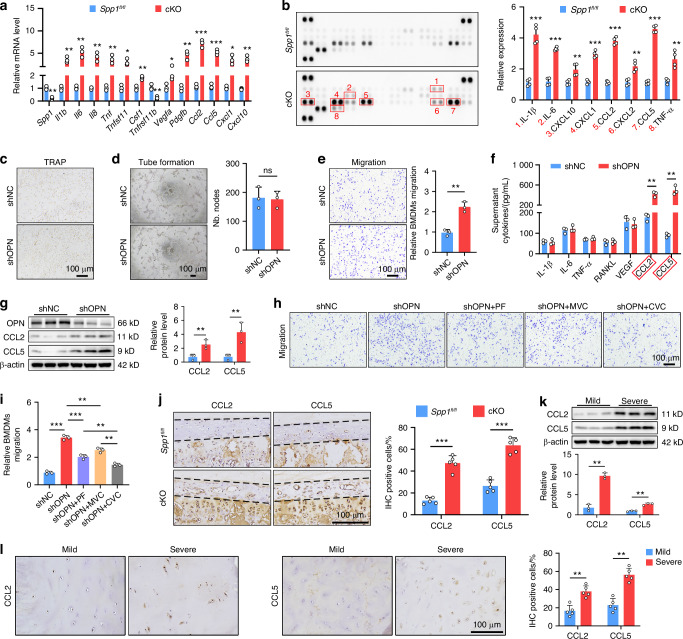
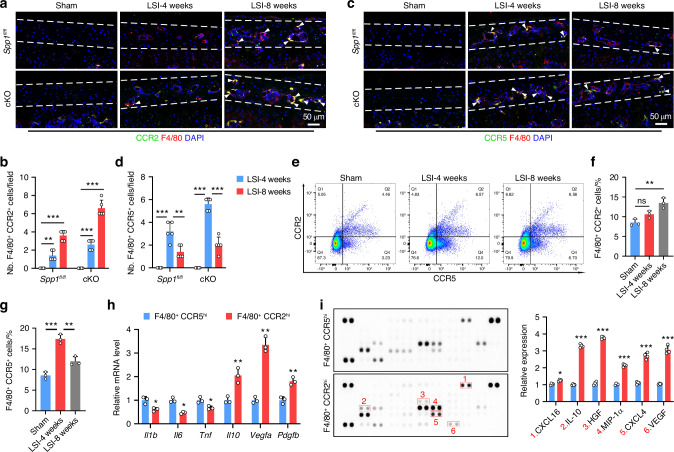
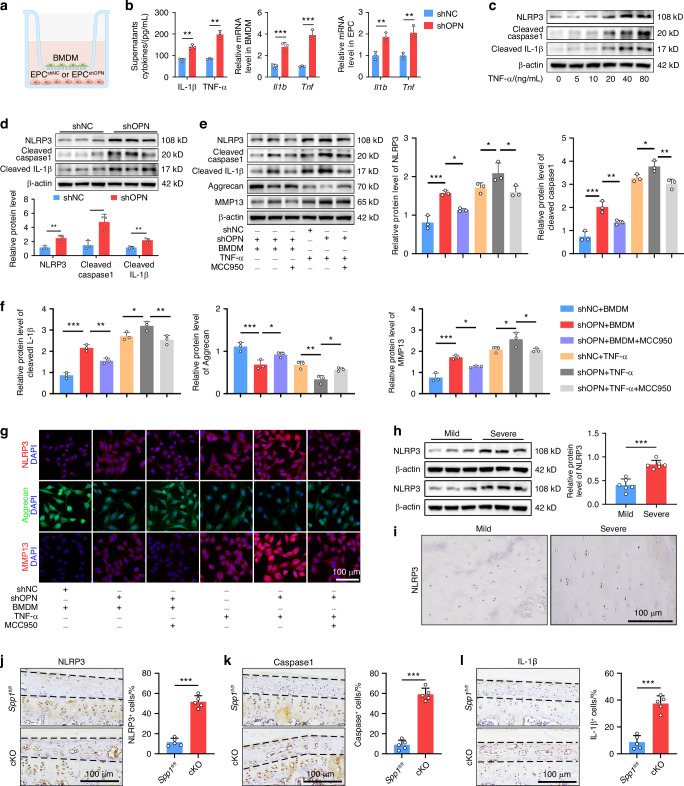
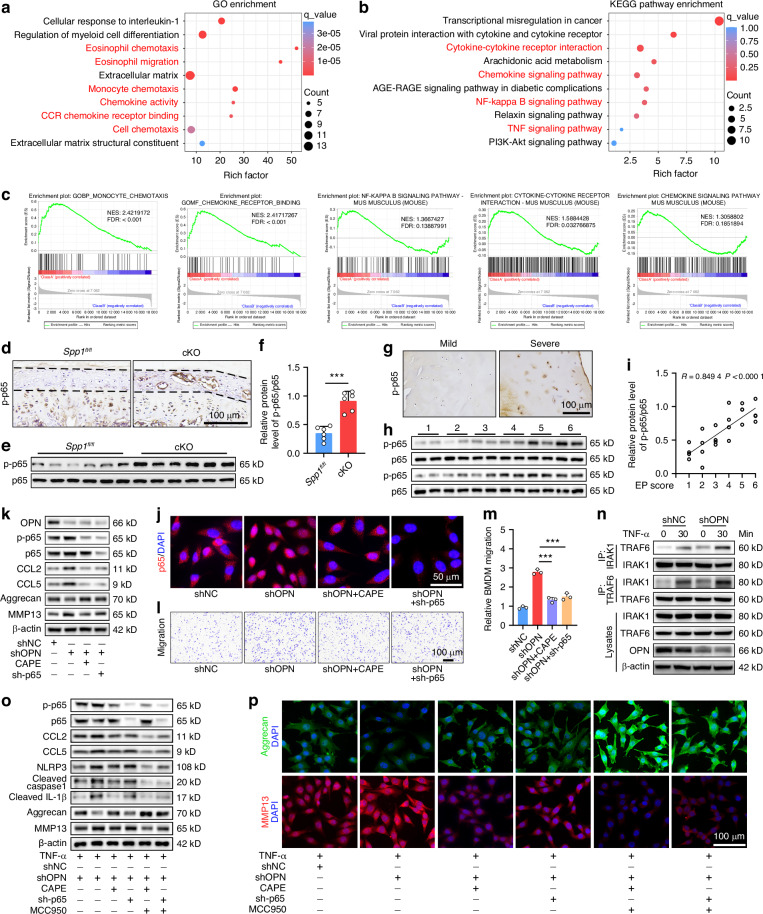
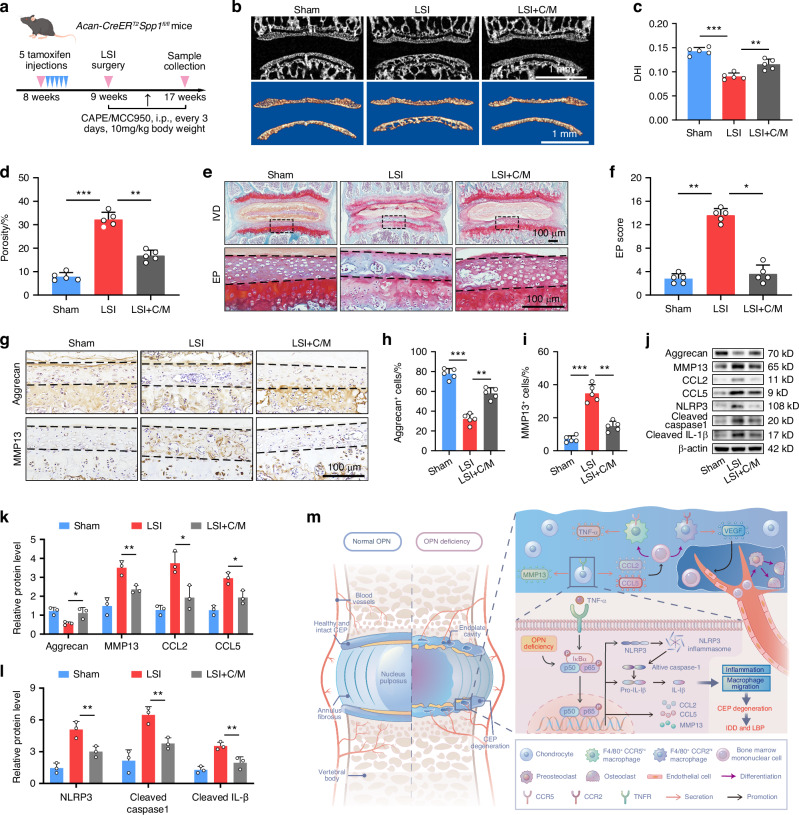
Intervertebral disc degeneration (IDD) is a major cause of discogenic pain, and is attributed to the dysfunction of nucleus pulposus, annulus fibrosus, and cartilaginous endplate (CEP). Osteopontin (OPN), a glycoprotein, is highly expressed in the CEP. However, little is known on how OPN regulates CEP homeostasis and degeneration, contributing to the pathogenesis of IDD. Here, we investigate the roles of OPN in CEP degeneration in a mouse IDD model induced by lumbar spine instability and its impact on the degeneration of endplate chondrocytes (EPCs) under pathological conditions. OPN is mainly expressed in the CEP and decreases with degeneration in mice and human patients with severe IDD. Conditional Spp1 knockout in EPCs of adult mice enhances age-related CEP degeneration and accelerates CEP remodeling during IDD. Mechanistically, OPN deficiency increases CCL2 and CCL5 production in EPCs to recruit macrophages and enhances the activation of NLRP3 inflammasome and NF-κB signaling by facilitating assembly of IRAK1-TRAF6 complex, deteriorating CEP degeneration in a spatiotemporal pattern. More importantly, pharmacological inhibition of the NF-κB/NLRP3 axis attenuates CEP degeneration in OPN-deficient IDD mice. Overall, this study highlights the importance of OPN in maintaining CEP and disc homeostasis, and proposes a promising therapeutic strategy for IDD by targeting the NF-κB/NLRP3 axis.


Conflict of interest statement

The authors declare no competing interests.

Figures

Fig. 1
Fig. 1
OPN expression is dramatically decreased in the CEP during degeneration. a, b IHC staining and quantification of OPN expression in the IVD tissues from 2, 6, and 14-month-old mice (n = 5). c, d IHC staining and quantification of OPN expression in the IVD tissues from the mice at 4- and 8-weeks post LSI surgery or the sham group (n = 5). e WB analysis of OPN expression in EPCs that had been treated with the indicated doses of TNF-α (n = 3). f IF staining and quantification of OPN expression in EPCs treated with, or without, TNF-α (80 ng/mL) (n = 3). g WB analysis of OPN expression in CEP tissues from patients with mild or severe degeneration (n = 3). h IHC staining of OPN expression in CEP tissues from patients with mild or severe degeneration. i, j WB analysis of OPN expression in human CEP tissues and their correlation with the severity of degeneration (n = 24). *P < 0.05, **P < 0.01, ***P < 0.001
Fig. 2
Fig. 2
OPN deficiency deteriorates the age-related CEP degeneration. a A diagram illustrates the construction strategy for generating Spp1 cKO mice. b A schematic graph of the experimental design. c IF staining of OPN expression in the IVD tissues from 3-month-old Spp1fl/fl and cKO mice. d μCT reconstruction images of the hemi-section of a lumbar motion segment and the cross-section of a lumbar vertebral body from 3, 6, and 14-month-old Spp1fl/fl and cKO mice. Quantification of μCT analyses for the disc height (e), disc height index (DHI; f), and trabecular number (Tb. N; g) of the mouse lumbar vertebrae from 3, 6, and 14-month-old Spp1fl/fl and cKO mice (n = 10). SO-FG staining (h) and histological scores of lumbar EP (i) and NP/AF (j) in 3 (n = 10), 6 (n = 8), and 14-month-old (n = 6) Spp1fl/fl and cKO mice. k, l IHC staining and quantification of Aggrecan, Collagen II, and MMP13 expression in CEP tissues from 6-month-old Spp1fl/fl and cKO mice (n = 5). m WB analysis of Aggrecan, Collagen II, MMP13, and Collagen X expression in CEP tissues from 6-month-old Spp1fl/fl and cKO mice (n = 3). n IF staining of CD31+ (red) EMCN+ (green) blood vessels (left), TRAP (magenta) staining (middle), and IHC staining of F4/80+ cells (right) in CEP tissues from 6-month-old Spp1fl/fl and cKO mice. o Quantification of CD31+EMCN+ blood vessels (left), TRAP+ cells (middle), and F4/80+ cells (right) in CEP tissues from 6-month-old Spp1fl/fl and cKO mice (n = 5). *P < 0.05, **P < 0.01
Fig. 3
Fig. 3
OPN deficiency accelerates CEP remodeling in mice following LSI. a A schematic graph of the experimental design. b μCT (top) and reconstruction (bottom) images of the coronal plane of lumbar endplates in Spp1fl/fl and cKO mice with a sham or LSI surgery. Quantification of μCT analyses for DHI (c) and the porosity (d) of mouse lumbar endplates in Spp1fl/fl and cKO mice with sham or LSI surgery (n = 5). e SO-FG staining and histological scores of lumbar EP in Spp1fl/fl and cKO mice with a sham or LSI surgery (n = 5). fi IHC staining and quantification of Aggrecan, Collagen II, and MMP13 expression in CEP tissues from Spp1fl/fl and cKO mice with a sham or LSI surgery (n = 5). j WB analysis of Aggrecan, Collagen II, MMP13, and Collagen X expression in CEP tissues from Spp1fl/fl and cKO mice with a sham or LSI surgery. k IF staining of CD31+ (red) EMCN+ (green) blood vessels (top), TRAP (magenta) staining (middle), and IHC staining of F4/80 (bottom) in CEP tissues from Spp1fl/fl and cKO mice with a sham or LSI surgery. Quantification of CD31+EMCN+ blood vessels (l), TRAP+ cells (m), and F4/80+ cells (n) in CEP tissues from Spp1fl/fl and cKO mice with a sham or LSI surgery (n = 5). *P < 0.05, **P < 0.01
Fig. 4
Fig. 4
OPN-deficient EPCs enhances CCL2 and CCL5 expression to recruit macrophages. a RT-qPCR analysis of the relative levels of Spp1, Il1b, Il6, Il8, Tnf, Tnfsf11, Csf1, Tnfsf11b, Vegfa, Pdgfb, Ccl2, Ccl5, Cxcl1, and Cxcl10 mRNA transcripts in CEP tissues from 6-month-old Spp1fl/fl and cKO mice (n = 3). b Quantification of a cytokine array in CEP tissues from 6-month-old Spp1fl/fl and cKO mice (n = 4). c TRAP staining of bone marrow-derived macrophages (BMDMs) that had been treated with conditioned medium from the shNC or shOPN EPCs. d Tube formation assay in HUVECs that had been treated with conditioned medium from shOPN or shNC EPCs (n = 3). e Migration assay in BMDMs that had been treated with conditioned medium from the shOPN or shNC EPCs (n = 3). f ELISA quantification of IL-1β, IL-6, TNF-α, RANKL, VEGF, CCL2, and CCL5 levels in conditioned medium from the shOPN or shNC EPCs (n = 3). g WB analyses of OPN, CCL2, and CCL5 expression in the shOPN or shNC EPCs (n = 3). h, i BMDM migration assay using conditioned medium from the shOPN or shNC EPCs in the presence or absence of PF-4136309 (PF), maraviroc (MVC), or cenicriviroc (CVC) (n = 3). j IHC staining and quantification of CCL2 and CCL5 expression in CEP tissues from 6-month-old Spp1fl/fl and cKO mice (n = 5). k WB analyses of CCL2 and CCL5 expression in CEP tissues from patients with mild or severe degeneration (n = 3). l IHC staining and quantification of CCL2 and CCL5 expression in CEP tissues from patients with mild or severe degeneration (n = 5). *P < 0.05, **P < 0.01, ***P < 0.001, ns: not significant
Fig. 5
Fig. 5
Macrophages perform distinct functions in a spatiotemporal pattern during the process of CEP remodeling. a, b Co-immunostaining images and quantification of F4/80+ (red) CCR2+ (green) macrophages in CEP tissues from the Spp1fl/fl and cKO mice at 4 and 8 weeks post sham or LSI surgery (n = 5). c, d Co-immunostaining images and quantification of F4/80+ (red) CCR5+ (green) macrophages in CEP tissues from the Spp1fl/fl and cKO mice at 4 and 8 weeks post sham or LSI surgery (n = 5). Cell sorting (e) and quantification of F4/80+CCR2+ (f) and F4/80+CCR5+ (g) macrophages in CEP tissues from cKO mice at 4 and 8 weeks post sham or LSI surgery (n = 3). h Relative levels of Il1b, Il6, Tnf, Il10, Vegfa, and Pdgfb mRNA transcripts in F4/80+CCR2hi and F4/80+CCR5hi macrophages (n = 3). i Quantification of an angiogenesis array in cell lysates from F4/80+CCR2hi and F4/80+CCR5hi macrophages (n = 4). *P < 0.05, **P < 0.01, ***P < 0.001, ns: not significant
Fig. 6
Fig. 6
Macrophages activate the NLRP3 inflammasome in OPN-deficient EPCs. a A schematic graph of the co-culture system in which BMDMs were co-cultured with shOPN or shNC EPCs. b ELISA quantification of the levels of IL-1β and TNF-α in the supernatants of co-cultured cells (left); the relative levels of Il1b and Tnf mRNA transcripts in BMDMs (middle) and EPCs (right) in the coculture system (n = 3). c WB analyses of NLRP3, cleaved Caspase1, and cleaved IL-1β expression in EPCs in the absence or presence of different doses of TNF-α. d WB analyses of NLRP3, cleaved Caspase1, and cleaved IL-1β expression in shOPN or shNC EPCs after cocultured with BMDMs (n = 3). e, f WB analyses of NLRP3, cleaved Caspase1, cleaved IL-1β, Aggrecan, and MMP13 expression in shOPN or shNC EPCs that had been pretreated with or without MCC950 and then cocultured with BMDMs or treated with TNF-α (n = 3). g Representative IF staining of NLRP3, Aggrecan, and MMP13 in shOPN or shNC EPCs that had been pretreated with or without MCC950 and then cocultured with BMDMs or treated with TNF-α. h, i WB and IHC analyses of NLRP3 expression in CEP tissues from patients with mild or severe degeneration (n = 6). jl IHC staining and quantification of NLRP3, Caspase1, and IL-1β expression in CEP tissues from 6-month-old Spp1fl/fl and cKO mice (n = 5). *P < 0.05, **P < 0.01, ***P < 0.001
Fig. 7
Fig. 7
OPN deficiency promotes macrophage migration and NLRP3 activation in the CEP by enhancing the NF-κB signaling. The GO (a) and KEGG (b) enrichment analysis of the differentially expressed genes (DEGs) in CEP tissues from 6-month-old Spp1fl/fl and cKO mice. c The gene set enrichment analysis of the DEGs. d IHC staining of phosphorylated p65 (p-p65) in CEP tissues from 6-month-old Spp1fl/fl and cKO mice. e, f WB analysis of p-p65 levels in CEP tissues from 6-month-old Spp1fl/fl and cKO mice (n = 5). g IHC staining of p-p65 in CEP tissues from patients with mild or severe degeneration. h, i WB analysis of p-p65 levels in human CEP tissues and their correlation with the severity of degeneration (n = 24). jk IF staining and WB analyses of p65 in shOPN or shNC EPCs that had been pretreated with, or without, CAPE and transduced with, or without, lentivirus for p65-specific shRNA (sh-p65). l, m BMDM migration toward the conditioned medium from shNC or shOPN EPCs that had been transduced with, or without, lentivirus for the expression of sh-p65 and then pretreated with, or without, CAPE (n = 3). n Co-IP analysis of the effect of OPN deficiency on IRAK1-TRAF6 interaction in EPCs. o WB analyses of p-p65, p65, CCL2, CCL5, NLRP3, cleaved Caspase1, cleaved IL-1β, Aggrecan, and MMP13 expression in shOPN or shNC EPCs that had been transduced with, or without, lentivirus for the expression of sh-p65, pretreated with, or without, CAPE and MCC950, and then treated with TNF-α. p IF staining of Aggrecan and MMP13 in shOPN or shNC EPCs that had been transduced with, or without, lentivirus for the expression of sh-p65, pretreated with, or without, CAPE and MCC950, and then treated with TNF-α. ***P < 0.001
Fig. 8
Fig. 8
Pharmacological inhibition on the NF-κB/NLRP3 axis attenuates CEP degeneration in cKO mice following LSI. a A schematic graph illustrates the experimental design. The cKO mice at 8 weeks of age were treated with tamoxifen for 5 consecutive days to induce Spp1 knockout and at 9 weeks of age, the mice were randomized and subjected to a sham or LSI surgery. Subsequently, the LSI cKO mice were treated intraperitoneally with vehicle or MCC950 and CAPE (C/M) every three days for 8 weeks. b μCT (top) and reconstruction (bottom) images of the coronal plane of lumbar endplates in cKO mice. Quantification of μCT analyses for DHI (c) and the porosity (d) of mouse lumbar endplates in cKO mice (n = 5). SO-FG staining (e) and histological scores (f) of lumbar EP in cKO mice (n = 5). gi IHC staining and quantification of Aggrecan and MMP13 expression in CEP tissues from cKO mice (n = 5). jl WB analyses of Aggrecan, MMP13, CCL2, CCL5, NLRP3, cleaved Caspase1, and cleaved IL-1β expression in CEP tissues from cKO mice (n = 3). m A schematic illustration of the mechanism by which OPN deficiency influences CEP homeostasis by enhancing the NF-κB signaling during the process of IDD. *P < 0.05, **P < 0.01, ***P < 0.001

Similar articles

Cited by

References

    1. Cieza, A. et al. Global estimates of the need for rehabilitation based on the Global Burden of Disease study 2019: a systematic analysis for the Global Burden of Disease Study 2019. Lancet396, 2006–2017 (2021). 10.1016/S0140-6736(20)32340-0 - DOI - PMC - PubMed
    1. Hartvigsen, J. et al. What low back pain is and why we need to pay attention. Lancet391, 2356–2367 (2018). 10.1016/S0140-6736(18)30480-X - DOI - PubMed
    1. Risbud, M. V. & Shapiro, I. M. Role of cytokines in intervertebral disc degeneration: pain and disc content. Nat. Rev. Rheumatol.10, 44–56 (2014). 10.1038/nrrheum.2013.160 - DOI - PMC - PubMed
    1. Livshits, G. et al. Lumbar disc degeneration and genetic factors are the main risk factors for low back pain in women: the UK Twin Spine Study. Ann. Rheum. Dis.70, 1740–1745 (2011). 10.1136/ard.2010.137836 - DOI - PMC - PubMed
    1. Francisco, V. et al. A new immunometabolic perspective of intervertebral disc degeneration. Nat. Rev. Rheumatol.18, 47–60 (2022). 10.1038/s41584-021-00713-z - DOI - PubMed

MeSH terms

LinkOut - more resources