. 2024 Sep 6;15(1):7788.
doi: 10.1038/s41467-024-51857-x.

Destabilized near-infrared fluorescent nanobodies enable background-free targeting of GFP-based biosensors for imaging and manipulation

Affiliations

Destabilized near-infrared fluorescent nanobodies enable background-free targeting of GFP-based biosensors for imaging and manipulation

Natalia V Barykina et al. Nat Commun. .

Abstract

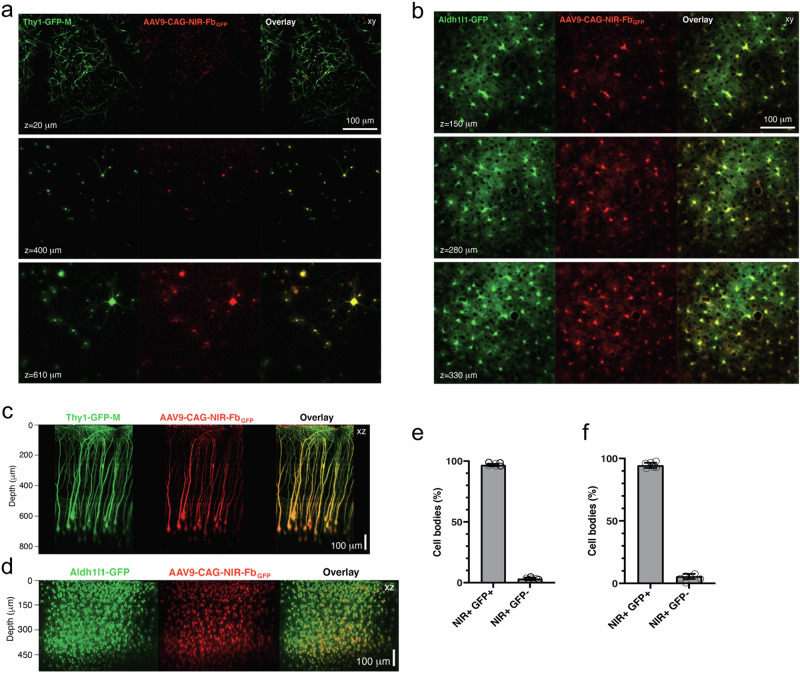
Near-infrared (NIR) probes are highly sought after as fluorescent tags for multicolor cellular and in vivo imaging. Here we develop small NIR fluorescent nanobodies, termed NIR-FbLAG16 and NIR-FbLAG30, enabling background-free visualization of various GFP-derived probes and biosensors. We also design a red-shifted variant, NIR-Fb(718), to simultaneously target several antigens within the NIR spectral range. Leveraging the antigen-stabilizing property of the developed NIR-Fbs, we then create two modular systems for precise control of gene expression in GFP-labeled cells. Applying the NIR-Fbs in vivo, we target cells expressing GFP and the calcium biosensor GCaMP6 in the somatosensory cortex of transgenic mice. Simultaneously tracking calcium activity and the reference signal from NIR-FbLAGs bound to GCaMP6 enables ratiometric deep-brain in vivo imaging. Altogether, NIR-FbLAGs present a promising approach for imaging and manipulating various processes in live cells and behaving animals expressing GFP-based probes.


Conflict of interest statement

The authors declare no competing interests.

Figures

Fig. 1
Fig. 1. Design and screening of nanobodies internally fused with miRFP670nano3 (NIR-Fbs).
a Crystal structure of a Nb (PDB ID: 3OGO) with internally fused miRFP670nano3 (PDB ID: 7LSC) (NIR-Fb) bound to GFP-based biosensor GCaMP6m (PDB ID: 3WLD). Complementarity-determining regions (CDRs) are highlighted in violet. The position of miRFP670nano3 insertion to the anti-GFP Nb is indicated with a red arrow. b Crystal structure of GBP1 (PDB ID: 3OGO) Nbs to GFP. c Fluorescence intensity of cells transfected with eight different NIR-Fbs to GFP co-expressed with mEGFP (+) or mTagBFP2 (−). d Crystal structures of LAG16 (PDB ID: 6LR7) and LAG30 (PDB ID: 7SAI) Nbs to GFP. In a, b and d black arrows indicate chromophore. Red arrows indicate the position where miRFP670nano3 was inserted. e Far-red fluorescence intensity of cells transfected with NIR-FbLAG16, NIR-FbLAG30 or NIR-FbGFP and coexpressed with GCaMP6s biosensor in its apo or saturated states or with GCaMP6s with truncated M13 peptide. f Green fluorescence intensity of cells transfected with NIR-FbLAG16, NIR-FbLAG30 or NIR-FbGFP and co-expressed with GCaMP6s in its apo or saturated states or with GCaMP6s with truncated M13 peptide. In c, e and f fluorescence intensity was analyzed by flow cytometry using a 640 nm excitation laser and a 660/20 nm emission filter for NIR-Fbs, a 488 nm excitation laser and a 525/50 nm emission filter for mEGFP, a 405 nm excitation laser and a 450/50 nm emission filter for mTagBFP2. c, e, f Data are presented as mean values  ±  s.d. for n = 3 transfection experiments. Source data are provided as a Source Data file.
Fig. 2
Fig. 2. Performance of NIR-FbLAGs nanobodies co-expressed with GCaMP6s in HeLa cells.
a Fluorescence images of HeLa cells coexpressing NIR-FbLAG16 or NIR-FbLAG30 anti-GFP Nb together with mTagBFP2 (negative control), mEGFP (positive control), and GCaMP6s. b Left, contrast of GCaMP6s only (n = 14) and GCaMP6s coexpressed with either NIR-FbLAG16 (n = 11) or NIR-FbLAG30 (n = 11) after the addition of 5 μM ionomycin. Right, the contrast of NIR-FbLAG16 and NIR-FbLAG30 for the data presented in the left graph. Data are presented as mean values  ±  s.e.m. for n  =  3 transfection experiments. c Change in fluorescence intensity of the cells co-expressing GCaMP6s (green) and NIR-FbLAG16 (red) in response to 5 μM ionomycin. d Change in fluorescence intensity of the cells co-expressing GCaMP6s (green) and NIR-FbLAG30 (red) in response to 5 μM ionomycin. In c and d, data are shown for 3 cells, and the arrow indicates the time point when 5 μM ionomycin was added. For imaging of mTagBFP2, mEGFP or GCaMP6s and NIR-FbLAGs, 390/40 nm excitation and 460/40 nm emission, 480/40 nm excitation and 530/40 nm emission, and 605/40 nm excitation and 640LP nm emission filters were used, respectively. Scale bar, 40 μm. Source data are provided as a Source Data file.
Fig. 3
Fig. 3. Performance of NIR-FbLAGs co-expressed with GFP-based pyruvate and glucose biosensors.
a Fluorescence images of HeLa cells co-expressing NIR-FbLAG16 anti-GFP Nb together with mTagBFP2 (negative control), mEGFP (positive control), pyruvate sensors Green Pegassos and PyronicSF and glucose sensor iGlucoSnFR. b Fluorescence images of HeLa cells co-expressing NIR-FbLAG30 anti-GFP Nb together with mTagBFP2 (negative control), mEGFP (positive control), pyruvate sensors Green Pegassos and PyronicSF and glucose sensor iGlucoSnFR. c Left, contrast of Green Pegassos only (n = 10) and Green Pegassos coexpressed with either NIR-FbLAG16 (n = 12) or NIR-FbLAG30 (n = 14) after the addition of 1 mM pyruvate. Right, the contrast of NIR-FbLAG16 and NIR-FbLAG30 for the data presented in the left graph. d Left, contrast of PyronicSF only (n = 12) and PyronicSF co-expressed with either NIR-FbLAG16 (n = 13) or NIR-FbLAG30 (n = 12) after addition of 10 mM pyruvate. Right, the contrast of NIR-FbLAG16 and NIR-FbLAG30 for the data presented in the left graph. e Left, contrast of iGlucoSnFR only (n = 16) and iGlucoSnFR co-expressed with either NIR-FbLAG16 (n = 14) or NIR-FbLAG30 (n = 14) after addition of 50 mM glucose. Right, the contrast of NIR-FbLAG16 and NIR-FbLAG30 for the data presented in the left graph. For imaging of mTagBFP2, mEGFP or Green Pegassos, PyronicSF and iGlucoSnFR, and NIR-FbLAGs, 390/40 nm excitation and 460/40 nm emission, 480/40 nm excitation and 530/40 nm emission, and 605/40 nm excitation and 640LP nm emission filters were used, respectively. Scale bar, 40 μm. ce Data are presented as mean values  ±  s.e.m. for n = 3 transfection experiments. Source data are provided as a Source Data file.
Fig. 4
Fig. 4. Multicolor imaging of two different NIR-Fbs.
a Design of NIR Nb for GFP (NbGFP) (PDB ID 3OGO) with indicated position for insertion of miRFP718nano (PDB ID 7LSD). CDRs of NbGFP are highlighted with violet and the position of miRFP718nano insertion is indicated in red. b Co-expression of NIR NbGFP containing inserted miRFP718nano (NIR-Fb(718)) with cognate mEGFP antigen in the cytoplasm (upper panels) or in the nucleus (bottom panels) of HeLa cells. c Upper panels, fluorescent images of HeLa cells co-expressing near-infrared Nb for p24 HIV protein with inserted miRFP670nano3 fluorescent protein (NIR-Fb59H10) and cognate antigen, NES-p24-mTagBFP2. Middle panels, fluorescent images of HeLa cells co-expressing NIR Nb for GFP with inserted miRFPnano718 (NIR-Fb(718)) and EGFP-H2B. Bottom panels, fluorescent images of HeLa cells co-expressing NIR-Fb59H10 and NIR-Fb(718) and two respective antigens, NES-p24-mTagBFP2 and EGFP-H2B. Patterns of co-expression are indicated with yellow and white arrows, respectively. For imaging of mTagBFP2 and mEGFP, 390/40 nm excitation and 460/40 nm emission and 480/40 nm excitation and 530/40 nm emission filters we used, respectively. For imaging of NIR-Fb59H10 and NIR-Fb(718), 605/40 excitation and 667/30 emission, and 682/12 excitation and 721/42 emission filters were used, respectively. Scale bar, 40 μm. For more details, see “Statistics and reproducibility” section of the Methods.
Fig. 5
Fig. 5. Multicolor imaging of two NIR-Fbs for GFP.
Fluorescence images of HeLa cells co-expressing EBFP2-nuc with either (a) NIR-Fb for GFP with inserted miRFP718nano fluorescent protein (NIR-Fb(718)) or (b) with NIR-Fb for GFP with inserted miRFP670nano3 (NIR-FbLAG30). Fluorescence images of HeLa cells co-expressing pH-tdGFP with either (c) NIR-Fb(718) or (d) with NIR-FbLAG30. e Fluorescence images of cells co-expressing EBFP2-nuc, pH-tdGFP, NIR-FbLAG30, and NIR-Fb(718). Yellow arrows indicate patterns of co-expression for EBFP2-nuc with NIR-FbLAG30 and NIR-Fb(718) in the nucleus, white arrows indicate patterns of co-expression for pH-tdGFP with NIR-FbLAG30 in the cytosol. For imaging of EBFP2 and pH-tdGFP, 390/40 nm excitation and 460/40 nm emission and 480/40 nm excitation and 530/40 nm emission filters we used, respectively. For imaging of NIR-FbLAG30 and NIR-Fb(718), 605/40 excitation and 667/30 emission and 682/12 excitation and 721/42 emission filters were used, respectively. Scale bar, 40 μm. For more details, see “Statistics and reproducibility” section of the Methods.
Fig. 6
Fig. 6. NIR-FbGFP-based systems for transcription activation.
a Scheme of NIR-Fb(718)-based system for activation of mTagBFP2 reporter transcription. Two fragments of split-sfGFP are fused to GAL4 DNA-binding domains, while NIR-Fb for GFP with inserted miRFP718nano (NIR-Fb(718)) is fused to VP16 transcriptional activation domain. In the presence of the fusions of GAL4 to the split sfGFP fragments and a VP16-NIR-Fb(718) fusion, sfGFP reconstitutes and can bind NIR-Fb(718). In turn, transcriptional activation domain VP16 forms a complex with GAL4 DNA-binding domain which binds to the UAS regulatory sequence and activates transcription of the mTagBFP2 reporter gene. b Scheme of NIR-FbLAG30- and NIR-Fb(718)-based system for activation of mTagBFP2 reporter transcription. Here GAL4 DNA-binding domain is fused to the NIR-FbLAG30. In the presence of mEGFP, both GAL4-NIR-FbLAG30 and VP16-NIR-Fb(718) bind different epitopes of mEGFP molecule and activate mTagBFP2 reporter transcription. c Fluorescence intensity of mTagBFP2 in HeLa cells transfected with a plasmid from the scheme (a). As a control, GAL4-VP16 plasmid with pG12-mTagBFP2 reporter plasmid or pG12-mTagBFP2 reporter plasmid only were used. d Fluorescence intensity of mTagBFP2 in HeLa cells transfected with plasmids from the scheme (b). Controls are the same as in c. Fluorescence intensity was analyzed by flow cytometry using a 640 nm excitation laser and a 660/20 nm emission filter for NIR-Fbs, a 488 nm excitation laser and a 525/50 nm emission filter for mEGFP, a 405 nm excitation laser and a 450/50 nm emission filter for mTagBFP2. Data are presented as mean values  ±  s.d. for n = 3 transfection experiments. Source data are provided as a Source Data file.
Fig. 7
Fig. 7. Targeting GFP-expressing neurons and astrocytes in the brain of live mice with NIR-FbGFP.
a Left, example images from a xy fluorescence image stack showing GFP-expressing neurons and their processes (green) in the somatosensory cortex of an anesthetized 9.5-weeks-old Thy1-GFP-M mouse at the indicated depths (z) from the pial surface. Center, the same neurons show miRFP670nano3 expression three weeks after stereotactic AAV9-CAG-NIR-FbGFP vector delivery. Right, overlay of the simultaneously acquired two-photon images. Scale bar, 100 μm. b Left, example images from a xy fluorescence image stack showing GFP-expressing astrocytes and their processes (green) in the somatosensory cortex of an anesthetized 16-weeks-old Aldh1l1-GFP mouse at the indicated depths (z) from the pial surface. Center, the same astrocytes show miRFP670nano3 expression 4.5 weeks after stereotactic AAV9-CAG-NIR-FbGFP vector delivery. Right, overlay of the simultaneously acquired two-photon images. Scale bar, 100 μm. c Example maximum-intensity side projection (xz) from the image stack in panel a showing the GFP (left) and miRFP670nano3 (center) expression pattern across depth. An overlay image is shown on the right. Scale bar, 100 μm. d Example maximum-intensity side projection (xz) from the image stack in panel b showing the GFP (left) and miRFP670nano3 (center) expression pattern across depth. An overlay image is shown on the right. Scale bar, 100 μm. e Population analysis showing the percent overlap between miRFP670nano3 and GFP-positive cell bodies (NIR + GFP+: 96.8% ± 1.1%; NIR + GFP−: 3.2% ± 1.1%; n = 6 tissue sections from two mice). f Population analysis showing the percent overlap between miRFP670nano3 and GFP-positive cell bodies (NIR + GFP+: 94.4% ± 2.6%; NIR + GFP−: 5.6% ± 2.6%; n = 6 tissue sections from two mice). The entire xy fluorescence image stacks and xz side projections are shown in Supplementary Movies 1–4. e, f Data are presented as mean values  ±  s.d. Source data are provided as a Source Data file.
Fig. 8
Fig. 8. In vivo two-photon imaging of NIR-FbLAG16 or NIR-FbLAG30 in the somatosensory cortex of Thy1-GCaMP6f mice.
a Example two-photon fluorescence image from a dual-color time-lapse recording showing GCaMP6f- and miRFP670nano3-expressing neurons in the somatosensory cortex of a behaving Thy1-GCaMP6f mouse. Imaging was performed ~4.5 weeks after stereotactic AAV9-CAG-NIR-FbLAG16 injection. Recording depth (z) from the pial surface and seven somatic regions of interest (ROIs) are indicated. b Color-separated image for the NIR-FbLAG16 channel. c Color-separated image for the GCaMP6f channel. In ac, right, fluorescence transients in the indicated ROIs are shown as ΔR/R (blue) and ΔF/F (red and gray) for the combined and individual channels, respectively. The simultaneously recorded mouse’s locomotor activity on a spherical treadmill is shown above the fluorescence traces. Scale bars, 50 μm (left), 100 mm/s, and 200% (right). d Zoom-ins of the two periods indicated in ac show how the ΔR/R calculation corrects for fluorescence baseline variations caused by mouse locomotor activity and improves calcium spike estimation by identifying potential false positives and false negatives (arrowheads). e Example two-photon fluorescence image from a dual-color time-lapse recording for a Thy1-GCaMP6f mouse injected with AAV9-CAG-NIR-FbLAG30. f Color-separated image for the NIR-FbLAG30 channel. g Color-separated image for the GCaMP6f channel. In eg, right, fluorescent transients in the indicated ROIs are shown as in ac. The simultaneously recorded mouse’s locomotor activity on the spherical treadmill is shown atop. h Zoom-ins of the two periods indicated in eg highlight the advantages of ratiometric imaging as in d. The corresponding time-lapse recordings are shown in Supplementary Movies 9, 10. xy fluorescence image stacks and xz side projections, including the recording sites, are shown in Supplementary Movies 5–8.
Fig. 9
Fig. 9. Targeting GCaMP6f-expressing neurons in the brain of mice with NIR-FbLAG16 or NIR-FbLAG30.
a Example confocal fluorescence images showing GCaMP6f- and miRFP670nano3-expressing neurons (center) in the cortex of an AAV9-CAG-NIR-FbLAG16-injected Thy1-GCaMP6f mouse. The uninfected control hemisphere of the same mouse is shown on the left. Right, zoom-ins of the indicated regions. Scale bars, 500 μm (center, left) and 25 μm (right). b Same as in panel a but for an AAV9-CAG-NIR-FbLAG30-injected Thy1-GCaMP6f mouse. c Population analysis showing the percent overlap between NIR-FbLAG16 and GCaMP6f-positive cell bodies (NIR+/GCaMP6f+: 99.4% ± 0.6%; NIR+/GCaMP6f−: 0.6% ± 0.6%; n = 9 tissue sections from three mice). d Population analysis showing the percent overlap between NIR-FbLAG30 and GCaMP6f-positive cell bodies (NIR+/GCaMP6f+: 99.5% ± 0.4%; NIR+/GCaMP6f-: 0.5% ± 0.4%; n = 9 tissue sections from three mice). c, d Data are presented as mean values  ±  s.d. Source data are provided as a Source Data file.

References

    1. Weissleder, R. & Ntziachristos, V. Shedding light onto live molecular targets. Nat. Med.9, 123–128 (2003). 10.1038/nm0103-123 - DOI - PubMed
    1. Shcherbakova, D. M., Stepanenko, O. V., Turoverov, K. K. & Verkhusha, V. V. Near-Infrared Fluorescent Proteins: Multiplexing and Optogenetics across Scales. Trends Biotechnol.36, 1230–1243 (2018). 10.1016/j.tibtech.2018.06.011 - DOI - PMC - PubMed
    1. Wang, K. et al. Direct wavefront sensing for high-resolution in vivo imaging in scattering tissue. Nat. Commun.6, 7276 (2015). 10.1038/ncomms8276 - DOI - PMC - PubMed
    1. Yang, J. et al. Focusing light inside live tissue using reversibly switchable bacterial phytochrome as a genetically encoded photochromic guide star. Sci. Adv.5, eaay1211 (2019). 10.1126/sciadv.aay1211 - DOI - PMC - PubMed
    1. Li, L. et al. Small near-infrared photochromic protein for photoacoustic multi-contrast imaging and detection of protein interactions in vivo. Nat. Commun.9, 2734 (2018). 10.1038/s41467-018-05231-3 - DOI - PMC - PubMed

Publication types

MeSH terms

LinkOut - more resources