. 2024 Sep 6;15(9):655.
doi: 10.1038/s41419-024-07013-w.

RAB17 promotes endometrial cancer progression by inhibiting TFRC-dependent ferroptosis

Affiliations

RAB17 promotes endometrial cancer progression by inhibiting TFRC-dependent ferroptosis

Xing Zhou et al. Cell Death Dis. .

Abstract

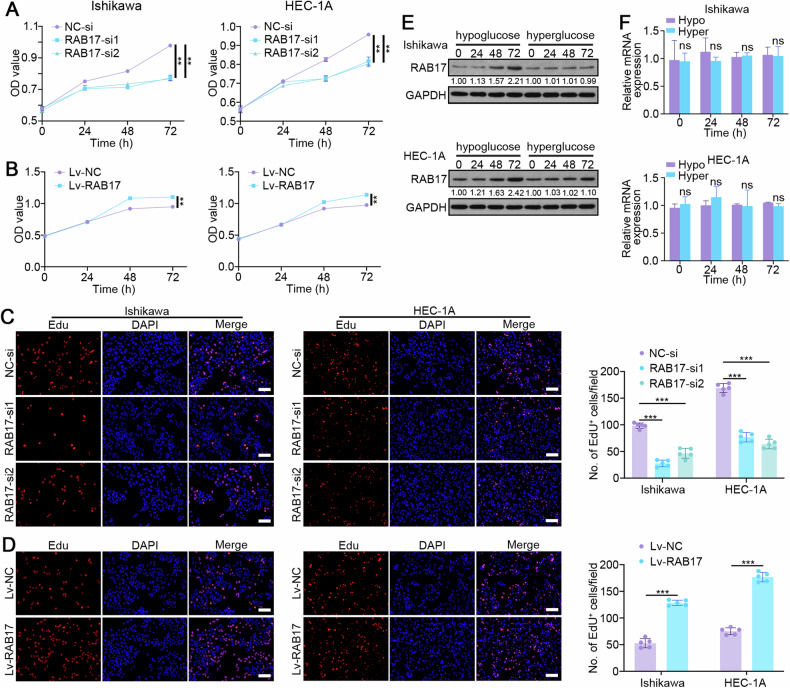
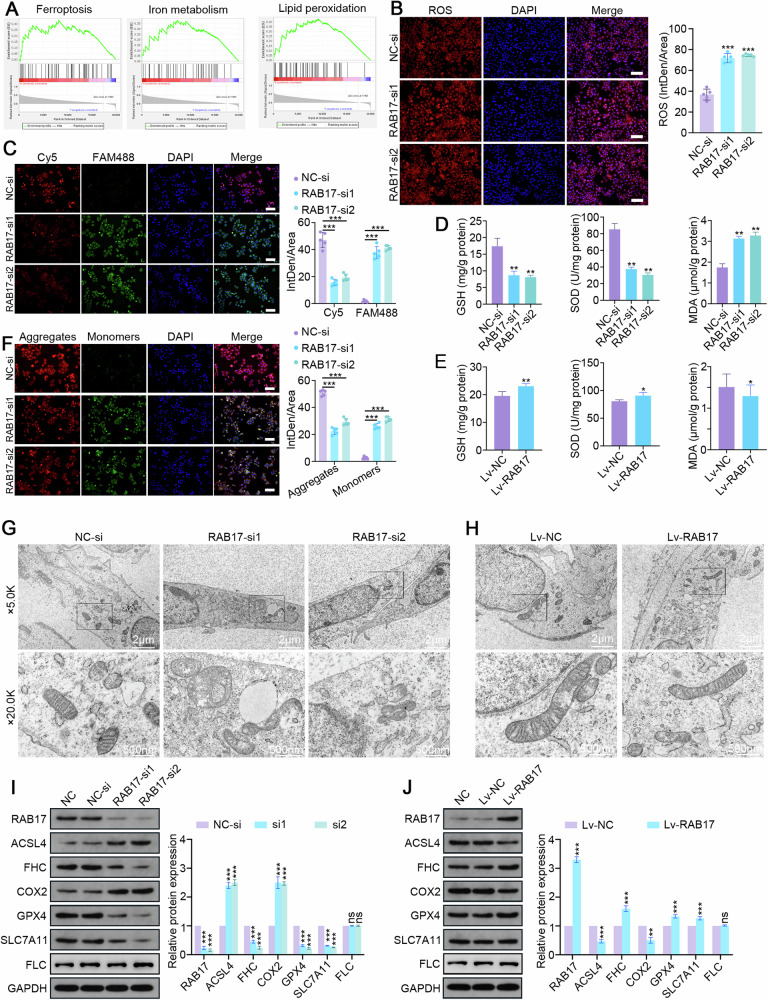
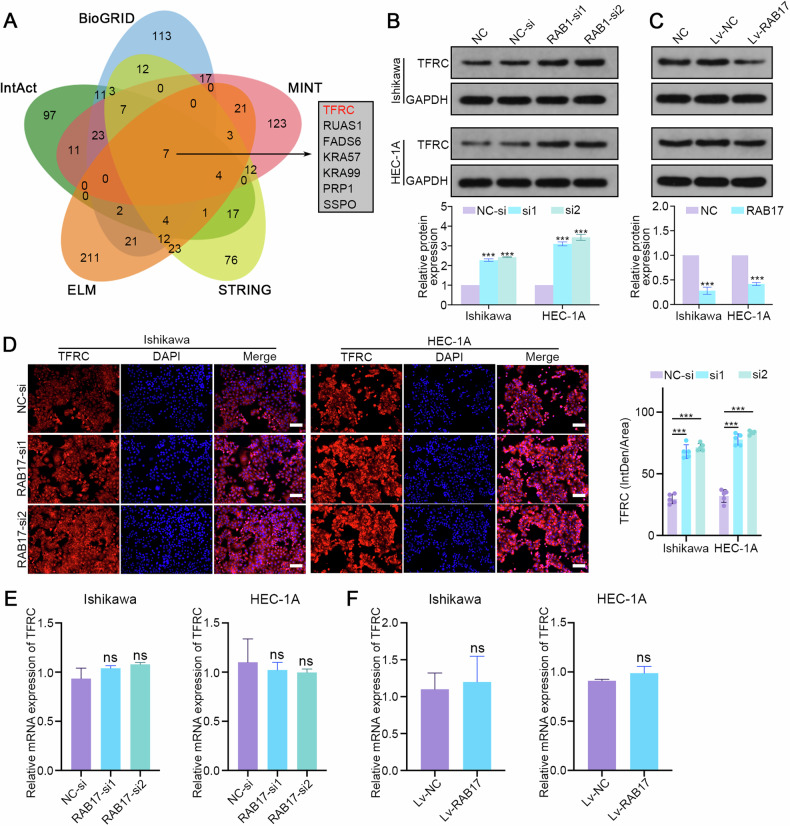
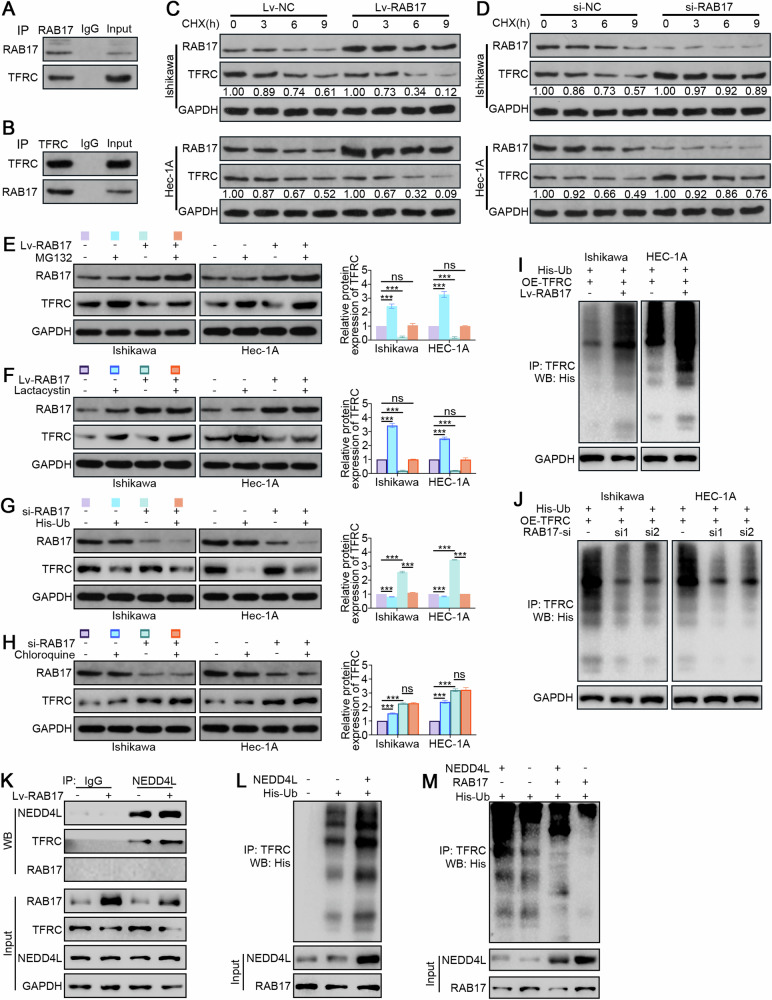
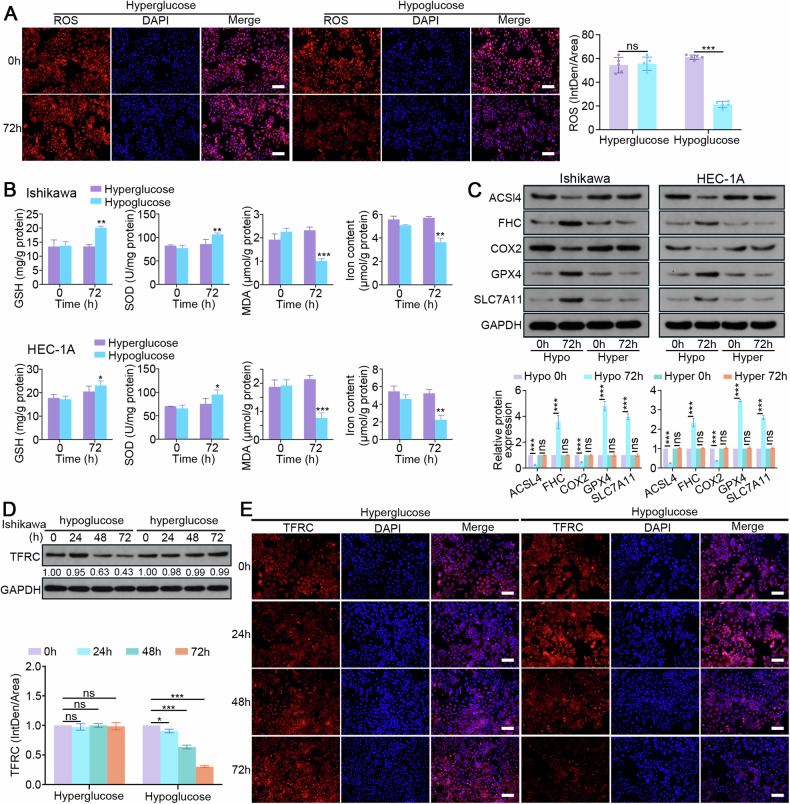
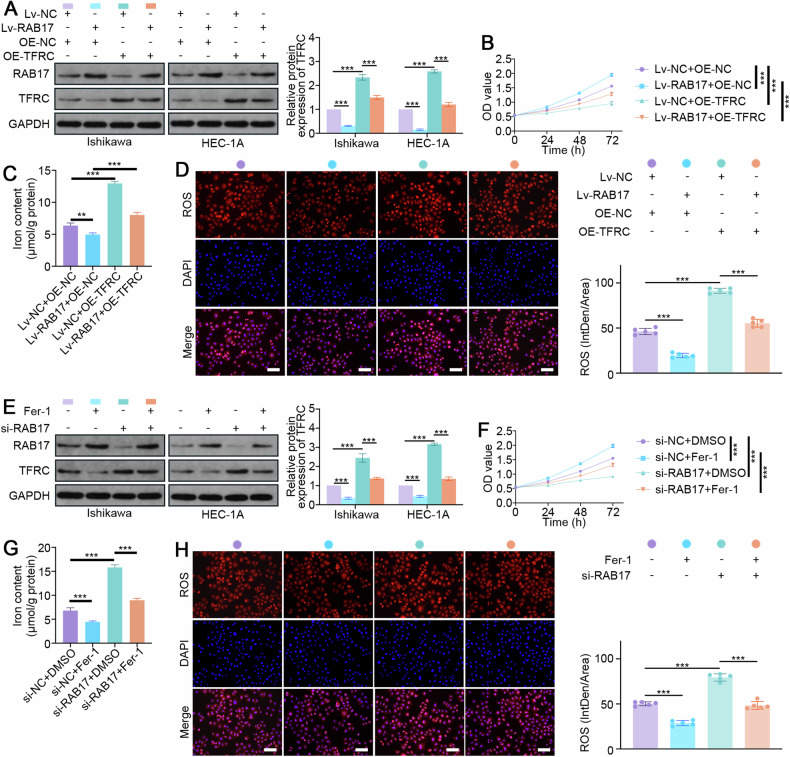
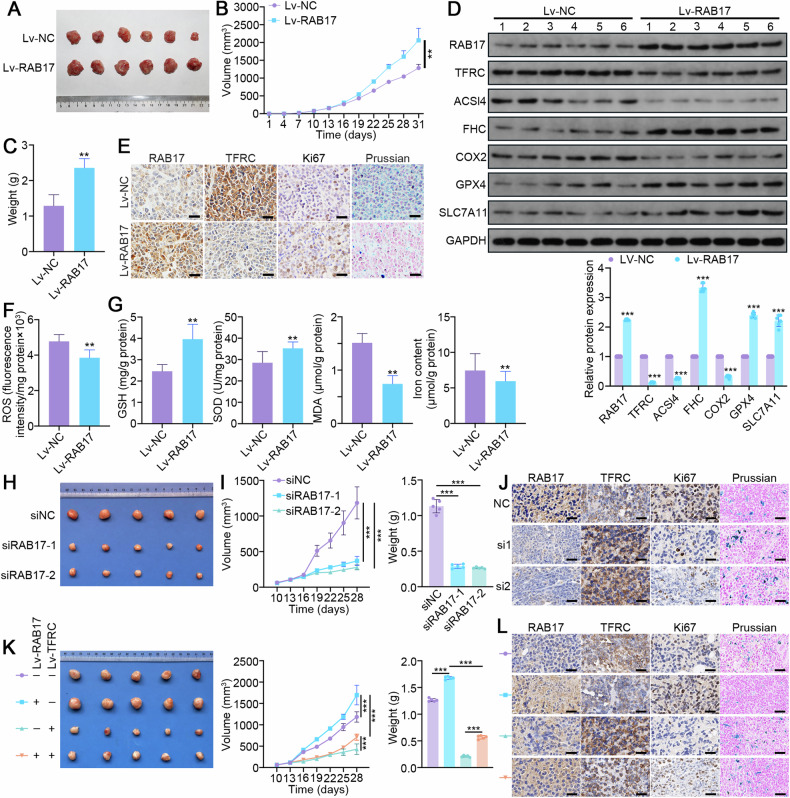
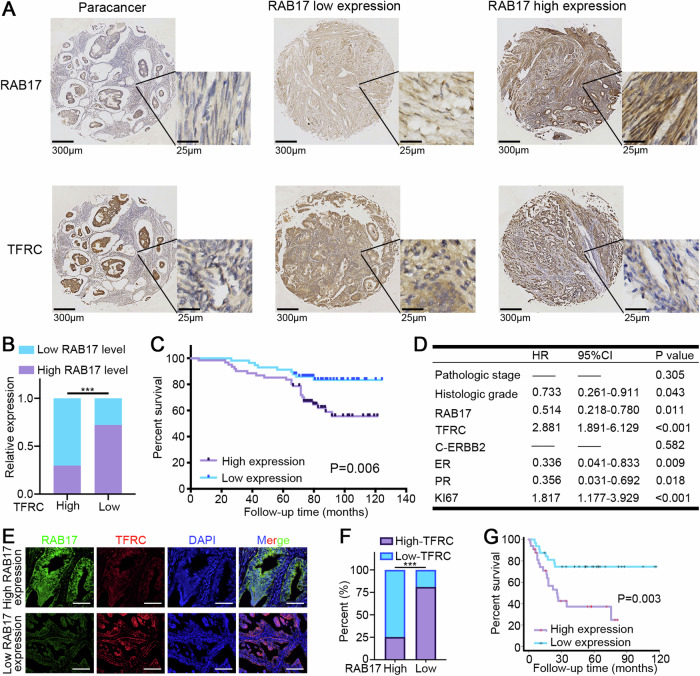
Studies have indicated that RAB17 expression levels are associated with tumor malignancy, and RAB17 is more highly expressed in endometrial cancer (EC) tissues than in peritumoral tissues. However, the roles and potential mechanisms of RAB17 in EC remain undefined. The present study confirmed that the expression of RAB17 facilitates EC progression by suppressing cellular ferroptosis-like alterations. Mechanistically, RAB17 attenuated ferroptosis in EC cells by inhibiting transferrin receptor (TFRC) protein expression in a ubiquitin proteasome-dependent manner. Because EC is a blood-deprived tumor with a poor energy supply, the relationship between RAB17 and hypoglycemia was investigated. RAB17 expression was increased in EC cells incubated in low-glucose medium. Moreover, low-glucose medium limited EC cell ferroptosis and promoted EC progression through the RAB17-TFRC axis. The in vitro results were corroborated by in vivo studies and clinical data. Overall, the present study revealed that increased RAB17 promotes the survival of EC cells during glucose deprivation by inhibiting the onset of TFRC-dependent ferroptosis.


Conflict of interest statement

The authors declare no competing interests.

Figures

Fig. 1
Fig. 1. RAB17 regulates EC cell proliferation.
A CCK-8 assays of Ishikawa and HEC-1A cell lines transfected with normal control siRNA (NC-si) or RAB17 siRNA (RAB17-si). B CCK-8 assays of Ishikawa and HEC-1A cells infected with normal control lentivirus (Lv-NC) or RAB17 overexpression lentivirus (Lv-RAB17). C Results from the EdU assays of Ishikawa and HEC-1A cells transfected with NC-si or RAB17-si for 48 h. Scale bars, 200 μm. D Results from the EdU assays of Ishikawa and HEC-1A cells infected with Lv-NC or Lv-RAB17 for 48 h. Scale bars, 200 μm. E Western blot analysis and (F) qRT–PCR analysis of RAB17 expression in Ishikawa and HEC-1A cells cultured in hyperglycemic (Hyper) or hypoglycemic (Hypo) medium for 72 h, respectively. GAPDH was used as an internal control. All the above assays were independently performed in triplicate (N = 3). The data are presented as the means ± SDs. The statistical analyses were performed by two-tailed unpaired Student’s t tests. **P < 0.01, and ***P < 0.001.
Fig. 2
Fig. 2. RAB17 regulates ferroptosis in EC cells.
A Single-gene GSEA of RAB17 based on TCGA dataset. Representative images of immunofluorescence staining with (B) an ROS probe and (C) a C11-BODIPY probe in Ishikawa cell lines transfected with NC-si or RAB17-si. Scale bars, 200 μm. D GSH, SOD, and MDA levels in Ishikawa cell lines transfected with NC-si or RAB17-si. E GSH, SOD, and MDA levels in Ishikawa cell lines infected with Lv-NC or Lv-RAB17. F Representative images of immunofluorescence staining with a JC-1 probe in Ishikawa cell lines transfected with NC-si or RAB17-si. Scale bars, 200 μm. G Representative transmission electron microscopy images of Ishikawa and HEC-1A cells transfected with NC-si or RAB17-si. H Representative transmission electron microscopy images of Ishikawa and HEC-1A cells infected with Lv-NC or Lv-RAB17. I Western blot analysis of designated marker proteins for ferroptosis in Ishikawa cells transfected with NC-si or RAB17-si. J Western blot analysis of designated ferroptosis marker proteins in Ishikawa cells infected with Lv-NC or Lv-RAB17. GAPDH was used as an internal control. All the above assays were independently performed in triplicate (N = 3). The data are presented as the means ± SDs. The statistical analyses were performed by two-tailed unpaired Student’s t tests. *P < 0.05, **P < 0.01, and ***P < 0.001.
Fig. 3
Fig. 3. RAB17 regulates TFRC expression in EC cells at the posttranscriptional level.
A RAB17-binding proteins predicted based on the BioGRID, IntAct, MINT, ELM, and STRING databases. B Western blot analysis of TFRC expression in Ishikawa and HEC-1A cells transfected with NC-si or RAB17-si. C Western blot analysis of TFRC expression in Ishikawa and HEC-1A cells infected with Lv-NC or Lv-RAB17. D Representative images of IF staining showing TFRC expression in Ishikawa and HEC-1A cells transfected with NC-si or RAB17-si. Scale bars, 200 μm. E qRT–PCR analysis of TFRC expression in Ishikawa and HEC-1A cells transfected with NC-si or RAB17-si. F qRT–PCR analysis of TFRC expression in Ishikawa and HEC-1A cells infected with Lv-NC or Lv-RAB17. GAPDH was used as an internal control. All the above assays were independently performed in triplicate (N = 3). The data are presented as the means ± SDs. The statistical analyses were performed by two-tailed unpaired Student’s t tests. ***P < 0.001.
Fig. 4
Fig. 4. RAB17 regulates TFRC expression in EC cells through the ubiquitin-proteasome pathway.
A Ishikawa cell lysates were incubated with an anti-RAF17 antibody, and interacting proteins were detected by Western blot analysis with an anti-TFRC antibody. B Ishikawa cell lysates were incubated with an anti-TFRC antibody, and interacting proteins were detected by Western blot analysis with an anti-RAB17 antibody. C Ishikawa and HEC-1A cells were infected with Lv-NC and Lv-RAB17. CHX (20 μmol) was added for the indicated time, and the cell lysates were subjected to Western blot analysis for RAB17 and TFRC. D Ishikawa and HEC-1A cells were transfected with NC-si or RAB17-si1. CHX (20 μmol) was added for the indicated time, and the cell lysates were subjected to Western blot analysis for RAB17 and TFRC. E Ishikawa and HEC-1A cells were infected with Lv-NC and Lv-RAB17. The cells were then treated with the MG132 proteasome inhibitor (20 mmol) for 12 h, and Western blot analysis was performed with anti-RAB17 and anti-TFRC antibodies. F Ishikawa and HEC-1A cells were transfected with Lv-NC or Lv-RAB17. The cells were then treated with the lactacystin proteasome inhibitor (10 mmol) for 12 h, and Western blot analysis was performed with anti-RAB17 and anti-TFRC antibodies. G Ishikawa and HEC-1A cells were transfected with NC-si or RAB17-si1. The cells were then transfected with His-tagged ubiquitin-containing vectors (His-Ub) for 12 h, and Western blot analysis was performed with anti-RAB17 and anti-TFRC antibodies. H Ishikawa and HEC-1A cells were transfected with NC-si or RAB17-si1. The cells were then treated with the chloroquine lysosomal inhibitor (10 mmol) for 12 h, and Western blot analysis was performed with anti-RAB17 and anti-TFRC antibodies. I, J Ishikawa and HEC-1A cells were transfected as indicated and treated with MG132 for 12 h. Lysates were immunoprecipitated with anti-TFRC and detected with anti-His. GAPDH was used as an internal control. K Ishikawa cells were infected with Lv-CTL or Lv-RAB17, and cell lysates were immunoprecipitated with the indicated primary antibody and immunoblotted as indicated. L, M Ishikawa cells were transfected as indicated, and then cell lysates were immunoprecipitated with anti-TFRC antibody and detected with anti-His antibody. All the above assays were independently performed in triplicate (N = 3). ***P < 0.001.
Fig. 5
Fig. 5. RAB17 mediates TFRC-dependent ferroptosis in a hypoglycemic state.
A Representative images of immunofluorescence staining with an ROS probe in Ishikawa cell lines cultured in hyperglycemic (Hyper) or hypoglycemic (Hypo) medium for the designated times. Scale bars, 200 μm. B GSH, SOD, MDA, and levels in Ishikawa and HEC-1A cells cultured in hyperglycemic (Hyper) or hypoglycemic (Hypo) medium for the designated times. C Western blot analysis of designated marker proteins for ferroptosis in Ishikawa and HEC-1A cells cultured in hyperglycemic (Hyper) or hypoglycemic (Hypo) medium for the designated times. D Western blot analysis of TFRC expression in Ishikawa cells cultured in hyperglycemic (Hyper) or hypoglycemic (Hypo) medium for the designated times. E Representative images of immunofluorescence staining for TFRC in Ishikawa cell lines cultured in hyperglycemic (Hyper) or hypoglycemic (Hypo) medium for the designated times. Scale bars, 200 μm. GAPDH was used as an internal control. All the above assays were independently performed in triplicate (N = 3). The data are presented as the means ± SDs. The statistical analyses were performed by two-tailed unpaired Student’s t tests. *P < 0.05, **P < 0.01, and ***P < 0.001.
Fig. 6
Fig. 6. TFRC-mediated ferroptosis is critical for RAB17-mediated regulation of EC cell proliferation.
A Western blot analysis of RAB17 and TFRC expression in Ishikawa and HEC-1A cells cotransfected with the designated vectors. B CCK-8 assays of Ishikawa cell lines cotransfected with the designated vectors. C The iron contents of Ishikawa cell lines cotransfected with the designated vectors. D Representative images of immunofluorescence staining with an ROS probe in Ishikawa cell lines cotransfected with the designated vectors. Scale bars, 200 μm. E Western blot analysis of RAB17 and TFRC expression in Ishikawa and HEC-1A cells transfected with/without designated siRNAs or treated with/without Fer-1. F CCK-8 assays of Ishikawa cell lines transfected with/without designated siRNAs or treated with/without Fer-1. G Iron content of Ishikawa cell lines transfected with/without designated siRNAs or treated with/without Fer-1. H Representative images of immunofluorescence staining using an ROS probe in Ishikawa cell lines transfected with/without the indicated siRNAs or treated with/without Fer-1. Scale bars, 200 μm. GAPDH was used as an internal control. All the above assays were independently performed in triplicate (N = 3). The data are presented as the means ± SDs. The statistical analyses were performed by two-tailed unpaired Student’s t tests. **P < 0.01, and ***P < 0.001.
Fig. 7
Fig. 7. RAB17 regulates ferroptosis in ECs in vivo.
A Representative images of the xenografts, (B) tumor volume, and (C) tumor weight 31 days after inoculation of Ishikawa cells infected with Lv-NC or Lv-RAB17 (n = 6 per group). The tumor volumes were measured every 3 days. D Western blot analysis of RAB17 and TFRC expression in Lv-NC and Lv-RAB17 xenografts. E Representative images of immunohistochemical staining for RAB17, TFRC, and KI67, as well as Prussian blue staining, of Lv-NC and Lv-RAB17 xenografts. Scale bars, 100 μm. F ROS levels in Lv-NC and Lv-RAB17 xenografts. G GSH, SOD, MDA, and iron levels in Lv-NC and Lv-RAB17 xenografts. H Western blot analysis of designated ferroptosis marker proteins in Lv-NC and Lv-RAB17 xenografts. GAPDH was used as an internal control. H Representative images of the xenografts, (I) tumor volume, and weight 28 days after inoculation of Ishikawa cells infected with siNC or siRAB17 (n = 5 per group). The tumor volumes were measured every 3 days. J Representative images of immunohistochemical staining for RAB17, TFRC, and KI67, as well as Prussian blue staining, of siNC or siRAB17 xenografts. Scale bars, 100 μm. K Representative images of the xenografts, tumor volume, and weight 28 days after inoculation of Ishikawa cells infected with indicated vectors (n = 5 per group). The tumor volumes were measured every 3 days. L Representative images of immunohistochemical staining for RAB17, TFRC, and KI67, as well as Prussian blue staining, of indicated xenografts. Scale bars, 100 μm. All the above assays were independently performed in triplicate (N = 3). The data are presented as the means ± SDs. The statistical analyses were performed by two-tailed unpaired Student’s t tests. **P < 0.01, and ***P < 0.001.
Fig. 8
Fig. 8. RAB17 and TFRC expression levels are significantly associated with prognosis in patients with EC.
A Representative IHC images of RAB17 and TFRC expression in 118 EC tissues. The right panels (scale bars = 25 μm) show magnified views of the boxed area in the corresponding left panels (scale bars = 300 μm). B Chi-square test based on the immunohistochemical analysis of RAB17 and TFRC expression. C The overall survival (OS) of EC patients with different RAB17 protein expression levels were assessed by Kaplan–Meier survival curves and log-rank tests. D Multivariate analysis of factors associated with overall survival in patients with EC. E Representative immunofluorescence images of RAB17 and TFRC expression in 86 EC tissues from our cohort. F Correlation analysis between RAB17 and TFRC expression, chi-square test was used. G The overall survival (OS) of 86 EC patients from our cohort with different RAB17 protein expression levels were assessed by Kaplan–Meier survival curves and log-rank tests. ***P < 0.001.

References

    1. Coll-de la Rubia E, Martinez-Garcia E, Dittmar G, Gil-Moreno A, Cabrera S, Colas E. Prognostic biomarkers in endometrial cancer: a systematic review and meta-analysis. J Clin Med. 2020;9:1900. 10.3390/jcm9061900 - DOI - PMC - PubMed
    1. Javadian P, Nezhat F. Endometrial carcinoma and its precursors. Adv Exp Med Biol. 2020;1242:59–72. 10.1007/978-3-030-38474-6_4 - DOI - PubMed
    1. Santucci C, Carioli G, Bertuccio P, Malvezzi M, Pastorino U, Boffetta P, et al. Progress in cancer mortality, incidence, and survival: a global overview. Eur J Cancer Prev. 2020;29:367–81. 10.1097/CEJ.0000000000000594 - DOI - PubMed
    1. Ferlay J, Colombet M, Soerjomataram I, Dyba T, Randi G, Bettio M, et al. Cancer incidence and mortality patterns in Europe: estimates for 40 countries and 25 major cancers in 2018. Eur J Cancer. 2018;103:356–87. 10.1016/j.ejca.2018.07.005 - DOI - PubMed
    1. Higashi T. Cancer epidemiology and treatment patterns for older persons in Japan: a review of nationwide data and statistics. Jpn J Clin Oncol. 2022;52:303–12. 10.1093/jjco/hyac011 - DOI - PubMed

LinkOut - more resources