. 2024 Sep 6;15(1):7794.
doi: 10.1038/s41467-024-49457-w.

Intracellular spatial transcriptomic analysis toolkit (InSTAnT)

Affiliations

Intracellular spatial transcriptomic analysis toolkit (InSTAnT)

Anurendra Kumar et al. Nat Commun. .

Erratum in

Abstract

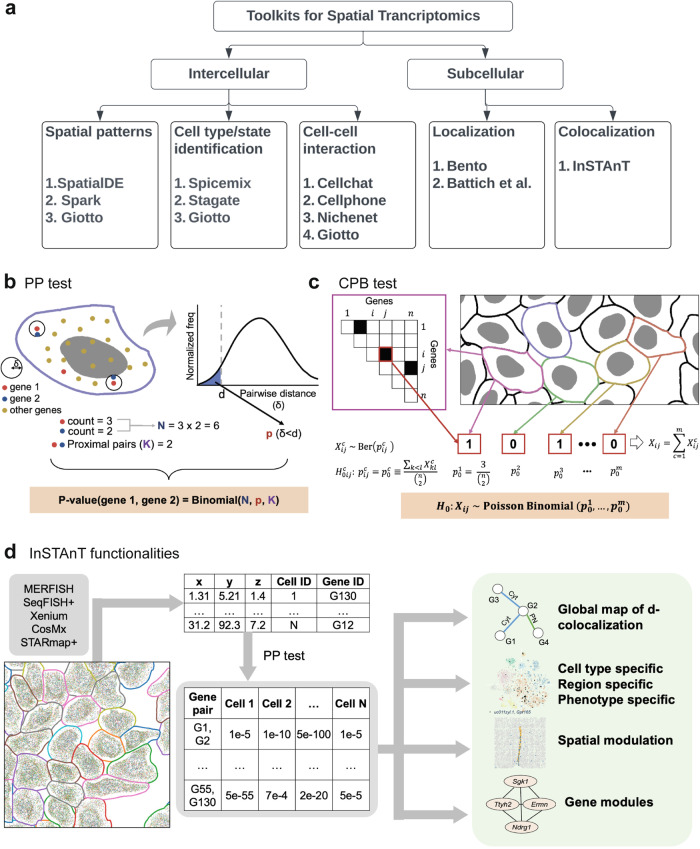
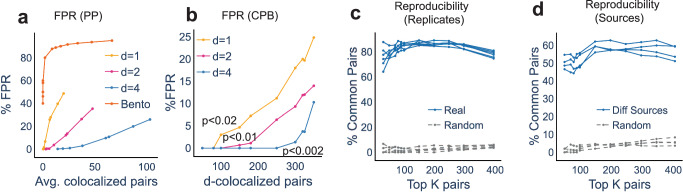
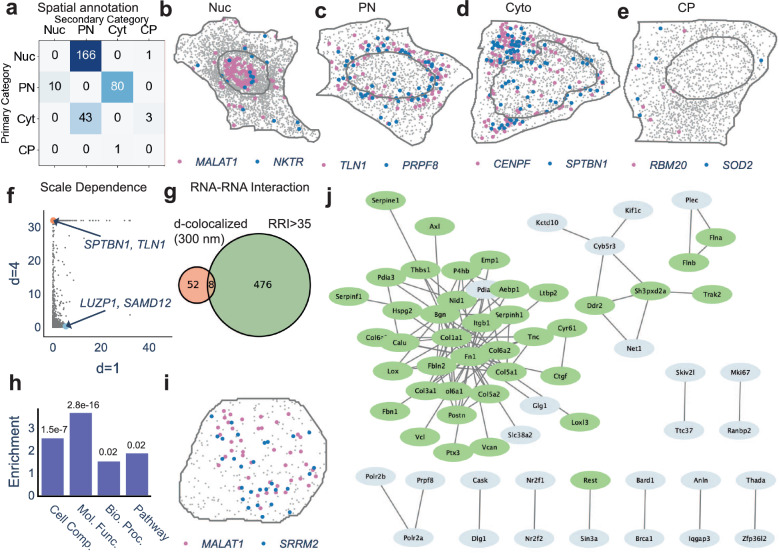
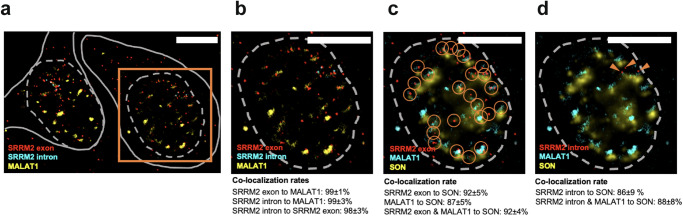
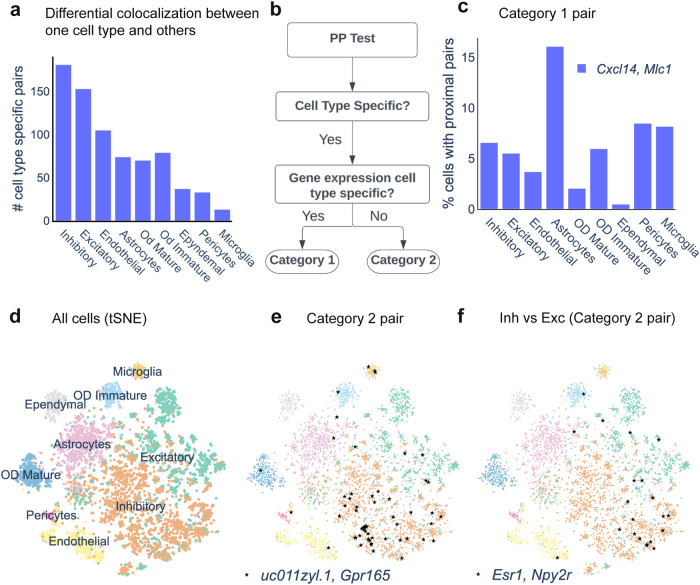
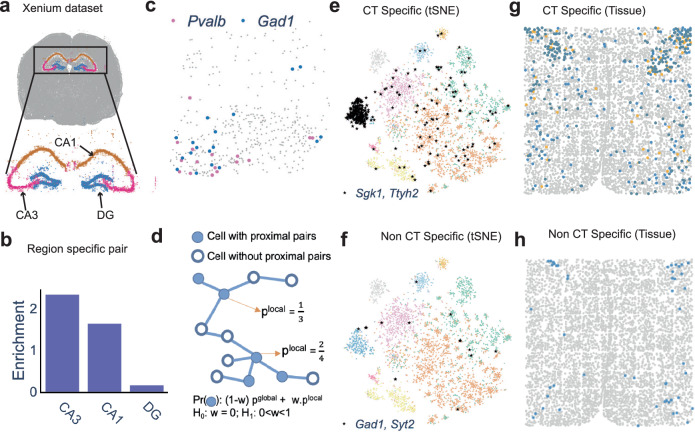
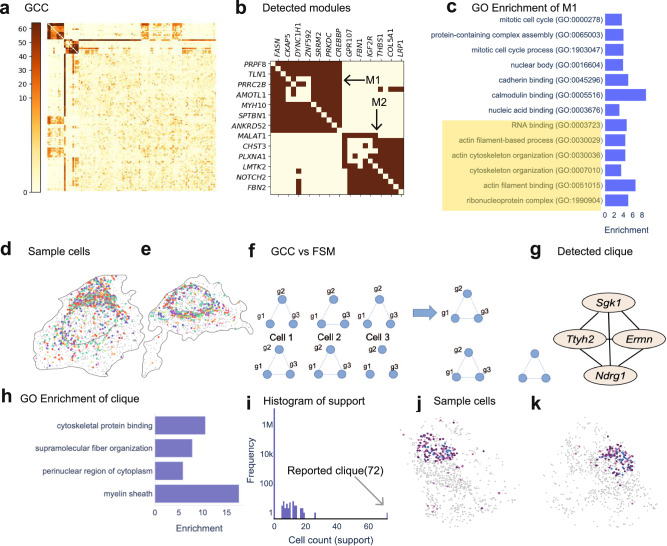
Imaging-based spatial transcriptomics technologies such as Multiplexed error-robust fluorescence in situ hybridization (MERFISH) can capture cellular processes in unparalleled detail. However, rigorous and robust analytical tools are needed to unlock their full potential for discovering subcellular biological patterns. We present Intracellular Spatial Transcriptomic Analysis Toolkit (InSTAnT), a computational toolkit for extracting molecular relationships from spatial transcriptomics data at single molecule resolution. InSTAnT employs specialized statistical tests and algorithms to detect gene pairs and modules exhibiting intriguing patterns of co-localization, both within individual cells and across the cellular landscape. We showcase the toolkit on five different datasets representing two different cell lines, two brain structures, two species, and three different technologies. We perform rigorous statistical assessment of discovered co-localization patterns, find supporting evidence from databases and RNA interactions, and identify associated subcellular domains. We uncover several cell type and region-specific gene co-localizations within the brain. Intra-cellular spatial patterns discovered by InSTAnT mirror diverse molecular relationships, including RNA interactions and shared sub-cellular localization or function, providing a rich compendium of testable hypotheses regarding molecular functions.


Conflict of interest statement

The authors declare no competing interests.

Figures

Fig. 1
Fig. 1. Schematic of InSTAnT.
a Categories of existing analytical toolkits and methods for spatial transcriptomics (ST) datasets. Fewer methods perform subcellular analysis by focusing on gene localization patterns. In contrast, InSTAnT extracts colocalization patterns with statistical rigor. b Schematic of Proximal Pair (PP) test to detect if transcripts of a gene pair (gene 1, gene 2) tend to occur near each other (within distance d) in a single cell. A histogram of distances (δ) between transcript pairs (regardless of gene identity) in the cell is used to calculate the background probability of a transcript pair being near each other p(δ<d), and the number of such proximal pairs (K) of the pair (gene 1, gene 2) is assessed using a Binomial test. c Simplified schematic of Conditional Poisson Binomial (CPB) test. For a gene pair i,j, the random variable Xijc indicates if it is significant under the PP test and follows Bernoulli distribution with parameter p0c, estimated as the fraction of all pairs that are significant in that cell. The sum Xij of Xijc over all cells follows a Poisson Binomial distribution. The CPB test further adjusts p0c to be dependent on the genes i,j (not illustrated here). d Schematic showing functionalities of the InSTAnT toolkit. The input is spatial transcriptomics data with spatial coordinates and gene identifier of each transcript. At the core of the toolkit is the PP test, which reports a p-value for each gene pair in each cell, and these results can then be utilized for various subsequent analysis, shown on the right. The CPB test can be applied on the collection of cells, resulting in the global d-colocalization map; significant pairs are also annotated with the cellular region where they tend to colocalize: Perinuclear (PN) region, Cell Periphery (CP), Cytosol (Cyt) or Nucleus (Nuc). The Differential colocalization routine can be employed to find cell type-specific, region-specific or phenotype-specific colocalization patterns. Other routines can be used to test if a gene pair’s subcellular colocalization is spatially modulated at the tissue level or to identify modules of genes that colocalize with each other.
Fig. 2
Fig. 2. Assessment of InSTAnT on U2OS MERFISH data.
a Estimates of false positive rates (FPR) on U2OS MERFISH data, at varying p-value thresholds for PP test (at three different values of distance threshold d) and at varying colocation quotient scores used by Bento. (Bento was set to use number of neighbor K = 10; this corresponds to d ~ 5.5 mu.) FPR is calculated by comparing the average number of significant pairs per cell on randomized data to the average number on real data. The estimated FPR (y) is plotted against the average number of significant pairs detected per cell (x). b Estimates of FPR of the CPB test plotted against number of detected gene pairs, at varying p-value thresholds (p value < 0.02 for d = 1, p value < 0.01 for d = 2, p value < 0.002 for d = 4). Results are shown for three different values of the distance threshold d. The number of significant pairs on randomized data is compared to the number (at the same p-value threshold) on real data to obtain an FPR estimate at that threshold. c Reproducibility of CPB test results across replicates of a dataset. For each pair of replicates (out of four), the K most significant pairs (by CPB test) in either replicate are compared, and the percentage of shared pairs (out of K) reported (blue). The exercise was repeated for randomized versions of the replicates to obtain random baselines (grey). d Reproducibility of CPB test results across different datasets. Each replicate of the Moffit et al. MERFISH data set was compared to our MERFISH data for U2OS to obtain percentages of common d-colocalized pairs (blue). Corresponding random baselines are shown in grey.
Fig. 3
Fig. 3. Characterization and validation of d-colocalization maps.
a Regional annotation (nuclear, perinuclear, cytoplasm or peri-membrane) of all d-colocalized gene pairs detected in U2OS MERFISH data. Proximally located transcripts of a d-colocalized gene pair across all cells are recorded and aggregated over all cells to obtain the most and second-most frequent regional annotations. b–e Examples of d-colocalized gene pairs annotated as nuclear (b), perinuclear (c), cytosolic (d) and cell periphery (e), respectively. Shown is one of many cells in which the respective gene pair was significant by the PP test. f Negative log p-value from the CPB test for all gene pairs, at d = 1 micron and d = 4 micron. An example of a gene pair specific to each d is highlighted. g Overlap of the set of d-colocalized gene pairs (d = 300 nm) with gene pairs with high RNA-RNA interaction (RRI > 35) scores (Hypergeometric test p-value of 0.02, due to 8 gene pairs common to both sets). h Hypergeometric test shows enrichment of set of d-colocalized pairs with set of functionally related gene pairs. A gene pair is functionally related if both genes are annotated with same GO terms (Cellular Component, Molecular Function, Biological Process) or Kegg pathways. i Nucleus of a cell showing transcripts of MALAT1 and SRRM2. The PP test p-value for this nucleus is 4.3e-19. j Cytoscape visualization of top 109 d-colocalized gene pairs (CPB p-value < 1e-10) detected at d = 2 on SeqFISH+ data on NIH/3T3 cell line. We noted a large module of genes related to extracellular matrix (green nodes), encoding proteins that are either components of the ECM or known for remodeling ECM or mediating ECM-cell interactions.
Fig. 4
Fig. 4. Colocalization of SRRM2 and MALAT1 in Nuclear Speckles.
a SRRM2 exon (red), SRRM2 intron (cyan), and MALAT1 (yellow). RNAs labeled with smFISH probes in fixed U-2 OS cells. Dashed gray lines indicate the nuclear boundaries, and solid gray lines indicate cytosolic boundaries. b Selected nuclear region shown in the orange box in a, showing high co-localization rate of SRRM2 exon mRNAs with MALAT1 lncRNAs in the nucleus. As expected, the SRRM2 intron puncta co-localize with SRRM2 exon puncta. c SRRM2 exon mRNA (red), MALAT1 lncRNA (cyan), and SON protein (yellow) labeled in the same nucleus as b. Orange circles indicate co-localization of SRRM2 exon puncta and MALAT1 puncta, most of the SRRM2 exons co-localize with MALAT1. SON protein was selected to label nuclear speckles. Many co-localized RNA pairs are nearby to SON protein. d Similar as (c), plotting SRRM2 intron (red) with MALAT1 lncRNA and SON protein, orange arrows indicate SRRM2 intron puncta that co-localize with MALAT1 puncta. Similar to SRRM2 exon puncta, SRRM2 intron puncta tend to be near SON protein. The experiment was performed once and co-localization rate was calculated using 13 cells. Scale bars for (ad) is 10 µm.
Fig. 5
Fig. 5. Cell type-specificity of d-colocalized pairs in mouse hypothalamus preoptic region.
a Bar plot showing number of cell type-specific pairs for each cell type using Differential Colocalization routine. (“Od” stands for oligodendrocytes.) b Flow chart showing how a differentially colocalized pair is classified into one of the two categories depending on whether either gene is a marker of that cell type. c Example of a category 1 pair, found to be a proximal pair in many cells of different types but significantly more frequently in astrocytes. Shown is the percentage of cells of each type where the gene pair is significant in the PP test. The gene pair is of category 1 because both genes are marker genes. d t-SNE plot of all cells annotated with cell type assignments obtained from Moffit et al. The gene count for each cell is aggregated by summing their transcript count across seven z-slices. e Example of a category 2 pair, specific to inhibitory neurons. Each black star is a cell where the pair was significant under PP test. f Example of a category 2 gene pair specific to inhibitory neurons compared to excitatory neurons. (Cell type- specificity was defined based on a two-way comparison here, in contrast to the one-versus-all comparison used for examples in a, c, e.).
Fig. 6
Fig. 6. InSTAnT detects d-colocalization patterns with tissue-level spatial variation in mouse hypothalamus preoptic region.
a Xenium data from mouse brain, with cells in analyzed regions - CA1 (orange), CA3(pink) and Dentate Gyrus (blue) in hippocampus – shown in color. b Enrichment of a category 2 gene pair (Pvalb, Gad1) in CA3 and CA1 cells. Enrichment is obtained as ratio of fraction of cells with proximal pairs in one region vs other two regions. c A sample cell showing the colocalization of the pair Pvalb, Gad1 (z axis not shown). d Probabilistic graphical model to detect spatially modulated gene pair. In a graph where nodes represent cells and edges represent spatial proximity, each cell is first flagged based on whether the gene pair is significant by PP test in that cell. The likelihood function is a product over all cells of a weighted sum of plocal, the local density of flagged cells in cell’s neighborhood, and pglobal, a free parameter. The weight w is also a free parameter. A likelihood ratio score is computed to compare this model to a null model where the local (spatial) information is not used. e t-SNE plot of a spatially modulated d-colocalized gene pair (Sgk1, Ttyh2) showing that it is a proximal pair (black stars) significantly more often in Mature Oligodendrocytes (OD) though it is detected in other cell types as well. (See Fig. 5d for cell type annotations.) g Cells in spatial coordinates, shown in blue if the gene pair of (e) – Sgk1, Ttyh2 – is a proximal pair, in orange if the cell is Mature OD but Sgk1, Ttyh2 is not a proximal pair, and in grey otherwise. (f, h) t-SNE plot (f) and spatial plot (h) of a gene pair (Gad1, Syt2) that is spatially modulated but not specific to any cell type.
Fig. 7
Fig. 7. Gene module discovery.
a Global Colocalization Clustering (GCC): Global d-colocalization map for U2OS data, represented as a matrix of -log(p-value) of CPB test for gene pairs, is subjected to hierarchical clustering to reveal two gene modules. b Closer view of the two modules (M1, M2) discovered by GCC, shown after thresholding p-values at 1e-4 (FPR < 2%). c Gene Ontology (GO) terms enriched in gene module M1, shown with the fold enrichment over random expectation. (Criterion for selection: Fisher exact p value < 0.03) d, e Two cells illustrating spatial distribution of transcripts of M1 genes (colored dots) along with all other transcripts (grey). Each color corresponds to a gene. f Schematic illustration of difference between Global Colocalization Clustering (GCC) and Frequent Subgraph Mining (FSM). In each row, the three graphs on the left show proximal pair relationships (edges) involving genes g1, g2, g3, in three different cells. In either case, GCC reports the 3-gene module as the global map includes each of the three gene pairs. FSM, on the other hand, finds the 3-gene clique to occur frequently in the bottom scenario but not in the top scenario. g A 4-gene module detected using FSM on brain data. h Gene ontology terms enriched in the 4-gene module of g. (Criterion of selection: Fisher exact p value < 0.03). i Histogram of “support” of all possible 4-gene cliques. Support refers to the number of cells where all pairwise relationships in the 4-gene set are significant by the PP test. The clique of g has a support of 72, far greater than all other cliques. j, k Example of two cells supporting the 4-gene module of g. Each color represents a transcript of one of the four genes, grey represents all other transcripts.

Update of

Similar articles

Cited by

References

    1. Rao, A., Barkley, D., França, G. S. & Yanai, I. Exploring tissue architecture using spatial transcriptomics. Nature596, 211–220 (2021). - PMC - PubMed
    1. Marx, V. Method of the Year: spatially resolved transcriptomics. Nat. methods18, 9–14 (2021). - PubMed
    1. Svensson, V., Teichmann, S. A. & Stegle, O. SpatialDE: identification of spatially variable genes. Nat. methods15, 343–346 (2018). - PMC - PubMed
    1. Zhu, J., Sun, S. & Zhou, X. SPARK-X: non-parametric modeling enables scalable and robust detection of spatial expression patterns for large spatial transcriptomic studies. Genome Biol.22, 1–25 (2021). - PMC - PubMed
    1. Chidester, B., Zhou, T., Alam, S. & Ma, J. SpiceMix enables integrative single-cell spatial modeling of cell identity. Nat. Genet.55, 78–88 (2023). - PMC - PubMed

Publication types

LinkOut - more resources