. 2024 Sep 6;15(9):656.
doi: 10.1038/s41419-024-07041-6.

Maintenance of magnesium homeostasis by NUF2 promotes protein synthesis and anaplastic thyroid cancer progression

Affiliations

Maintenance of magnesium homeostasis by NUF2 promotes protein synthesis and anaplastic thyroid cancer progression

Lisha Bao et al. Cell Death Dis. .

Erratum in

Abstract

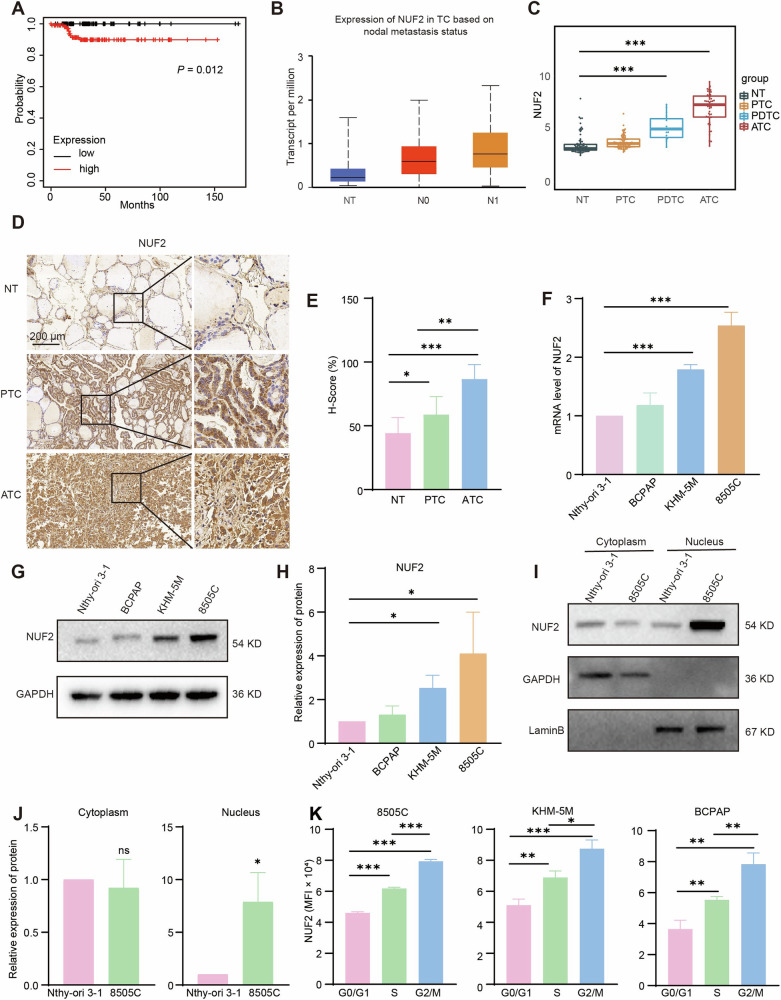
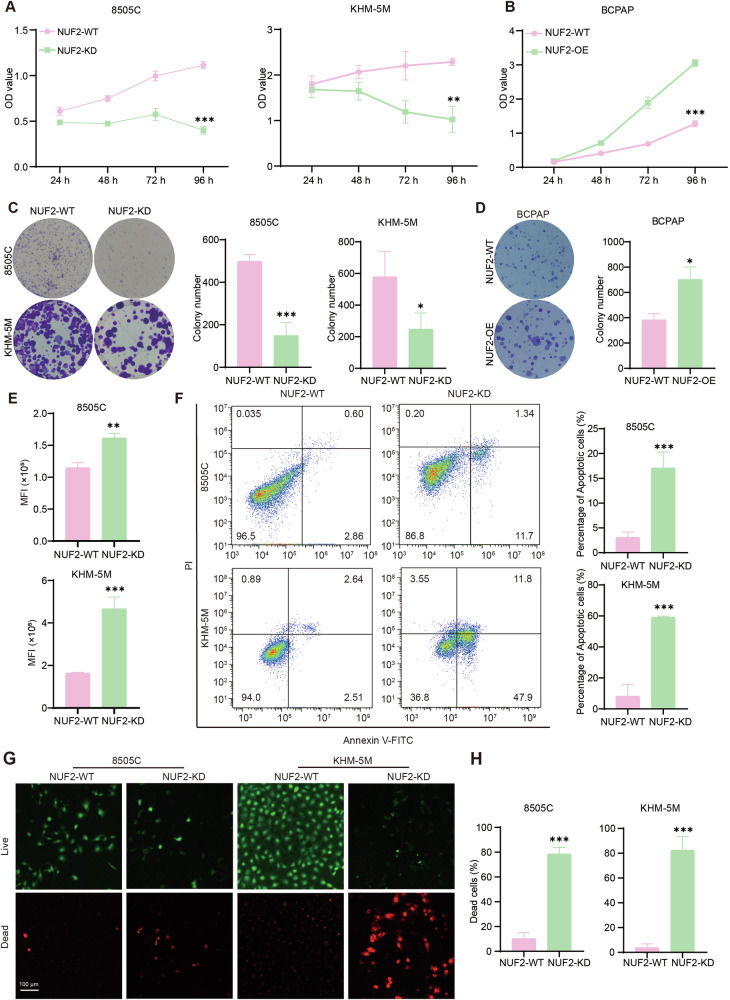
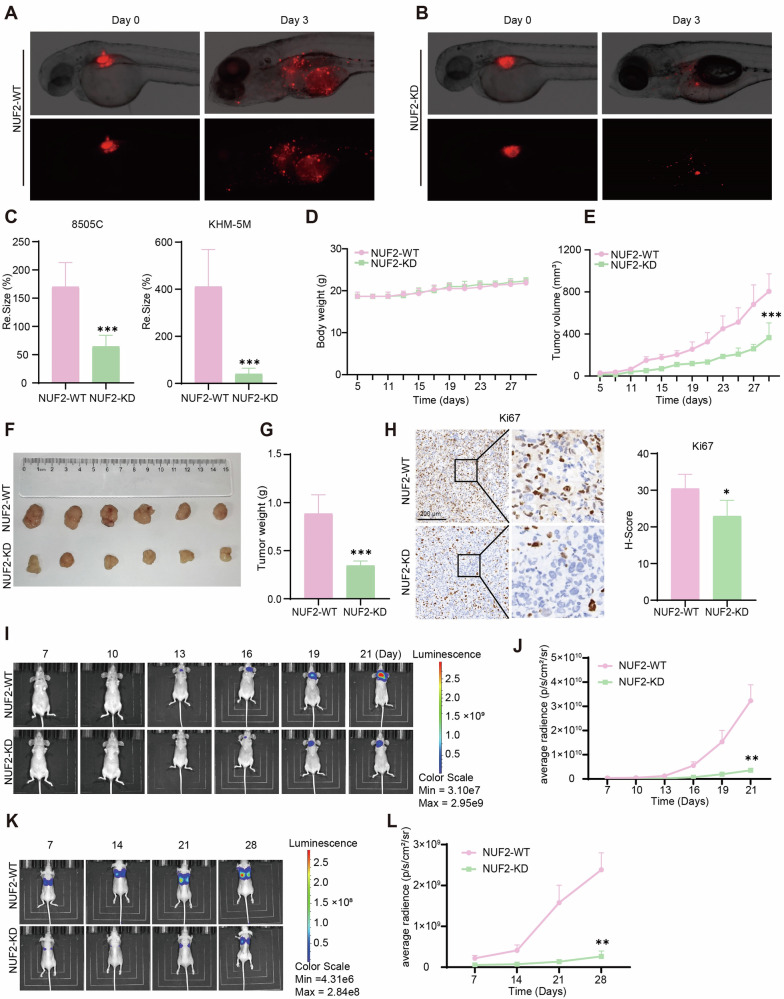
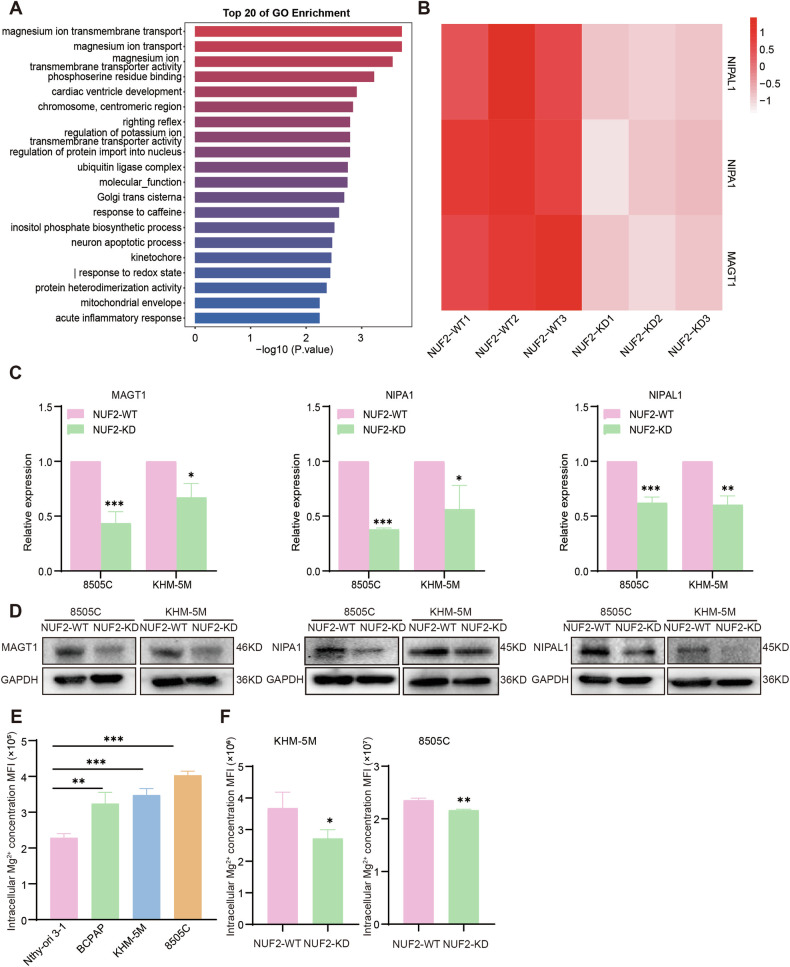
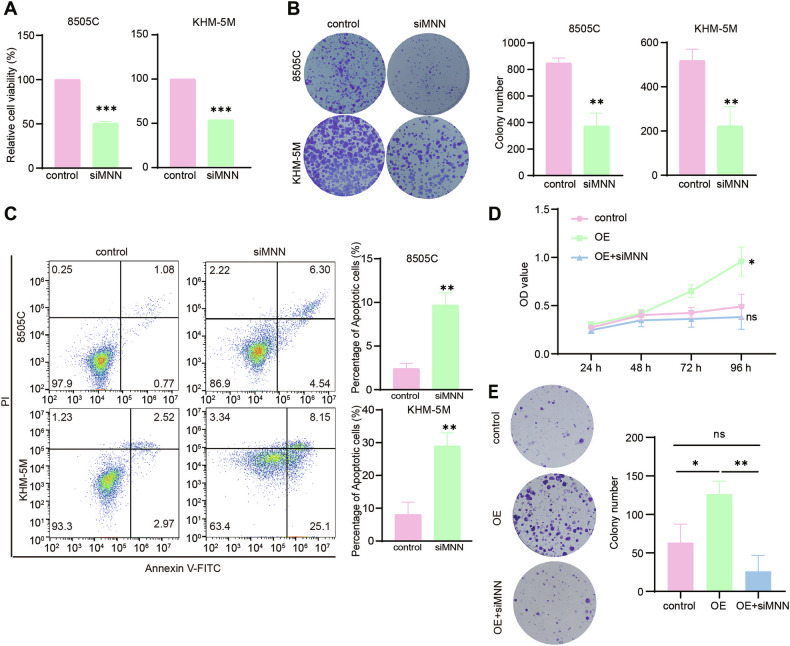
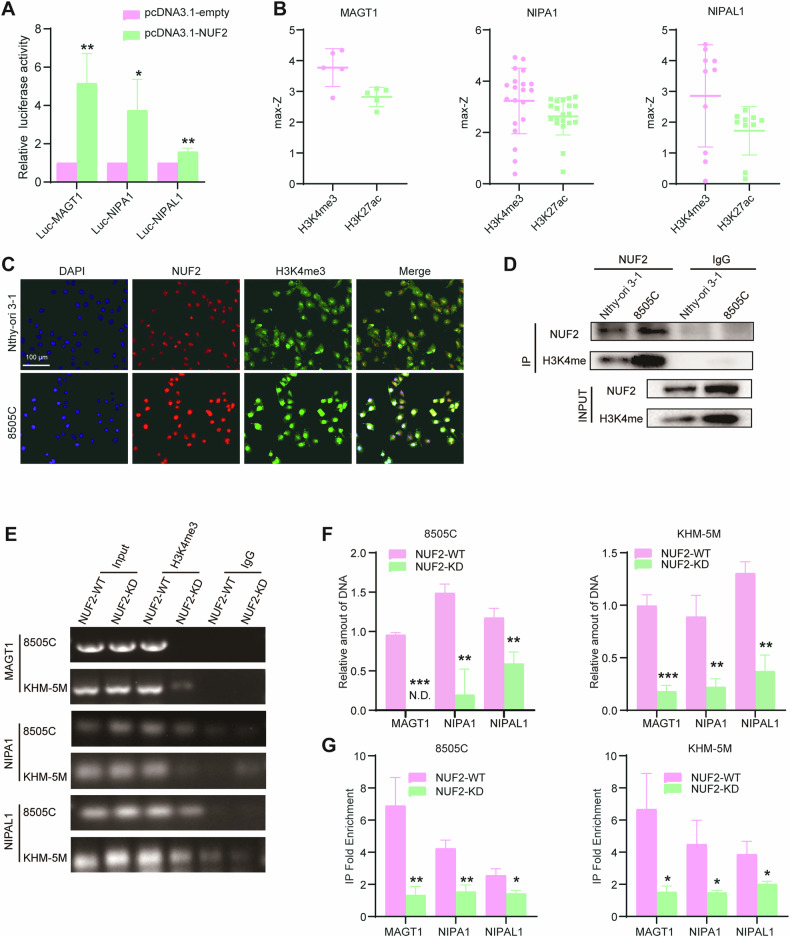
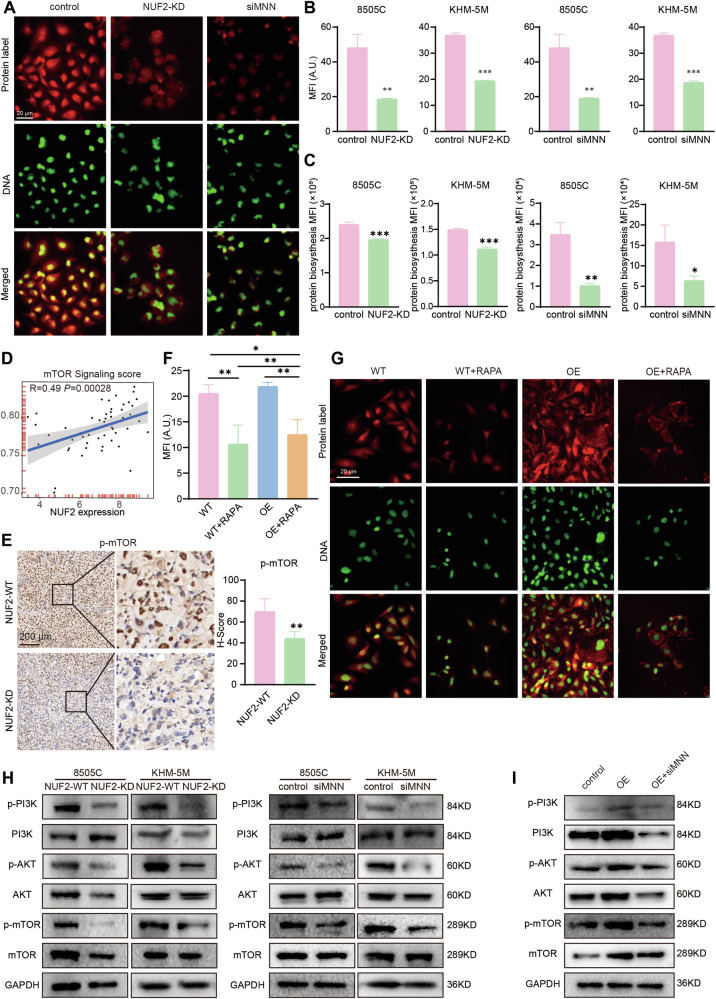
Thyroid cancer is the most frequently observed endocrine-related malignancy among which anaplastic thyroid cancer (ATC) is the most fatal subtype. The synthesis of protein is active to satisfy the rapid growth of ATC tumor, but the mechanisms regulating protein synthesis are still unknown. Our research revealed that kinetochore protein NUF2 played an essential role in protein synthesis and drove the progression of ATC. The prognosis of patients with thyroid carcinoma was positively correlated with high NUF2 expression. Depletion of NUF2 in ATC cells notably inhibited the proliferation and induced apoptosis, while overexpression of NUF2 facilitated ATC cell viability and colony formation. Deletion of NUF2 significantly suppressed the growth and metastasis of ATC in vivo. Notably, knockdown of NUF2 epigenetically inhibited the expression of magnesium transporters through reducing the abundance of H3K4me3 at promoters, thereby reduced intracellular Mg2+ concentration. Furthermore, we found the deletion of NUF2 or magnesium transporters significantly inhibited the protein synthesis mediated by the PI3K/Akt/mTOR pathway. In conclusion, NUF2 functions as an emerging regulator for protein synthesis by maintaining the homeostasis of intracellular Mg2+, which finally drives ATC progression.


Conflict of interest statement

The authors declare no competing interests.

Figures

Fig. 1
Fig. 1. Expression of NUF2 in ATC and clinical relevance.
A The relevance of NUF2 expression and relapse-free survival (RFS) in patients with thyroid cancer (TC). B Expression of NUF2 in TC subgroups based on nodal metastasis status. C The expression of NUF2 in NT, PTC, PDTC, and ATC based on four microarray datasets from GEO database. D, E IHC staining of NUF2 in NT and ATC tissues. FH The mRNA and protein levels of NUF2 in different thyroid cancer cell lines. I, J The expression of NUF2 in cytoplasm and nucleus. K The expression of NUF2 in different cell cycle phases. Data are presented as the mean ± SD. *P < 0.05, **P < 0.01, ***P < 0.001.
Fig. 2
Fig. 2. Expression of NUF2 is associated with proliferation and apoptosis in ATC cells.
A In vitro growth curves of ATC cells transfected with siNUF2. B In vitro growth curves of BCPAP cells after NUF2 overexpression. C Colony formation of ATC cells transfected with siNUF2. D Colony formation of BCPAP cells with NUF2 overexpression. E The cell division was determined by CFSE after NUF2 knockdown by siRNA. F Apoptosis of ATC cells 48 h after NUF2 knockdown by siRNA. G, H Cell viability of ATC cells transfected with siNUF2 (Live cells: Calcein-AM, Dead cells: PI). Data are presented as the mean ± SD. *P < 0.05, **P < 0.01, ***P < 0.001.
Fig. 3
Fig. 3. NUF2 promoted ATC tumor growth and metastasis in vivo.
AC Tumor growth from zebrafish-CDX model in control and NUF2-KD groups. D Weight growth curve of nude mice. E, F The ATC xenograft tumor volume and growth curve in nude mice. G Tumor weight of control and NUF2-KD groups. H IHC staining of Ki67 in mouse xenografts. I Representative images showing luciferase activity in orthotopic ATC tumor xenograft. J Luciferase activity curve of orthotopic ATC tumor model. K, L The tumor metastasis in nude mice. n = 6 mice per group. Data are presented as the mean ± SEM. *P < 0.05, **P < 0.01, ***P < 0.001.
Fig. 4
Fig. 4. NUF2 knockdown inhibited the magnesium ion transport pathway in ATC.
A Top 20 of GO enrichment according to the data of RNA-sequencing in 8505C cells which were transfected with siRNA-NUF2 and siRNA-NC, respectively. B The expression levels of genes in magnesium ion transport pathway. C, D The mRNA and protein levels of MAGT1, NIPA1, and NIPAL1 in NUF2-WT and NUF2-KD ATC cells. E The intracellular Mg2+ concentration of Nthy-ori 3-1, BCPAP, KHM-5M, and 8505C cell lines. F The intracellular Mg2+ concentration of NUF2-WT and NUF2-KD ATC cells (8505C, KHM-5M). Data are presented as the mean ± SD. *P < 0.05, **P < 0.01, ***P < 0.001.
Fig. 5
Fig. 5. NUF2 promoted cell proliferation by regulating magnesium transporters.
A Cell viability of 8505C and KHM-5M cells transfected with siMNN (MAGT1 + NIPA1 + NIPAL1) or siRNA-NC. B Colony formation of control or siMNN 8505 C and KHM-5M cells. C Apoptosis of control and siMNN ATC cells. Growth curve (D) and colony formation (E) of BCPAP cells with NUF2 overexpression and siMNN. Data are presented as the mean ± SD. *P < 0.05, **P < 0.01, ***P < 0.001.
Fig. 6
Fig. 6. NUF2 regulate the transcription of magnesium ion transporters by H3K4me3.
A Relative luciferase activity in 293T cells treated with pcDNA3.1 empty vector and NUF2 plasmids. B Max-Z score of H3K4me3 and H3K27ac in the thyroid glands of four patients. C Double immunofluorescence for NUF2 and H3K4me3 in 8505 C and Nthy-ori 3-1 cells. D Coimmunoprecipitation (CoIP) assay of NUF2, H3K4me3 and H3K27ac. EG The abundance of H3K4me3 at the MAGT1, NIPA1 and NIPAL1 promoters in ATC cell lines was analyzed by chromatin immunoprecipitation. Data are presented as the mean ± SD. *P < 0.05, **P < 0.01, ***P < 0.001.
Fig. 7
Fig. 7. NUF2-mediating magnesium homeostasis affected the efficiency of protein synthesis by PI3K/Akt/mTOR pathway.
AC Nascent proteins in ATC cells transfected with siNUF2 or siMNN. D Spearman correlation analysis of mTOR signaling score and NUF2 expression in ATC samples. E IHC staining of p-mTOR in mouse xenografts. F, G Protein synthesis in WT and NUF2-OE BCPAP cells treated with mTOR inhibitor RAPA. H Western blot analysis of PI3K/Akt/mTOR signaling followed by NUF2 knockdown or siMNN. I Western blot analysis of PI3K/Akt/mTOR signaling followed by NUF2 overexpression and siMNN. Data are presented as the mean ± SD. *P < 0.05, **P < 0.01, ***P < 0.001.

Similar articles

References

    1. Siegel RL, Miller KD, Jemal A. Cancer Statistics, 2017. CA Cancer J Clin. 2017;67:7–30. - PubMed
    1. Saini S, Tulla K, Maker AV, Burman KD, Prabhakar BS. Therapeutic advances in anaplastic thyroid cancer: a current perspective. Mol Cancer. 2018;17:154. - PMC - PubMed
    1. Agosto Salgado S. Evolution of anaplastic thyroid cancer management: perspectives in the era of precision oncology. Ther Adv Endocrinol Metab. 2021;12:20420188211054692. - PMC - PubMed
    1. Jannin A, Escande A, Al Ghuzlan A, Blanchard P, Hartl D, Chevalier B, et al. Anaplastic thyroid carcinoma: an update. Cancers. 2022;14:1061. - PMC - PubMed
    1. Kovalski JR, Kuzuoglu-Ozturk D, Ruggero D. Protein synthesis control in cancer: selectivity and therapeutic targeting. EMBO J. 2022;41:e109823. - PMC - PubMed

MeSH terms