. 2024 Sep 6;15(1):7811.
doi: 10.1038/s41467-024-52136-5.

Glutathione peroxidase 3 is a potential biomarker for konzo

Affiliations

Glutathione peroxidase 3 is a potential biomarker for konzo

Matthew S Bramble et al. Nat Commun. .

Abstract

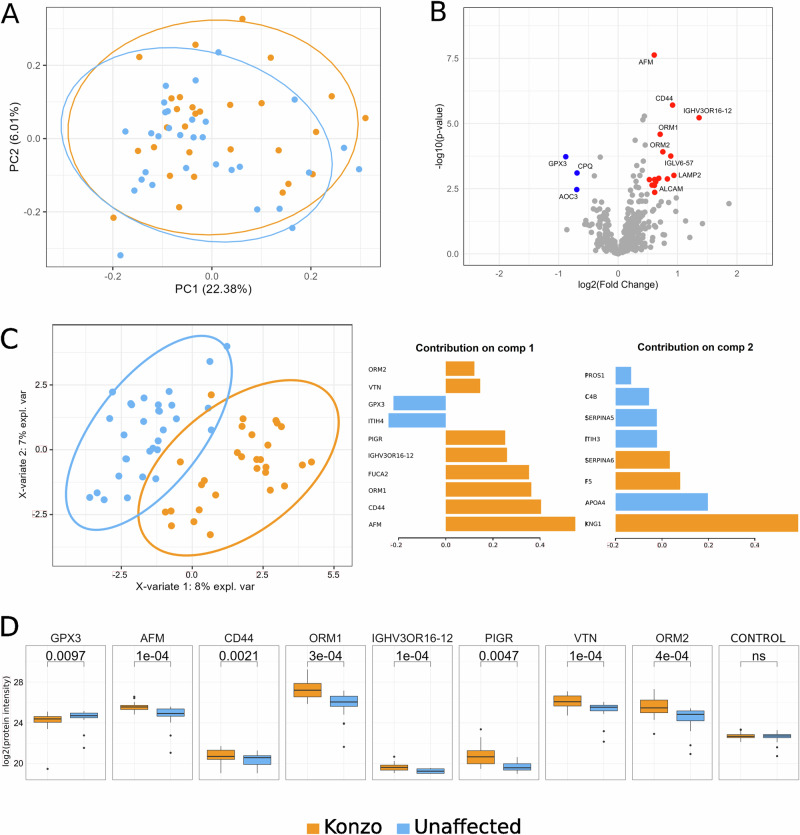
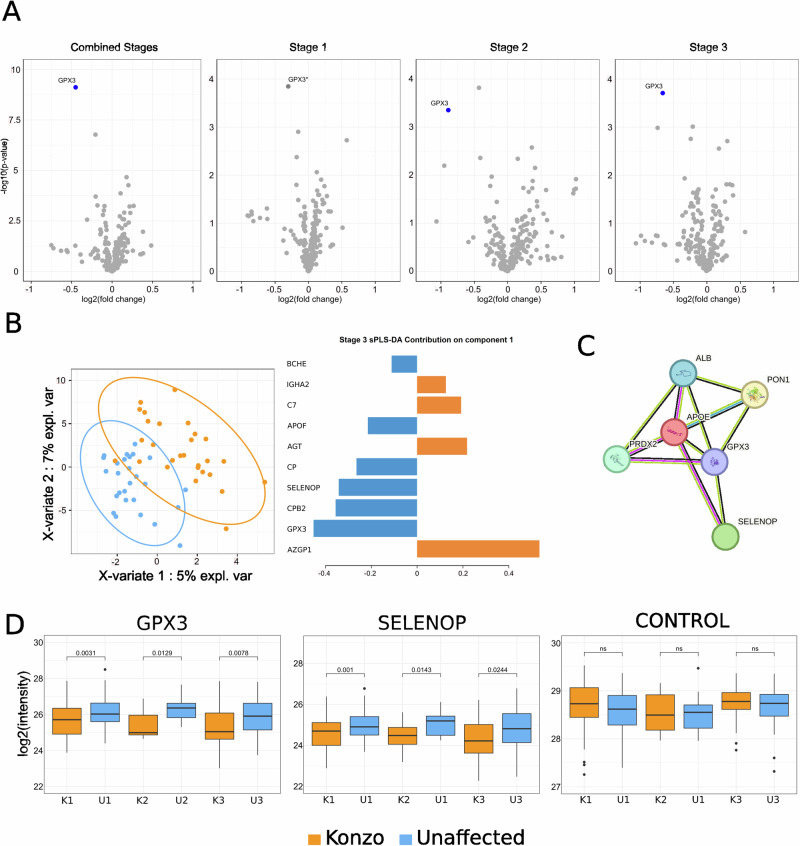
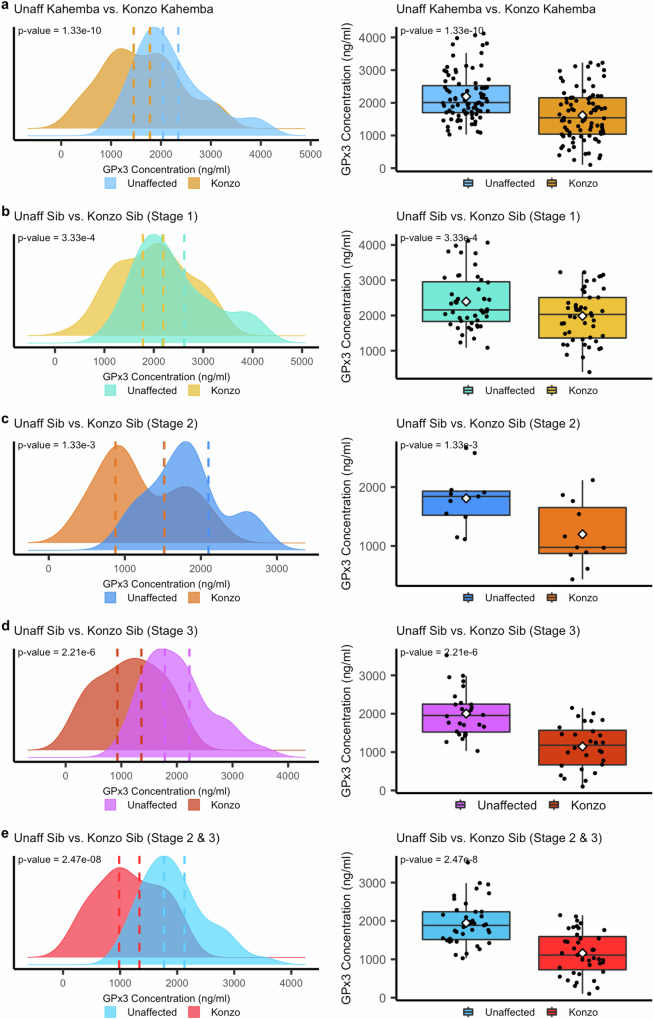
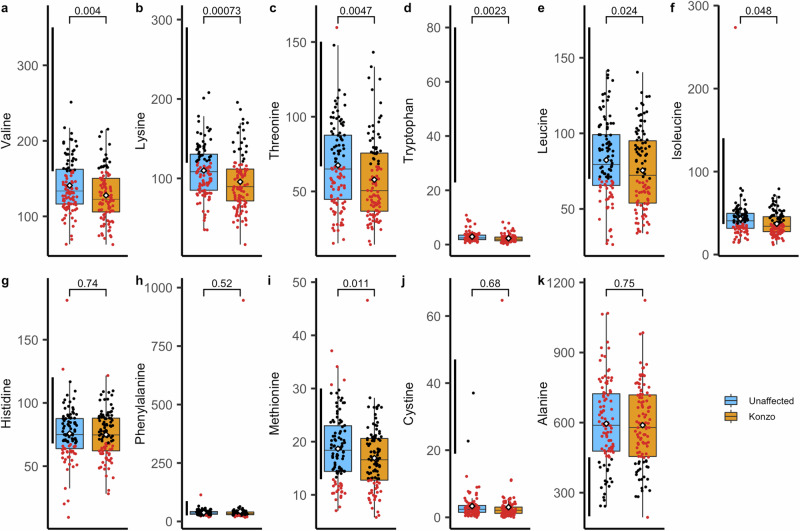
Konzo is a neglected paralytic neurological disease associated with food (cassava) poisoning that affects the world's poorest children and women of childbearing ages across regions of sub-Saharan Africa. Despite understanding the dietary factors that lead to konzo, the molecular markers and mechanisms that trigger this disease remain unknown. To identify potential protein biomarkers associated with a disease status, plasma was collected from two independent Congolese cohorts, a discovery cohort (n = 60) and validation cohort (n = 204), sampled 10 years apart and subjected to multiple high-throughput assays. We identified that Glutathione Peroxidase 3 (GPx3), a critical plasma-based antioxidant enzyme, was the sole protein examined that was both significantly and differentially abundant between affected and non-affected participants in both cohorts, with large reductions observed in those affected with konzo. Our findings raise the notion that reductions in key antioxidant mechanisms may be the biological risk factor for the development of konzo, particularly those mediated through pathways involving the glutathione peroxidase family.


Conflict of interest statement

The authors declare no competing interests.

Figures

Fig. 1
Fig. 1. Identification of potential biomarkers of Konzo disease in the discovery cohort.
Blood plasma proteome from 29 children affected with konzo (orange) and 31 unaffected (blue) were analyzed by untargeted and targeted LC-MS/MS analyses. A Principal component analysis from the untargeted analysis with ellipses drawn at the 95% confidence interval level for each group. B Untargeted analysis representation of log2 of protein intensity ratio versus -log10 of two-sided Welch t-test p-value. Significant proteins (Benjamini–Hochberg adjusted p-value and log2(fold-change) thresholds) are highlighted in blue when they were less expressed in konzo or in red when overexpressed in affected children. C Left: Untargeted analysis sparse partial least square discriminant analysis (sPLS-DA). Right: Top loadings of PC1 and PC2 are highlighted in bar plots where the weight of each variable contribution is represented along the x-axis. D Targeted analysis boxplots represented using log2 transformed intensities of some of the regulated proteins selected based on the results from the untargeted analysis sPLS-DA component 1 (n = 29 konzo individuals, n = 31 unaffected individuals). Two-sided paired Welch t-test p-values are represented above the plots. For each box, data is illustrated as follows: an inner line to represent the median, lower edge and upper edge for the 25th percentile and 75th percentile and whiskers extends from the hinges to either the highest or lowest value within a maximum of 1.5 times the interquartile range (IQR) from the hinge. Data points beyond the IQR are considered as outliers and represented as dots. Within the box plots, orange represents measures obtained from children affected with konzo and blue denotes measures obtained from their siblings who are unaffected with konzo.
Fig. 2
Fig. 2. GPx3 identified as the main konzo biomarker candidate in the validation cohort.
Plasma from unaffected children (blue) and their siblings with different stages of konzo disease (orange). A Untargeted analysis protein volcano plot for all stages combined or for each stage independently. Statistical significance of Glutathione Peroxidase 3 (GPx3) regulation was observed in all comparisons (two-sided paired Welch Benjamini–Hochberg adjusted p-value < 0.05) and a log2Fold change greater than 0.5 was observed for all groups except for Stage 1 comparisons. 204 samples were analyzed with 63 sibling pairs for stage 1, 11 pairs for stage 2 and 28 pairs for stage 3. B Left: Stage 3 sPLS-DA for the untargeted analysis. Right: Top protein contributors on component 1. C StringDB GPx3 interaction network of high confidence experimental interactors identified in the untargeted analysis. D Targeted analysis boxplot representation of log2 transformed protein intensities from the 3 monitored proteins (Glutathione Peroxidase 3 and SelenoProtein1) for each stage (K1/U1 for stage 1 with 62 sibling pairs, K2/U2 for stage 2 with 11 pairs and K3/U3 for stage 3 with 27 pairs). Two-sided paired Welch t-test p-values are represented above the plots. For each box, data is illustrated as follows: an inner line to represent the median, lower edge and upper edge for the 25th percentile and 75th percentile and whiskers extends from the hinges to either the highest or lowest value within a maximum of 1.5 times the interquartile range (IQR) from the hinge. Data points beyond the IQR are considered as outliers and represented as dots. Within the box plots, orange represents measures obtained from children affected with konzo and blue denotes measures obtained from their siblings who are unaffected with konzo.
Fig. 3
Fig. 3. Validating a decrease of GPx3 concentration in konzo affected children using ELISA.
A general distribution visualization and box plot representations of Glutathione Peroxidase 3 (GPx3) plasma concentration (ng/ml) as measured by human GPx3 ELISA for a Unaffected controls (Unaff Sib) by all konzo (Konzo Sib) stages combined (88 Unaffected, 88 Affected), b Sibling comparisons for Stage 1 konzo (48 Unaffected, 48 Affected), c Sibling comparisons for stage 2 konzo (11 Unaffected and 11 Affected), d Sibling comparisons for Stage 3 konzo (28 Unaffected, 28 Affected) and e Sibling comparisons for Stage 2 and 3 combined (39 Unaffected and 39 Affected). 95% confidence intervals are highlights in dashed lines with corresponding colors to distinguish the unaffected group or those affected with konzo. Statistical differences were calculated using a two-sided paired-t test of the average GPx3 concentration (ng/ml) of the duplicate runs for each sample for Stage 1, 2, and 3 and a T-test of the mean of each sample for unaffected by affected comparisons and for the comparison assessing stages 2 and 3 combined (A and e respectively). For each box, data is illustrated as follows: an inner line to represent the median, lower edge and upper edge for the 25th percentile and 75th percentile and whiskers extends from the hinges to either the highest or lowest value within a maximum of 1.5 times the interquartile range (IQR) from the hinge. Data points beyond the IQR are considered as outliers. The diamond within the box plots represents the data mean for that measure and data point measures can be found in the Data Source File.
Fig. 4
Fig. 4. HPLC plasma amino acid profiling of the validation sibling cohort.
Boxplot representations of unaffected (n = 102) and konzo affected (n = 102) children’s amino acids (µmol/L) that were most relevant to the study. Panel a displays Valine levels, b Lysine levels, c Threonine levels, d Tryptophan levels, e Leucine levels, f Isoleucine levels, g Histidine levels, h Phenylalanine levels, i Methionine levels, j Cystine levels and k Alanine levels. Black dots represent samples that fell within the normal range of the particular AA based on UCSF clinical core standards and red dots, represents samples that fell outside of the accepted normal values. Blue shaded box plots represent measures obtained from unaffected siblings while orange shaded box plots represents measures obtained from children affected with konzo. Statistical differences were based on a two-sided t-test outcomes of amino acid means for each sample and compared unaffected groups to affected individuals. For each box, data is illustrated as follows: an inner line to represent the median, lower edge and upper edge for the 25th percentile and 75th percentile and whiskers extends from the hinges to either the highest or lowest value within a maximum of 1.5 times the interquartile range (IQR) from the hinge. Data points beyond the IQR are considered as outliers. Data presented in Fig. 4 can be found in the Data Source File.

Similar articles

References

    1. Kashala-Abotnes, E. et al. Konzo: a distinct neurological disease associated with food (cassava) cyanogenic poisoning. Brain Res. Bull.145, 87–91 (2019). 10.1016/j.brainresbull.2018.07.001 - DOI - PMC - PubMed
    1. Mwanza, J. C., Tshala-Katumbay, D. & Tylleskär, T. Neuro-ophthalmologic manifestations of konzo. Environ. Toxicol. Pharm.19, 491–496 (2005).10.1016/j.etap.2004.12.012 - DOI - PubMed
    1. Boivin, M. J. et al. Neuropsychological effects of konzo: a neuromotor disease associated with poorly processed cassava. Pediatrics131, e1231–e1239 (2013). 10.1542/peds.2012-3011 - DOI - PMC - PubMed
    1. Tylleskär, T. et al. Epidemiological evidence from Zaire for a dietary etiology of konzo, an upper motor neuron disease. Bull. World Health Organ.69, 581–589 (1991). - PMC - PubMed
    1. Cliff, J. et al. Konzo and continuing cyanide intoxication from cassava in Mozambique. Food Chem. Toxicol.49, 631–635 (2011). 10.1016/j.fct.2010.06.056 - DOI - PubMed

Publication types