. 2024 Sep 6;15(1):7809.
doi: 10.1038/s41467-024-52155-2.

Recipient tissue microenvironment determines developmental path of intestinal innate lymphoid progenitors

Affiliations

Recipient tissue microenvironment determines developmental path of intestinal innate lymphoid progenitors

Paula A Clark et al. Nat Commun. .

Abstract

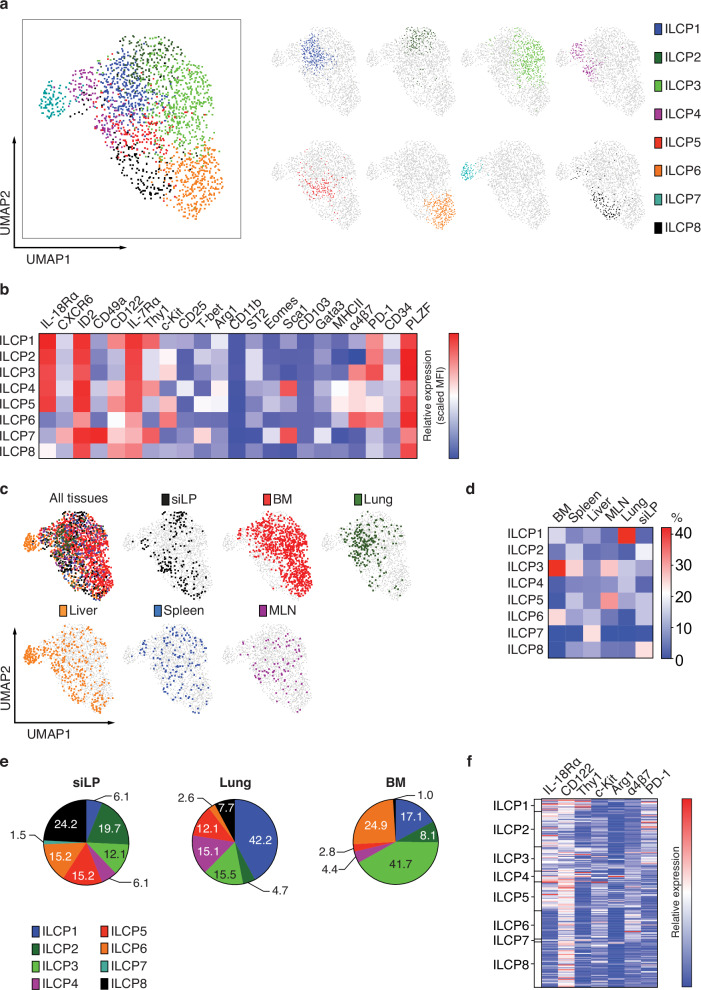
Innate lymphoid cells (ILCs) are critical in maintaining tissue homeostasis, and during infection and inflammation. Here we identify, by using combinatorial reporter mice, a rare ILC progenitor (ILCP) population, resident to the small intestinal lamina propria (siLP) in adult mice. Transfer of siLP-ILCP into recipients generates group 1 ILCs (including ILC1 and NK cells), ILC2s and ILC3s within the intestinal microenvironment, but almost exclusively group 1 ILCs in the liver, lung and spleen. Single cell gene expression analysis and high dimensional spectral cytometry analysis of the siLP-ILCPs and ILC progeny indicate that the phenotype of the group 1 ILC progeny is also influenced by the tissue microenvironment. Thus, a local pool of siLP-ILCP can contribute to pan-ILC generation in the intestinal microenvironment but has more restricted potential in other tissues, with a greater propensity than bone marrow-derived ILCPs to favour ILC1 and ILC3 production. Therefore, ILCP potential is influenced by both tissue of origin and the microenvironment during development. This may provide additional flexibility during the tuning of immune reactions.


Conflict of interest statement

The authors declare no competing interests.

Figures

Fig. 1
Fig. 1. Identification of ILCPs in adult mouse small intestine.
a Schematic representation of the generation of the four-colour reporter mouse (adapted from reference ). b Definition of siLP ILCs using surface marker and transcription factor fluorescent reporter expression. The ILCs were defined as CD45+lineageId2-BFP+IL-7Rα+ (Lineage = CD3, CD4, CD8, CD11b, CD11c, CD19, FcεR1, Ly6G/Ly6C, Ter119). Mature ILC1s, ILC2s and some ILC3s were excluded by the expression of KLRG1, NKp46 and NK1.1. ILC3s were further excluded by the expression of CCR6 and Rorγt-Katushka and the resulting mature marker negative population subdivided into PLZF+Bcl11b (P+B), PLZF+Bcl11b+ (P+B+), PLZFBcl11b+ (PB+) and PLZFBcl11b (PB) using the PLZF-Citrine and Bcl11b-tdTomato reporters. Numbers associated with boxes indicate the percentage of the parent population. c In vitro culture of four populations defined by PLZF and/or Bcl11b under neutral conditions (IL-7 and SCF). FACS sorting strategy shown in Supplementary Fig. 1. Each data point represents the expansion of all the cells of an indicated phenotype from a single mouse. Since the numbers of cells sorted and seeded varies considerably between populations and mice, this is expressed as population doublings. d Proportions of ILC progeny produced from PLZF+Bcl11b (P+B) cells. Supplementary Fig. 2 defines the phenotype of group 1 ILCs, ILC2-like and ILC3-like progeny. c,d Data are cumulative from 2 independent experiments involving a total of 9 mice. Data are plotted as mean with SEM error bars and significance calculated using one-way ANOVA with Tukey’s multiple comparisons test. e Proportion of IFNγ and perforin positive progeny of P+B cells. Data are cumulative from 2 independent experiments (7 mice total). The flow cytometry plot shows representative expression of these effectors. Numbers within the quadrants indicate the percentage of the parent population. Data are plotted as mean with SEM error bars. Source data are provided as a Source Data file.
Fig. 2
Fig. 2. siLP-ILCPs are tissue-resident.
a Representative flow cytometry plots showing ivCD45 labelling of ILCs (LiveCD45+lineageIL-7Rα+ lineage = CD3, CD4, CD8, CD11b, CD11c, CD19, FcεR1, Ly6G/Ly6C, Ter119) in the four tissues examined and ILCPs in the siLP only (LiveCD45+lineageIL-7Rα+NKp46NK1.1KLRG1CCR6Rorγt-KatushkaPLZF+Bcl11b). Numbers within the quadrants are the percentage of the parent gate. Gating strategy shown in Supplementary Fig. 4a. b Proportions of each population from each tissue which are ivCD45 positive or negative. Data are from 6 mice from one experiment and are representative of 3 independent experiments and plotted as mean with SEM error bars. Source data are provided as a Source Data file.
Fig. 3
Fig. 3. siLP-ILCPs repopulate liver, lung and spleen with group 1 ILCs.
a Representative flow cytometry plots defining the cell surface and reporter phenotype of donor progeny in the three tissues indicated. (Lineage = CD3, CD4, CD8, CD19, Ter119). Numbers within plots are the percentage of the parent gate. Gating strategy to define lineage negative progeny is shown in Supplementary Fig. 5a and definition of NKp46 positive and negative populations in Supplementary Fig. 5b. b Representative flow cytometry plots defining the phenotype of donor progeny in the three tissues indicated with respect to expression of the transcription factor Eomes. Numbers within quadrants are the percentage of the parent gate. Gating strategy for Rorγt-KatIL7Rα as for (a). Definition of positive and negative populations for NK1.1 and Eomes is shown in Supplementary Fig. 5c,d. c Representative flow cytometry plots of the expression of perforin and IFNγ by NK1.1+IL-7Rα progeny from the indicated recipient mouse tissues, following 24-hour stimulation with IL-2/IL-15/IL-18. Gating strategy for donor progeny is shown in Supplementary Fig. 5a. Numbers in quadrants are percentages of parent gate. d Quantification of perforin and IFNγ production by progeny. Data are cumulative from 8 recipient mice analysed over 3 independent experiments and plotted as mean with SEM error bars. e In vitro cytotoxic activity of progeny isolated from recipient livers. Cytotoxic activity was measured as area of dead B16F10 cells and compared to the activity of wildtype (WT) splenic NK cells (positive control, magenta lines) and CD4+ T cells (negative control, blue lines). Orange lines show the activity of the siLP-ILCP progeny from the liver from 3 individual mice analysed in one experiment and are representative of 2 independent experiments. *p-values are as follows: 54.4hrs = 0.0383, 56.4 h = 0.0403, 58.4 h = 0.0291, 60.4 h = 0.0148, 62.4 h = 0.0235, 70.4 h = 0.0122, **p-values are as follows: 66.4 h = 0.0072, 68.4 h = 0.0064, 72.4 h = 0.0079, 74.4 h = 0.0054, 76.4 h = 0.0085, when comparing the average killing activity of the liver progeny cells from the 3 mice to the average of the negative control CD4+ T cells (2-way ANOVA with Šídák’s multiple comparisons test). Source data are provided as a Source Data file.
Fig. 4
Fig. 4. siLP-ILCPs generate group 1 ILCs, ILC2s and ILC3s in the small intestine.
a Representative flow cytometry plots defining the cell surface and reporter phenotype of donor progeny in the siLP of recipients. (Lineage = CD3, CD4, CD8, CD19, Ter119). Numbers within gates are the percentage of the parent gate. The gating strategy to define lineage-negative progeny is shown in Supplementary Fig. 5a. b Quantification of the proportions of progeny in each tissue of each phenotype defined by surface markers and reporters. Group 1 ILCs are defined as CD45.2+Id2-BFP+lineageRorγt-KatushkaIL-7RαNKp46+NK1.1+ (red), ILC2-like are defined as CD45.2+Id2-BFP+lineageRorγt-KatushkaIL-7Rα+NKp46NK1.1Bcl11bhiPLZF (blue), NCR+ILC3-like are defined as CD45.2+Id2-BFP+lineageRorγt-Katushka+IL-7Rα+NKp46+NK1.1 (green), NCRILC3-like are defined as CD45.2+Id2-BFP+lineageRorγt-Katushka+IL-7Rα+NKp46NK1.1 (yellow) with an additional population defined as CD45.2+Id2-BFP+lineageRorγt-Katushka+IL-7Rα (purple). Data are cumulative from 5 independent experiments involving a total of 8 (lung, liver, spleen) or 13 (siLP) recipient mice and plotted as mean with SEM error bars. c Analysis of the statistical significance between the proportions of the progeny populations in the siLP compared with those in the liver, lung and spleen (one-way ANOVA with Tukey’s multiple comparisons test). Data are cumulative from 5 independent experiments involving a total of 8 (lung, liver, spleen) or 13 (siLP) mice and plotted as mean with SEM error bars. d Comparison of the in vivo progeny phenotypes of BM-ILCPs and siLP-ILCPs in the lung and siLP of recipients. ILC progeny defined as Live CD45.2+Id2-BFP+ lineage negative. Group 1 ILC defined as NK1.1+Rorγt, ILC2-like defined as NK1.1RorγtBcl11b-tdTomato+PLZF-Citrine, ILC3-like NK1.1Rorγt+. Data is pooled from 2 independent experiments where n = 9 recipients of BM-ILCPs (male and female of 8 to 22 weeks of age) and 5 recipients of siLP-ILCPs (male and female of 11 to 22 weeks of age). Data is plotted as mean with SEM error bars and significance calculated by a two-way unpaired t-test with Welch’s correction when required. Source data are provided as a Source Data file.
Fig. 5
Fig. 5. scRNA-seq analysis identifies discrete siLP-ILCPs and ILC progeny.
a UMAP plot of single cell gene expression analysis of siLP-ILCPs, and siLP and lung progeny (4399 individual cells) purified from sublethally irradiated Rag2–/–Il2rg–/– recipients of adoptive transfer of siLP-ILCPs. A small number (334 cells) of lung progeny from aceNKP adoptive transfer was also sampled for comparison (GSE213814). b Heatmap of the top 25 genes differentially expressed in siLP progeny clusters defined in (a). Previously reported signature genes of group 1, 2 and 3 ILCs are highlighted in red, blue and green respectively. c Heatmap of the expression of the top 25 genes differentially expressed by the siLP progeny and the siLP-ILCP progenitors. Log expression is shown normalised by column. Columns represent 374 individual siLP-ILCP cells (highlighted in grey) and 3425 siLP progeny cells from cluster 1, 2 and 3 (highlighted in blue) rows represent the different genes. d UMAP plot with expression level (log2 expression) of key differentially expressed genes per individual cell.
Fig. 6
Fig. 6. scRNAseq analysis places siLP-ILCP group 1 ILC progeny in the lung and siLP on a phenotypic continuum.
a Heatmap of the relative expression of published NK cell (highlighted in red) and ILC1 (highlighted in orange) signature genes of the siLP and lung group 1 ILC progeny clusters of the siLP-ILCPs. b Heatmap of the expression of published NK cell (highlighted in red) and ILC1 (highlighted in orange) signature genes of the siLP and lung group 1 ILC progeny. Log expression is shown normalised by column. Columns represent 1247 individual siLP group 1 ILC progeny (highlighted in blue) and 673 lung group 1 ILC progeny (highlighted in purple) rows represent the different genes.
Fig. 7
Fig. 7. High-dimensional spectral flow cytometry analysis of siLP-ILCP group 1 ILC progeny from several tissues.
a Uniform manifold approximation and projection (UMAP) visualisation of in vivo derived progeny coloured by cluster. b Heatmap of expression of the indicated ILC1/NK cell markers within the identified clusters. Colour represents maximum-normalised mean intensity expression of the indicated proteins within each cluster. The relative MFI depicted is a function of both proportion of cells expressing each marker and the protein level of the positive cells within each cluster. c UMAP visualisation of in vivo derived progeny coloured by tissue location. d Proportion of each identified group 1 ILC cluster within siLP and lung. Data shown is pooled from two independent experiments (5 animals/tissue in total). Source data are provided as a Source Data file.
Fig. 8
Fig. 8. scRNA-seq analysis of siLP-ILCPs shows commonalities with BM-ILCPs and a distinct gene signature from their progeny.
a Violin plots with expression (log2 expression) of indicated genes in Progenitor (375 cells), Group1 ILC (1250 cells), ILC2 (622 cells) and ILC3 (1580 cells) cell populations. Rectangle, solid line, and dashed line represent the interquartile range, the median and the mean, respectively. b Heatmap of expression of genes that distinguish the siLP-ILCP progenitors from their progeny in the siLP. c UMAP plot with expression level (log2 expression) of indicated genes per individual cell.
Fig. 9
Fig. 9. High-dimensional spectral flow cytometry analysis of CD45+lineageId2-BFP+IL-7Rα+NK1.1NKp46KLRG1Rorγt-KatushkaCCR6PLZF+Bcl11b cells from siLP, BM, spleen, liver, MLN and lung.
Gating strategy for CD45+lineageId2-BFP+IL-7Rα+NK1.1NKp46KLRG1Rorγt-KatushkaCCR6PLZF+Bcl11b cells shown in Supplementary Fig. 12a. a Uniform manifold approximation and projection (UMAP) visualisation coloured by identified subclusters. b Heatmap of expression of the indicated markers within the subclusters from (a) Colour represents maximum-normalised mean intensity expression of the indicated proteins within each cluster. The relative MFI depicted is a function of both proportion of cells expressing each marker and the protein level of the positive cells within each cluster. c UMAP visualisation of siLP-ILCP-like cells coloured by tissue of origin. The first UMAP combines cells from all tissues, each with a different colour, and subsequent UMAPs separate the cells from each tissue and map them onto this UMAP (in grey in the background) to give a representation of their distribution across the UMAP. d Heatmap indicating the proportion of each identified siLP-ILCP-like cell cluster within each tissue. e Proportion of each identified siLP-ILCP-like cell cluster within siLP, lung and bone marrow. Data shown from one experiment (6 animals/tissue). Source data are provided as a Source Data file. f Heatmap of marker expression depicted per individual cell within siLP-ILCPs (198 cells). Colour represents normalised mean intensity expression of the indicated proteins.

References

    1. Colonna, M. Innate lymphoid cells: diversity, plasticity, and unique functions in immunity. Immunity48, 1104–1117 (2018). 10.1016/j.immuni.2018.05.013 - DOI - PMC - PubMed
    1. Eberl, G., Colonna, M., Di Santo, J. P. & McKenzie, A. N. Innate lymphoid cells. innate lymphoid cells: a new paradigm in immunology. Science348, aaa6566 (2015). 10.1126/science.aaa6566 - DOI - PMC - PubMed
    1. Vivier, E. et al. Innate lymphoid cells: 10 years on. Cell174, 1054–1066 (2018). 10.1016/j.cell.2018.07.017 - DOI - PubMed
    1. Xu, W. et al. An Id2(RFP)-reporter mouse redefines innate lymphoid cell precursor potentials. Immunity50, 1054–1068.e1053 (2019). 10.1016/j.immuni.2019.02.022 - DOI - PMC - PubMed
    1. Walker, J. A. et al. Polychromic reporter mice reveal unappreciated innate lymphoid cell progenitor heterogeneity and elusive ilc3 progenitors in bone marrow. Immunity51, 104–118.e107 (2019). 10.1016/j.immuni.2019.05.002 - DOI - PMC - PubMed

Publication types

Associated data