. 2024 Sep 7;15(1):7822.
doi: 10.1038/s41467-024-52191-y.

Cell swelling enhances ligand-driven β-adrenergic signaling

Affiliations

Cell swelling enhances ligand-driven β-adrenergic signaling

Alexei Sirbu et al. Nat Commun. .

Abstract

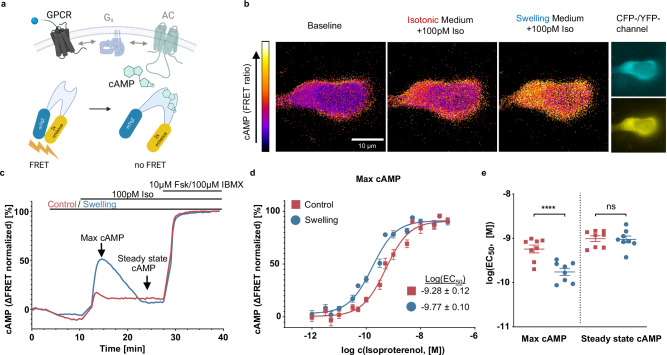
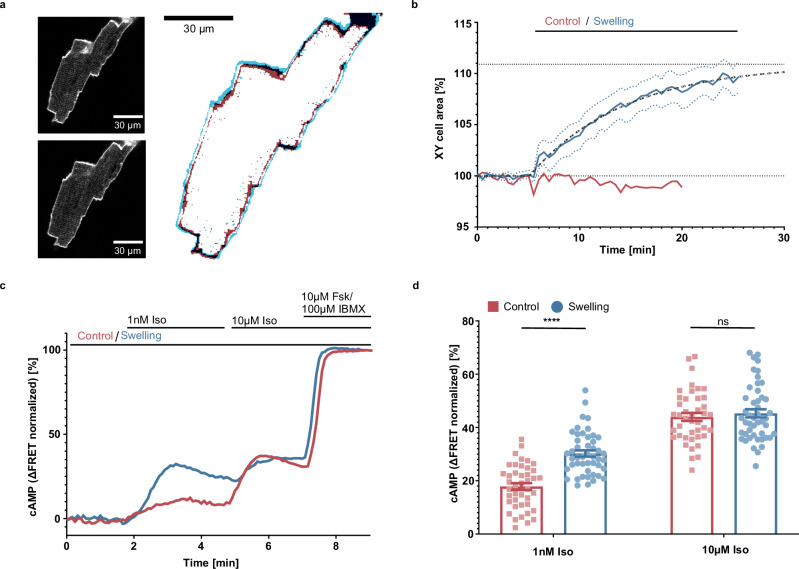
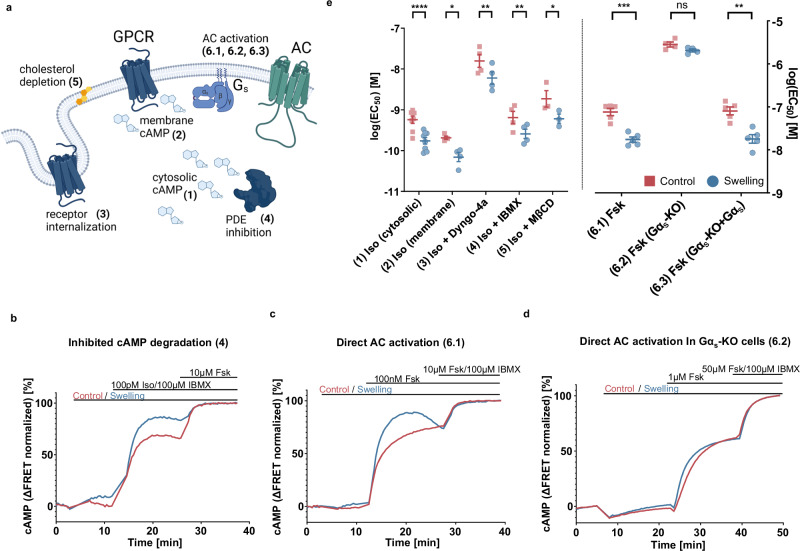
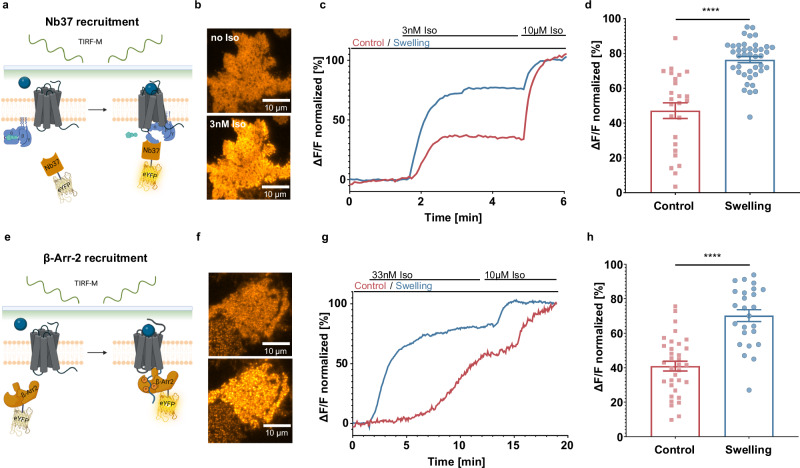
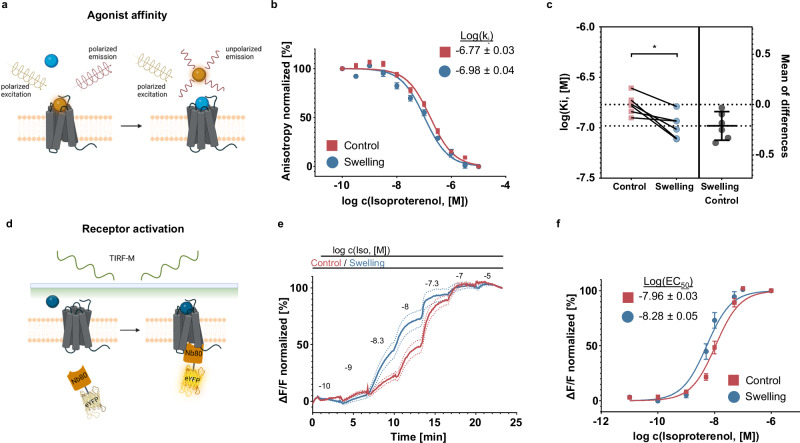
G protein-coupled receptors' conformational landscape can be affected by their local, microscopic interactions within the cell plasma membrane. We employ here a pleiotropic stimulus, namely osmotic swelling, to alter the cortical environment within intact cells and monitor the response in terms of receptor function and downstream signaling. We observe that in osmotically swollen cells the β2-adrenergic receptor, a prototypical GPCR, favors an active conformation, resulting in cAMP transient responses to adrenergic stimulation that have increased amplitude. The results are validated in primary cell types such as adult cardiomyocytes, a model system where swelling occurs upon ischemia-reperfusion injury. Our results suggest that receptors' function is finely modulated by their biophysical context, and specifically that osmotic swelling acts as a potentiator of downstream signaling, not only for the β2-adrenergic receptor, but also for other receptors, hinting at a more general regulatory mechanism.


Conflict of interest statement

The authors declare no competing interests.

Figures

Fig. 1
Fig. 1. Cell swelling increases β-adrenergic-mediated cAMP production in HEK293 cells.
a Schematics of GPCR-mediated cAMP production and its detection by a FRET biosensor (panel a created with BioRender.com released under a Creative Commons Attribution-NonCommercial-NoDerivs 4.0 International license: https://creativecommons.org/licenses/by-nc-nd/4.0/deed.en); b representative (out of 3 independent experiments) images of a HEK293 cell stably expressing cytosolic Epac-SH187  showing acceptor/donor ratio in false color; the cells are exposed to 100 pM isoproterenol first in isotonic (300 mOsm) and subsequently in swelling medium (200 mOsm); c representative curve (out of 8 independent experiments) showing kinetics of acceptor/donor ratio measured in HEK293 cells stably expressing Epac-SH187 in a microplate reader (normalized to baseline and 10 µM forskolin + 100 µM IBMX); d averaged concentration response curves representing maximal cAMP concentrations, as indicated in (c) (mean ± SEM; n = 8 plates form 7 independent experiments); e log(EC50) values from individual experiments comparing swelling and control condition for maximal and steady state cAMP concentrations (mean ± SEM; n = 8 plates form 7 independent experiments; paired two-tailed t-test; p values: <0.0001 (Max cAMP), 0.7827 (Steady state cAMP). Source data are provided as a Source Data file.
Fig. 2
Fig. 2. Cell swelling increases β-adrenergic mediated cAMP production in adult mouse ventricular cardiomyocytes (CM).
a Representative confocal images (out of 6 cells from 3 independent experiments) of CM under isotonic conditions (upper inset) and after 20 minutes of exposure to swelling medium (lower inset), with an overlay of cell edges under both conditions (main); b average curve showing the area of a confocal CM slice (mean ± SEM; n = 6 cells from 3 independent experiments); c representative curve (out of 3 independent experiments) showing kinetics of acceptor/donor ratio measured in CM stably expressing Epac1-camps under an epifluorescence microscope (normalized to baseline and 10 μM forskolin + 100 μM IBMX); d maximal cAMP concentrations reached upon stimulation with 1 nM and 10 μM Iso respectively, normalized to 10 μM forskolin + 100 μM IBMX (mean ± SEM; n = 42 (control) and 47 (swelling) cells from 3 independent experiments; unpaired two-tailed t-test; p values: <0.0001 (1 nM Iso), 0.5359 (10 µM Iso)). Source data are provided as a Source Data file.
Fig. 3
Fig. 3. Impact of cell swelling on the molecular steps of the β-adrenergic signaling cascade.
a Schematics of key steps of the signaling cascade that may be affected by swelling and were assessed under following conditions: (1) cytosolic cAMP upon Iso stimulation, (2) local cAMP at the plasma membrane upon Iso stimulation measured with an Epac1-Camps-CAAX sensor, (3) cytosolic cAMP measured upon Iso stimulation after treatment with 10 μM Dyngo-4a for 30 min, (4) cytosolic cAMP measured upon Iso stimulation with simultaneous addition of 100 μM IBMX, (5) cytosolic cAMP measured upon Iso stimulation under cholesterol depletion after incubation for 30 minutes with 10 mM methyl-β-cyclodextrine, (6) cytosolic cAMP measured upon Fsk stimulation in wt Gαs phenotype (6.1), Gαs-KO cells (6.2), and Gαs-KO cells transiently transfected with Gαs (6.3) (panel a created with BioRender.com released under a Creative Commons Attribution-NonCommercial-NoDerivs 4.0 International license: https://creativecommons.org/licenses/by-nc-nd/4.0/deed.en); bd representative kinetic cAMP concentration curves (n numbers listed below) obtained under respective conditions described in a; e log(EC50) values from individual experiments comparing swelling and control condition for maximal cAMP concentrations under conditions listed in a (mean ± SEM, n(1) = 8, n(2) = 4, n(3) = 4, n(4) = 4, n(5) = 3, n(6.1) = 5, n(6.2) = 4, n(6.3) = 5 independent experiments; paired two-tailed t-test; p values: <0.0001 (1), 0.0212 (2), 0.0026 (3), 0.0022 (4), 0.0478 (5), 0.0002 (6.1), 0.081 (6.2), and 0.0036 (6.3)). Source data are provided as a Source Data file.
Fig. 4
Fig. 4. Swelling leads to an increased effector recruitment.
a Gs activation by the β2-AR is monitored by recruitment of the fluorescently tagged nanobody 37 (Nb37) at the plasma membrane of the cell together with overexpression of heterotrimeric Gs (panel a created with BioRender.com released under a Creative Commons Attribution-NonCommercial-NoDerivs 4.0 International license: https://creativecommons.org/licenses/by-nc-nd/4.0/deed.en); b representative (of n = 25 (control) and 41 (swelling) cells from 3 independent experiments) TIRF-M images of Nb37-eYFP expressed in HEK293-AD cells before and after application of 3 nM isoproterenol; c representative curve showing relative increase of membrane fluorescence collected as first 3 nM, and then at saturating 10 µM concentration of isoproterenol is added to the cell (normalized to baseline and 10 µM Iso response); d relative fluorescence increase measured upon Nb37-eYFP recruitment upon 3 nM isoproterenol stimulation in swollen vs non-swollen cells (mean ± SEM; n = 25 (control) and 41 (swelling) cells from 3 independent experiments; unpaired two-tailed t-test, p value < 0.0001); e recruitment of fluorescently tagged β-Arrestin-2 (β-Arr-2) by the β2-AR is monitored by its recruitment to the plasma membrane of the cell (panel e created with BioRender.com released under a Creative Commons Attribution-NonCommercial-NoDerivs 4.0 International license); f representative (of n = 34 (control) and 25 (swelling) cells from 3 independent experiments) TIRF-M images of βArr-2-eYFP expressed in HEK293-AD cells before and after application of 33 nM isoproterenol; g representative curve showing relative increase of membrane fluorescence collected as first 33 nM, and then at saturating 10 µM concentration of isoproterenol is added to the cell (normalized to baseline and 10 µM Iso response); h relative fluorescence increase measured upon β-Arr-2-eYFP recruitment upon 33 nM isoproterenol stimulation in swollen vs non-swollen cells (mean ± SEM; n = 34 (control) and 25 (swelling) cells from 3 independent experiments; unpaired two-tailed t-test; p value < 0.0001). Source data are provided as a Source Data file.
Fig. 5
Fig. 5. Swelling favors an active receptor conformation.
a Ligand binding affinity is determined by employing a fluorescently labeled ligand and measuring the degree of fluorescence anisotropy (panel a created with BioRender.com released under a Creative Commons Attribution-NonCommercial-NoDerivs 4.0 International license: https://creativecommons.org/licenses/by-nc-nd/4.0/deed.en); b average curve of increasing concentrations of isoproterenol displacing 2 nM of fluorescently labeled JE1319 from the β2-AR in swollen and non-swollen cells with the corresponding log(Ki) values; c pairwise comparison of log(Ki) values obtained from single experiments and the average of the difference overlay (for b and c - mean ± SEM; n = 6 plates from 5 independent experiments; paired two-tailed t-test; p value 0.012); d conformational activation of the β2-AR is monitored by recruitment at the plasma membrane of the cell by employing the fluorescently tagged nanobody 80 (Nb80) (panel d created with Biorender.com released under a Creative Commons Attribution-NonCommercial-NoDerivs 4.0 International license: https://creativecommons.org/licenses/by-nc-nd/4.0/deed.en); e averaged time-sequence of the relative increase of membrane fluorescence collected as increasing concentrations of Iso are added to the cells (normalized to baseline and 10 μM Iso response); f the resulting averaged concentration response curves for cells in isotonic and swelling media and associated log(EC50) values (for e and f - mean ± SEM; n = 46 (control) and 45 (swelling) cells from 5 independent experiments). Source data are provided as a Source Data file.

References

    1. De Lean, A., Stadel, J. M. & Lefkowitz, R. J. A ternary complex model explains the agonist-specific binding properties of the adenylate cyclase-coupled beta-adrenergic receptor. J. Biol. Chem.255, 7108–7117 (1980). 10.1016/S0021-9258(20)79672-9 - DOI - PubMed
    1. Shukla, A. K., Singh, G. & Ghosh, E. Emerging structural insights into biased GPCR signaling. Trends Biochem. Sci.39, 594–602 (2014). 10.1016/j.tibs.2014.10.001 - DOI - PubMed
    1. Leach, K., Sexton, P. M. & Christopoulos, A. Allosteric GPCR modulators: taking advantage of permissive receptor pharmacology. Trends Pharmacol. Sci.28, 382–389 (2007). 10.1016/j.tips.2007.06.004 - DOI - PubMed
    1. Hay, D. L., Poyner, D. R. & Sexton, P. M. GPCR modulation by RAMPs. Pharmacol. Ther.109, 173–197 (2006). 10.1016/j.pharmthera.2005.06.015 - DOI - PubMed
    1. Oates, J. & Watts, A. Uncovering the intimate relationship between lipids, cholesterol and GPCR activation. Curr. Opin. Struct. Biol.21, 802–807 (2011). 10.1016/j.sbi.2011.09.007 - DOI - PubMed

Publication types

LinkOut - more resources