. 2024 Sep 6;15(1):7797.
doi: 10.1038/s41467-024-52189-6.

Hyper-recombination in ribosomal DNA is driven by long-range resection-independent RAD51 accumulation

Affiliations

Hyper-recombination in ribosomal DNA is driven by long-range resection-independent RAD51 accumulation

Zita Gál et al. Nat Commun. .

Abstract

Ribosomal DNA (rDNA) encodes the ribosomal RNA genes and represents an intrinsically unstable genomic region. However, the underlying mechanisms and implications for genome integrity remain elusive. Here, we use Bloom syndrome (BS), a rare genetic disease characterized by DNA repair defects and hyper-unstable rDNA, as a model to investigate the mechanisms leading to rDNA instability. We find that in Bloom helicase (BLM) proficient cells, the homologous recombination (HR) pathway in rDNA resembles that in nuclear chromatin; it is initiated by resection, replication protein A (RPA) loading and BRCA2-dependent RAD51 filament formation. However, BLM deficiency compromises RPA-loading and BRCA1/2 recruitment to rDNA, but not RAD51 accumulation. RAD51 accumulates at rDNA despite depletion of long-range resection nucleases and rDNA damage results in micronuclei when BLM is absent. In summary, our findings indicate that rDNA is permissive to RAD51 accumulation in the absence of BLM, leading to micronucleation and potentially global genomic instability.


Conflict of interest statement

The authors declare no competing interests.

Figures
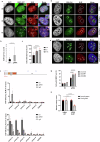
Fig. 1
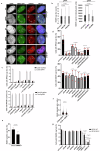
Fig. 1. BLM is recruited to rDNA DSBs and BLM depletion augments the n-DDR response.
a Time course of BLM recruitment. U2OS-Cas9 NBS1-GFP cells treated with rDNA gRNA plasmids and stained with BLM antibody 0-3-6 h after gRNA transfection. Scale bar 10 μm. b QIBC quantification of BLM cap foci number per cell 6 h after transfection with EV or gRNA plasmids. The graph depicts one representative out of three biological replicates (n = 341,162 cells/condition/experiment). Box limits indicate the central 50% with the horizontal line marking the mean value. Points more than 1.5 times the inter-quartile range outside the box are plotted as outliers (dots), while whiskers cover the remaining points. For statistical analysis a binomial distribution model was applied. c Cell cycle distribution of cells with BLM cap foci. Cells were treated as in b, and the cell cycle distribution of cells with at least one BLM cap foci was analyzed by QIBC. The graph depicts mean values +/−SEM. (n = 113, 44, 63 (G1); 46, 14, 31 (S); 61, 28, 68 (G2) cells/condition/experiment). Statistical analysis was done using a Poisson distribution model. d BLM recruitment to rDNA breaks upon I-PpoI nuclease induction in HT1080 cells. Scale bar 10 μm. e BLM recruitment to rDNA breaks upon Cas9-Scaffold/gRNA RNP transfection in Hela cells. Scale bar 10 μm. f BLM recruitment to the rDNA repeat analyzed by ChIP in U2OS-Cas9 cells. The gRNA1 cut site and the position of the amplified regions are indicated. RNA pol I ChIP was used as a control. The graph depicts mean values +/−SEM. g Percentage of cells displaying at least one NBS1 cap foci. U2OS-Cas9 cells were treated with siRNA for 24 h and subsequently transfected with EV or gRNA plasmids for 6 h. The graph depicts mean values +/−SEM (n = 291, 266 (EV,siCon); 351, 324 (EV, siBLM1); 251, 323 (EV, siBLM2); 210, 198, 315 (gRNA, siCon); 193, 193, 211 (gRNA, siBLM1); 195, 207, 272 (gRNA, siBLM2) cells/condition/experiment). Two biological replicates for EV samples. For statistical analysis of the gRNA treated samples, one-way Anova was applied. h Quantification of colony survival assay of U2OS WT and BLM−/− cells. Values are normalized to the Cas9-Scaffold RNP treated controls. The graph depicts mean values +/−SEM. Red dots indicate technical replicates from three biological replicates (n = 361, 347, 320 (WT, EV); 238, 180, 297 (BLM−/−, EV); 395, 239, 374(WT, gRNA); 111, 81, 151(BLM−/−, gRNA) colonies/condition/experiment). For statistical analysis, one-way Anova was applied. Source data are provided as a Source Data file for panels b, c, f, g and h. Statistical significance is depicted with p-values. Three biological replicates unless specifically stated (QIBC quantitative image-based cytometry, EV empty vector).
Fig. 2
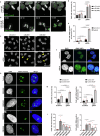
Fig. 2. BLM promotes resection in nucleolar caps.
a RPA32 recruitment to nucleolar caps. U2OS-Cas9 cells were treated with siRNAs for 24 h and subsequently transfected with gRNA plasmids for 6 h, and immunostained with antibody against RPA32. b Quantification of cells with at least one RPA32 cap focus after depletion of resection factors. Cells were treated as in a. The graph depicts mean values +/−SEM. Three biological replicates (two in case of EXO1) (n-values in source data file). For statistical analysis, data was square root transformed and analyzed with one-way Anova. c BRCA1 recruitment to nucleolar caps. Cells were treated as in a and immunostained with antibody against BRCA1. d Quantification of cells treated with gRNA from c. Left panel: quantification of BRCA1 cap foci number per cell (n = 120, 151, 191 cells/condition). Right panel: quantification of BRCA1 cap foci intensity (n = 287, 276, 271 cells/condition). The graphs show one representative experiment. Box limits indicate the central 50% with the horizontal line marking the mean value. Points more than 1.5 times the inter-quartile range outside the box are plotted as outliers (dots), while whiskers cover the remaining points. For statistical analysis a Poisson distribution model was used (left panel) or data were square root transformed (right panel) and analyzed with one-way Anova. e BRCA2 recruitment to nucleolar caps. U2OS-Cas9 cells were treated as in a, and immunostained with antibody against BRCA2. f Quantification of cells with at least one BRCA2 positive cap focus. Cells were treated as in e. The graph depicts mean values +/−SEM (n = 90, 105, 104 (siCon); 88, 102, 101 (siBLM1); 99, 111, 116 (siBLM2) cells/condition/experiment). For statistical analysis, one-way Anova was applied. Scale bars 10 μm. Source data are provided as a Source Data file for panels b, d and f. Three biological replicates unless specifically stated. Statistical significance is depicted with p-values. (EV: empty vector).
Fig. 3
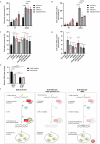
Fig. 3. RAD51 recruitment to rDNA is independent of long-range resection factors.
a RAD51 recruitment to nucleolar caps. U2OS-Cas9 cells were treated with siRNA for 24 h, transfected with EV or gRNA plasmids for 6 h, and immunostained with antibody against RAD51. Scale bar 10 μm. b Left panel: quantification of RAD51 cap foci number per cell (n = 102, 86, 117 cells/condition). Right panel: quantification of RAD51 cap foci intensity (n = 167, 116, 154/condition). Cells were treated as in a. The graphs show one representative biological replicate. Box limits indicate the central 50% with the horizontal line marking the mean value. Points more than 1.5 times the inter-quartile range outside the box are plotted as outliers (dots), while whiskers cover the remaining points. For statistical analysis a Poisson distribution model was used (left panel) or data were square root transformed (right panel) and analyzed with one-way Anova. c Recruitment of RPA32 (upper panel) and RAD51 (lower panel) in gRNA treated BLM−/− cells reconstituted with GFP-BLM WT or mutants. Cells were transfected with plasmids (48 h) and rDNA damage was induced by Cas9-gRNA RNP transfection for 6 h. The graphs depict mean values +/−SEM (n-values in source data file). d Quantification of RPA32 (upper panel) and RAD51 (lower panel) recruitment after depletions of resection factors. Cells were treated as in a and immunostained with antibodies against RPA32 and RAD51. The graphs depict mean values +/−SEM (n-values in source data file). For statistical analysis data were log transformed and analyzed with one-way Anova. e Recruitment of RAD51 in Cas9-gRNA treated BLM−/− cells after MRE11 depletion (60 h), Cas9-gRNAs (8 h), and immunostaining with antibodies against RAD51. The graphs depict RAD51 positive nucleolar caps (n = 129 cells/condition/experiment). For statistical analysis, one-way Anova was applied. f Measurement of ssDNA in nucleolar caps by BrdU detection. U2OS WT or BLM−/− cells were grown in 10 µM BrdU for 24 h prior to Cas9-gRNA treatment for 8 h (n = 1074, 1613, 2007 (WT, gRNA); 911, 1274, 1202 (BLM−/−, gRNA) foci/condition/experiment). Data are presented as individual values with a horizontal line marking the mean. The graphs show one representative biological replicate. For statistical analysis data were log transformed and one-way Anova was applied. g Recruitment of RAD51 in gRNA treated WT or BLM−/− cells after depletion with indicated siRNAs. Cells were treated with siRNA for 24 h and subsequently transfected with Cas9-gRNA for 6 h, and immunostained with antibodies against RAD51. The graphs depict mean values +/−SEM (n-values in source data file). For statistical analysis data were log transformed to get normal distribution and were analyzed with one-way Anova. Source data are provided as a Source Data file for panels bg. Three biological replicates unless stated. Statistical significance is depicted with p-values.
Fig. 4
Fig. 4. BLM depletion induces rDNA driven micronucleation.
a, b Snapshots from live cell imaging of mitotic U2OS WT and BLM−/− cells endogenously expressing GFP-Treacle used as a marker of rDNA and transfected with H2B-RFP adenovirus plasmid to visualize DNA. Cells were treated with Cas9-gRNA RNPs. Scale bar 10 μm. c Analysis of micronuclei formation. U2OS-Cas9 cells were treated with siRNA for 24 h and subsequently transfected with EV or gRNA plasmids. Cells were then treated with cytochalasin B for 24 h, stained with DAPI and imaged with confocal microscopy. Arrows indicate micronuclei. Scale bar 60 μm. d Quantification of micronuclei in bi-nucleated cells from c. The graph depicts mean values +/−SEM (n-values in source data file). For statistical analysis, one-way Anova was applied. e Quantification of UBF positive micronuclei. Cells were treated as in c, and immunostained with UBF antibody to visualize rDNA. The graph depicts mean values +/−SEM (n-values in source data file). For statistical analysis data were square root transformed to get normal distribution and were analyzed with one-way Anova. f Representative images of UBF positive and negative micronuclei from cells in e. Scale bar 10 μm. g Quantification of micronuclei (left panel) and rDNA (visualized by UBF) containing micronuclei (right panel) in U2OS WT and BLM−/− cells 6 h after rDNA damage was induced by Cas9-gRNA RNP transfection. The graphs depict mean values +/− SEM (n-values in source data file). For statistical analysis data were square root transformed (left panel) or not transformed (right panel) to get normal distribution and were analyzed with one-way Anova. h Representative images of micronuclei in BS patient cells (GM08505, GM03402, GM02932, GM02548) and control fibroblast (GM08402) during normal proliferation. Cells were immunostained with Treacle antibody to visualize rDNA. Scale bar 10 μm. i Quantification of micronuclei (left panel) and rDNA (Treacle) containing micronuclei (right panel) in BS patient cells upon normal cell proliferation. The graphs depict mean values +/−SEM (n-values in source data file). Five biological replicates. For statistical analysis data were log transformed (left panel) and square root transformed (right panel) and were analyzed with one-way Anova. Source data are provided as a Source Data file for panels d, e, g and i. Three biological replicates unless stated. Statistical significance is depicted with p-values. (EV: empty vector).
Fig. 5
Fig. 5. rDNA driven micronucleation is dependent on RAD51 and the BTRR-complex.
a Quantification of micronuclei in bi-nucleated cells upon depletion of BLM, RAD51, or BLM/RAD51. U2OS-Cas9 cells were treated with siRNA for 24 h and with EV/gRNA plasmids (6 h). Cells were then treated with cytochalasin B for 24 h and stained with DAPI. The graph depicts mean values +/−SEM (n-values in source data file). For statistical analysis data were square root transformed and were analyzed with one-way Anova. b Quantification of rDNA positive micronuclei as in a combined with UBF staining. The graph depicts mean values +/−SEM (n-values in source data file). For statistical analysis data were square root transformed and were analyzed with one-way Anova. c Quantification of micronuclei in bi-nucleated cells upon depletion of the BTRR complex and transfected with gRNA plasmids. Cells were treated as in a. The graph depicts mean values +/−SEM (n-values in source data file). Four biological replicates. For statistical analysis data were log transformed and analyzed with one-way Anova. d Quantification of rDNA (UBF) positive micronuclei in cells from c. The graph depicts mean values +/−SEM (n-values in source data file). For statistical analysis data were square root transformed and analyzed with one-way Anova. e rDNA copy number quantified in U2OS WT and BLM−/− cells using ddPCR. Cells were treated with control or rDNA gRNA for 6 h followed by 72 h of recovery prior to DNA extraction. The graphs depict mean values +/−SEM (n = 3). For statistical analysis data were log transformed and analyzed with one-way Anova. f Proposed model for the role of BLM in rDNA instability. Left panel: in BLM proficient conditions, BLM promoted resection takes place after DSB induction (1 + 2). Rad51 is recruited to resected DNA and HR can take place (3). The BTRR complex promotes dissolution (4), and normal cell division takes place (5). Middle panel: resection is impaired in BLM-deficient conditions in nuclear chromatin (1 + 2), HR is impeded (3) and genomic instability occurs (4). Right panel: resection is impaired in rDNA in BLM-deficient conditions (1 + 2), RAD51 accumulation still occurs (3), and joint rDNA molecules give mitotic problems in the absence of the BTRR complex (4), leading to rDNA driven micronuclei formation after cell division (5). Created with BioRender.com released under a Creative Commons Attribution-NonCommercial-NoDerivs 4.0 International license. Source data are provided as a Source Data file for panels ae. Three biological replicates unless specifically stated. Statistical significance is depicted with p-values.

References

    1. Raska, I., Shaw, P. J. & Cmarko, D. Structure and function of the nucleolus in the spotlight. Curr. Opin. Cell Biol.18, 325–334 (2006). 10.1016/j.ceb.2006.04.008 - DOI - PubMed
    1. Henderson, A. S., Warburton, D. & Atwood, K. C. Location of ribosomal DNA in the human chromosome complement. Proc. Natl Acad. Sci. USA69, 3394–3398 (1972). 10.1073/pnas.69.11.3394 - DOI - PMC - PubMed
    1. Schmickel, R. D. Quantitation of human ribosomal DNA: hybridization of human DNA with ribosomal RNA for quantitation and fractionation. Pediatr. Res.7, 5–12 (1973). 10.1203/00006450-197301000-00002 - DOI - PubMed
    1. Floutsakou, I. et al. The shared genomic architecture of human nucleolar organizer regions. Genome Res.23, 2003–2012 (2013). 10.1101/gr.157941.113 - DOI - PMC - PubMed
    1. Feric, M. et al. Coexisting Liquid Phases Underlie Nucleolar Subcompartments. Cell165, 1686–1697 (2016). 10.1016/j.cell.2016.04.047 - DOI - PMC - PubMed

Publication types