. 2024 Sep 6;7(1):1097.
doi: 10.1038/s42003-024-06798-y.

Metagenomic analysis reveals high diversity of gut viromes in yaks (Bos grunniens) from the Qinghai-Tibet Plateau

Affiliations

Metagenomic analysis reveals high diversity of gut viromes in yaks (Bos grunniens) from the Qinghai-Tibet Plateau

Xiang Lu et al. Commun Biol. .

Abstract

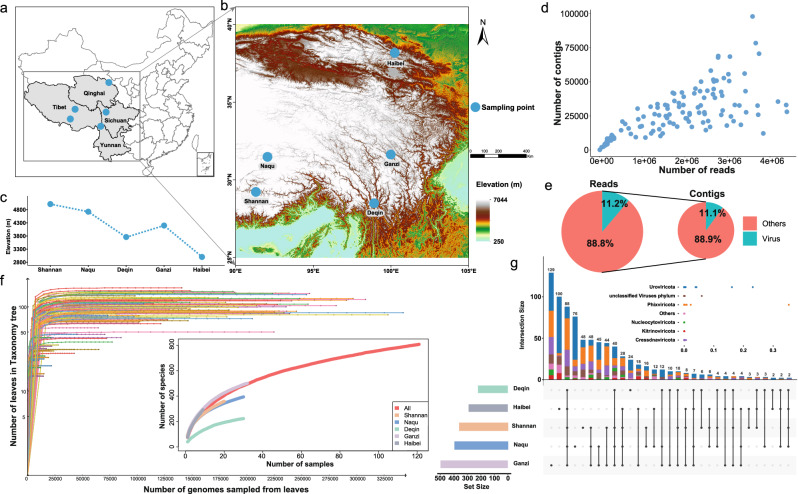
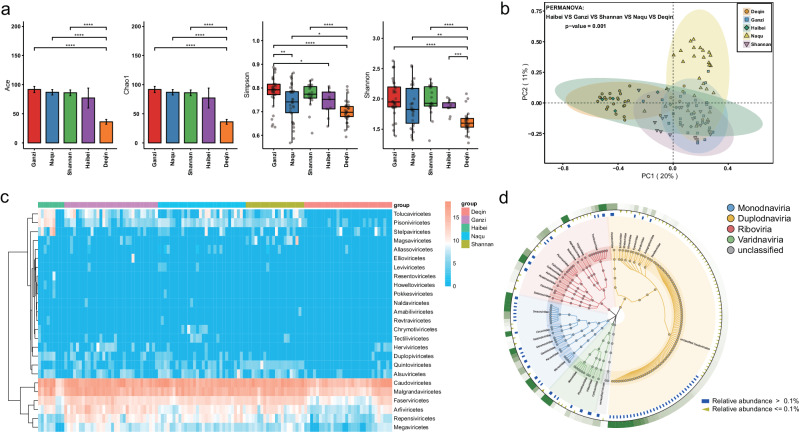
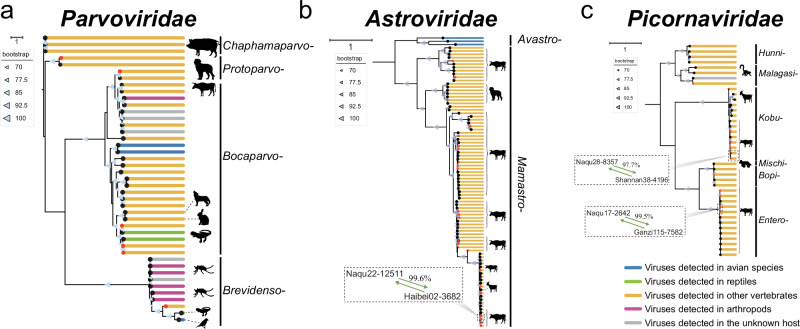
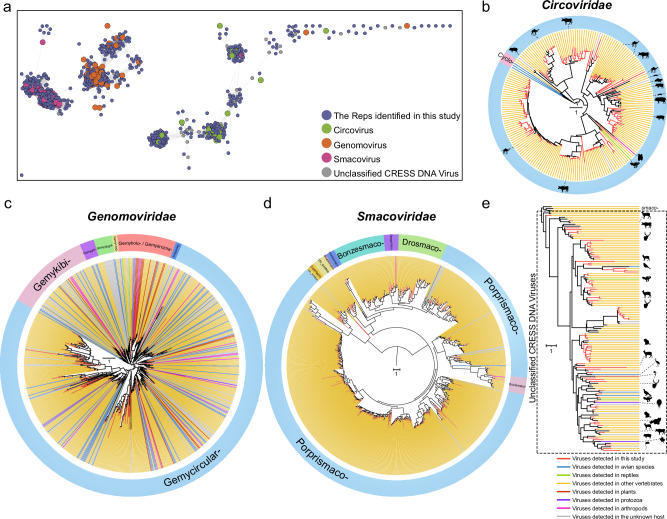
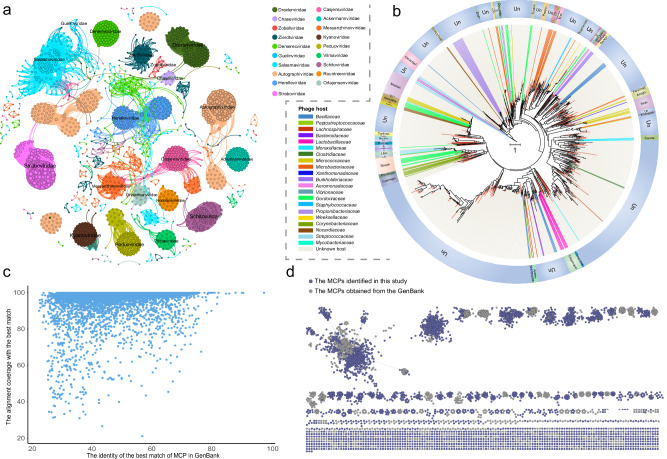
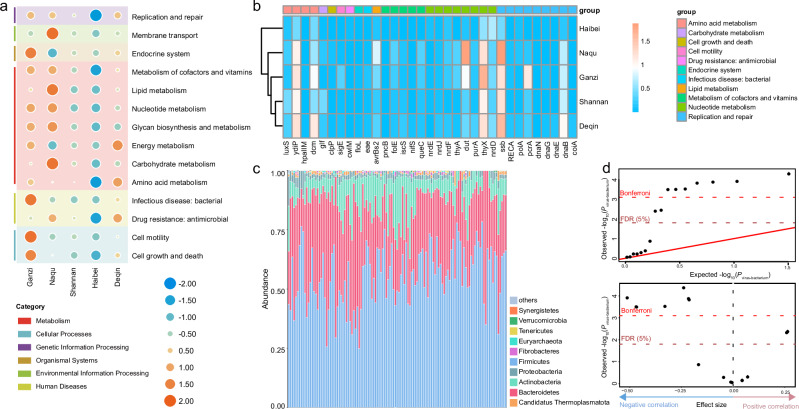
The Qinghai-Tibet Plateau (QTP), renowned for its exceptional biological diversity, is home to numerous endemic species. However, research on the virology of vulnerable vertebrates like yaks remains limited. In this study, our objective was to use metagenomics to provide a comprehensive understanding of the diversity and evolution of the gut virome in yak populations across different regions of the QTP. Our findings revealed a remarkably diverse array of viruses in the gut of yaks, including those associated with vertebrates and bacteriophages. Notably, some vertebrate-associated viruses, such as astrovirus and picornavirus, showed significant sequence identity across diverse yak populations. Additionally, we observed differences in the functional profiles of genes carried by the yak gut virome across different regions. Moreover, the virus-bacterium symbiotic network that we discovered holds potential significance in maintaining the health of yaks. Overall, this research expands our understanding of the viral communities in the gut of yaks and highlights the importance of further investigating the interactions between viruses and their hosts. These data will be beneficial for revealing the crucial role that viruses play in the yak gut ecology in future studies.


Conflict of interest statement

The authors declare no competing interests.

Figures

Fig. 1
Fig. 1. Maps showing the sampling points of yak fecal samples collected during this research.
a An overview of the sampling points in four provinces of Chinese Mainland, with five distinct sampling points indicated by blue dots. b A detailed topographic map of the five sampling points, with the scale and corresponding elevation of different locations displayed on the right side of the figure. The source of the map is Geospatial Data Cloud (https://www.gscloud.cn), and the software used to create the map is ArcMap v10.5. All of these data are freely available to the public. c An elevation profile graph of the sampling points. d The scatter plot depicts the quantities of reads and contigs identified as viruses, produced by each individual library. e The light blue portion in both pie charts represents the reads (on the left) or contigs (on the right) annotated as viruses in all libraries. The light pink portion represents reads or contigs annotated as non-viral or unannotated. f The larger figure represents the species rarefaction curve plotted using Megan6 software, with a logarithmic scale transformation applied; The smaller figure depicts the species accumulation curve, where the horizontal axis represents the number of randomly sampled libraries, and the vertical axis represents the cumulative number of identified viral species. g An UpSet plot based on different sampling points as the classification criterion. This plot showcases the number of viruses shared or unique among different populations of yaks’ gut. The left-side bar chart represents the total number of viral species for each sampling point, while the top bar chart represents the number of viral phyla corresponding to shared or unique viruses.
Fig. 2
Fig. 2. Comparisons of viral communities in the gut of yaks across different regions.
a Comparisons of richness and diversity of viral communities in the gut of yaks across different sampling points: Ganzi (n = 32), Naqu (n = 30), Shannan (n = 20), Haibei (n = 9), and Deqin (n = 30). The ACE, Shannon, Chao1, and Simpson indices were all analyzed using the Wilcoxon test. *P < 0.05, **P < 0.01, ***P < 0.001, between the two groups. b The PCoA analysis revealed significant differences among viral communities from different sampling points. The two principal component scores accounted for 20% (PC1) and 11% (PC2) of the total variations, respectively. Each symbol represents an individual sample. c A cluster heatmap of viral classes in the gut of yaks from five different sampling points. The different colored bands at the top of the heatmap represent the corresponding sampling points. The row names on the right side of the heatmap represent the names of viral families. The data is presented in logarithmic scale with a base of log10, and the legend is displayed in the upper right corner. d Filtered the viral taxonomy diagram to include the top 150 most abundant viral genera across all libraries. Different background colors represent distinct viral realms. The outermost green squares represent the relative abundance heatmap for each viral genus. Yellow triangles indicate viral genera with an abundance below 0.1% of all viruses. Blue squares represent viral genera with an abundance above 0.1% of all viruses.
Fig. 3
Fig. 3. Phylogenetic analysis of vertebrate-associated viruses.
The maximum likelihood trees were constructed using the NS1 proteins of Parvoviridae (a) and the RdRp proteins of Astroviridae (b) and Picornaviridae (c), respectively. The red dots at the tips of the clades represent the viruses identified in this study. Lines of different colors represent the hosts of viruses, as detailed in the legend at the bottom right corner. All animal and other life form silhouettes are sourced from PhyloPic (https://www.phylopic.org) and are available for reuse under Creative Commons licenses.
Fig. 4
Fig. 4. Identification and phylogenetic analysis of CRESS DNA viruses in the gut of yaks.
a Sequence similarity network of Reps associated with CRESS DNA viruses. The maximum likelihood trees were constructed using the Rep proteins of Circoviridae (b), Genomoviridae (c), Smacoviridae (d) and Unclassified CRESS DNA Viruses (e), respectively. Lines of different colors represent the hosts of viruses, as detailed in the legend at the bottom right corner. All animal and other life form silhouettes are sourced from PhyloPic (https://www.phylopic.org) and are available for reuse under Creative Commons licenses.
Fig. 5
Fig. 5. Taxonomic prediction, phylogenetic analysis, and sequence similarity network analysis of yak gut phages.
a PhaCGN2 was employed for the classification prediction of the 8954 contigs annotated as bacterial viruses identified in this study, with 523 contigs successfully assigned to 19 viral families. The network graph was generated using Gephi based on the node and edge files produced by PhaGCN2. b Phylogenetic analysis of Caudoviricetes based on the TerL amino acid sequences from yak fecal samples. The red lines represent newly identified viruses in this study. The lines of other colors indicate the hosts corresponding to the selected reference sequences, as shown in the legend on the left. The outermost circle represent the genera to which each virus belongs. c The scatter plot depicts the identity and coverage of 6351 MCPs generated in this study compared to their best match in the GenBank database. d Sequence similarity network of MCPs associated with Microviridae. Gray dots represent those sourced from the GenBank database, while purple dots represent those derived from the gut of yaks in the QTP.
Fig. 6
Fig. 6. Association, interaction, and functional analysis of gut bacterial and viral communities in yaks.
a Bubble plot of functional annotation results for phage proteins based on the eggNOG database. b Heatmap showing the relative abundance of genes annotated by eggNOG in yak gut phage communities across different regions. c Bar chart depicting the relative abundance of gut bacteria in yaks. d The upper panel represents the quantile-quantile plot of P values for the virus-bacterium association analysis (Pvirus-bacteria). The x-axis represents the expected −log10(Pvirus-bacterium) values from a uniform distribution. The y-axis represents the observed −log10(Pvirus-bacterium) values. The red diagonal line represents the line y = x, which corresponds to the null hypothesis. The horizontal red dashed line represents the Bonferroni-corrected threshold (α = 0.05), while the brown dashed line indicates the FDR threshold (FDR = 0.05) calculated using the Benjamini-Hochberg method. The x-axis in the lower panel represents the effect sizes in linear regression. The y-axis and the horizontal dashed lines are consistent with those shown in the panel above.

References

    1. Wu, S., Wang, Y., Wang, Z., Shrestha, N. & Liu, J. Species divergence with gene flow and hybrid speciation on the Qinghai-Tibet Plateau. N. Phytol.234, 392–404 (2022). 10.1111/nph.17956 - DOI - PubMed
    1. Liu, Y. et al. The sequence and de novo assembly of the wild yak genome. Sci. Data7, 66 (2020). 10.1038/s41597-020-0400-3 - DOI - PMC - PubMed
    1. Wang, Z. et al. Domestication relaxed selective constraints on the yak mitochondrial genome. Mol. Biol. Evol.28, 1553–1556 (2011). 10.1093/molbev/msq336 - DOI - PubMed
    1. Zhang, Z. et al. Convergent evolution of Rumen microbiomes in high-altitude mammals. Curr. Biol.26, 1873–1879 (2016). 10.1016/j.cub.2016.05.012 - DOI - PubMed
    1. Qiu, Q. et al. The yak genome and adaptation to life at high altitude. Nat. Genet44, 946–949 (2012). 10.1038/ng.2343 - DOI - PubMed

Publication types

LinkOut - more resources