. 2022 Nov 17;1(1):1.
doi: 10.1038/s44185-022-00001-3.

Climate change will redefine taxonomic, functional, and phylogenetic diversity of Odonata in space and time

Affiliations

Climate change will redefine taxonomic, functional, and phylogenetic diversity of Odonata in space and time

Tommaso Cancellario et al. NPJ Biodivers. .

Abstract

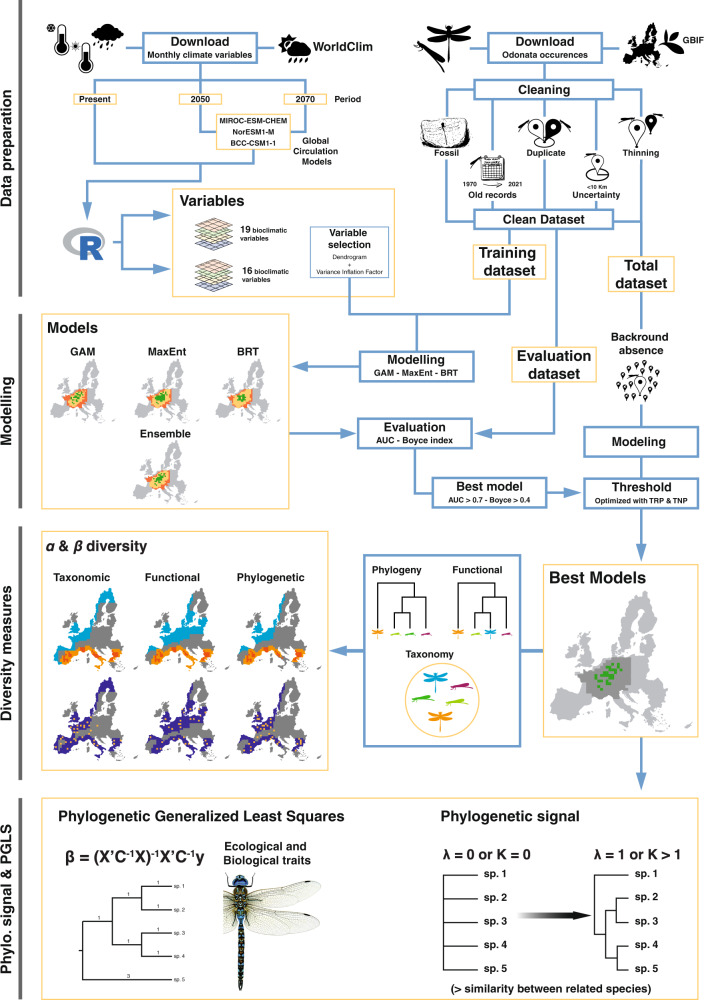
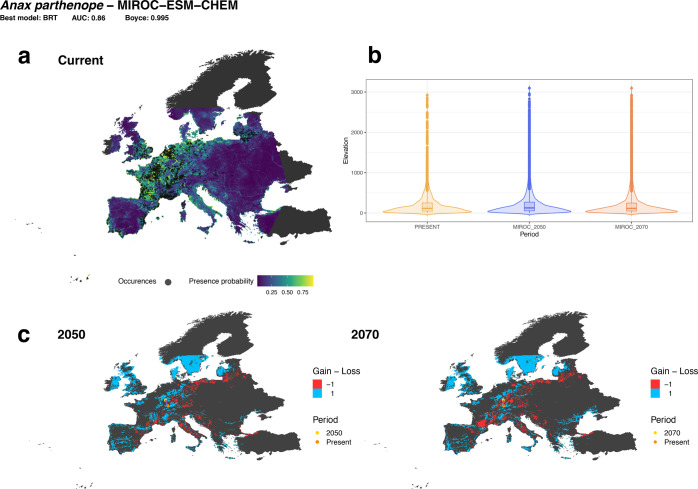
Climate change is rearranging the mosaic of biodiversity worldwide. These broad-scale species re-distributions affect the structure and composition of communities with a ripple effect on multiple biodiversity facets. Using European Odonata, we asked: i) how climate change will redefine taxonomic, phylogenetic, and functional diversity at European scales; ii) which traits will mediate species' response to global change; iii) whether this response will be phylogenetically conserved. Using stacked species distribution models, we forecast widespread latitudinal and altitudinal rearrangements in Odonata community composition determining broad turnovers in traits and evolutionary lineages. According to our phylogenetic regression models, only body size and flight period can be partly correlated with observed range shifts. In considering all primary facets of biodiversity, our results support the design of inclusive conservation strategies able to account for the diversity of species, the ecosystem services they provide, and the phylogenetic heritage they carry in a target ecosystem.


Conflict of interest statement

The authors declare no competing interests.

Figures

Fig. 1
Fig. 1. Infographic summarising the study workflow.
In this work, we first constructed a species distribution model for each species of European Odonata to predict their current and future habitat suitability. Then, we stacked the model projections and used community-level data (α and β diversity) to quantify the temporal variation of taxonomic, functional, and phylogenetic diversity. Finally, we used the predicted range shift to assess whether the response of Odonata to climate change is driven mainly by their evolutionary history or by distinctive biological and ecological traits.
Fig. 2
Fig. 2. Example of summarised species distribution model (SDM) projections for an individual odonate species.
a Best model prediction map for the current time period. b Extent of elevation shift across time periods. c Variation of habitat availability between future and current time periods. Habitat gain and loss are depicted with blue and red colours respectively. Centroid shift is represented by the variation among the orange (present) and yellow point (future). In the box plots, the box indicates the inter-quartile range (25–75th percentile); the bold line is the median; the upper and lower whiskers extend from the hinge to the largest and smallest value no further than 1.5 * inter-quartile range; data beyond the end of the whiskers are outliers. Summarised SDM outcomes for all species are available in Supplementary Material 3.
Fig. 3
Fig. 3. Quantification of α diversity per different time period (current; 2050; 2070) and biodiversity facets (taxonomic, functional and phylogenetic) under the climate scenario MIROC-ESM-CHEM.
For future scenarios, the cold-colour gradient indicates the extent of species loss, whereas the warm-colour gradient indicates the species gain. See Supplementary Material 4 for BCC-CSM1-1 and NorESM1-M climate scenarios.
Fig. 4
Fig. 4. Quantification of total β diversity (β replacement + β -richness) per different time period (current; 2050; 2070) and biodiversity facets (taxonomic, functional and phylogenetic) under the climate scenario MIROC-ESM-CHEM.
See Supplementary Material 4 for BCC-CSM1-1 and NorESM1-M climate scenarios.
Fig. 5
Fig. 5. Reconstruction of ancestral character states for the variables body size (left) and variation in habitat suitability (right).
Pagel’s λ and Blomberg’s K indicate the estimated values for the response variables “Variation of habitat suitability” (see Supplementary Material 6 for the other tree of ancestral character reconstructions). “Length” in the legend provides the scale for the branch lengths of the phylogenetic tree. The grey box delimits the Zygoptera clade whereas the brown one the Anisoptera clades.

References

    1. Pecl, G. T. et al. Biodiversity redistribution under climate change: impacts on ecosystems and human well-being. Science355, eaai9214 (2017). 10.1126/science.aai9214 - DOI - PubMed
    1. Bellard, C., Bertelsmeier, C., Leadley, P., Thuiller, W. & Courchamp, F. Impacts of climate change on the future of biodiversity. Ecol. Lett.15, 365–377 (2012). 10.1111/j.1461-0248.2011.01736.x - DOI - PMC - PubMed
    1. Diamond, S. E. Contemporary climate‐driven range shifts: putting evolution back on the table. Functional Ecol.32, 1652–1665 (2018). 10.1111/1365-2435.13095 - DOI
    1. Perry, A. L., Low, P. J., Ellis, J. R. & Reynolds, J. D. Climate change and distribution shifts in marine fishes. Science308, 1912–1915 (2005). 10.1126/science.1111322 - DOI - PubMed
    1. Chen, I. C., Hill, J. K., Ohlemüller, R., Roy, D. B. & Thomas, C. D. Rapid range shifts of species associated with high levels of climate warming. Science333, 1024–1026 (2011). 10.1126/science.1206432 - DOI - PubMed

LinkOut - more resources