. 2024 Oct;9(10):2748-2758.
doi: 10.1038/s41564-024-01773-z. Epub 2024 Sep 6.

Continental-scale associations of Arabidopsis thaliana phyllosphere members with host genotype and drought

Collaborators, Affiliations

Continental-scale associations of Arabidopsis thaliana phyllosphere members with host genotype and drought

Talia L Karasov et al. Nat Microbiol. 2024 Oct.

Abstract

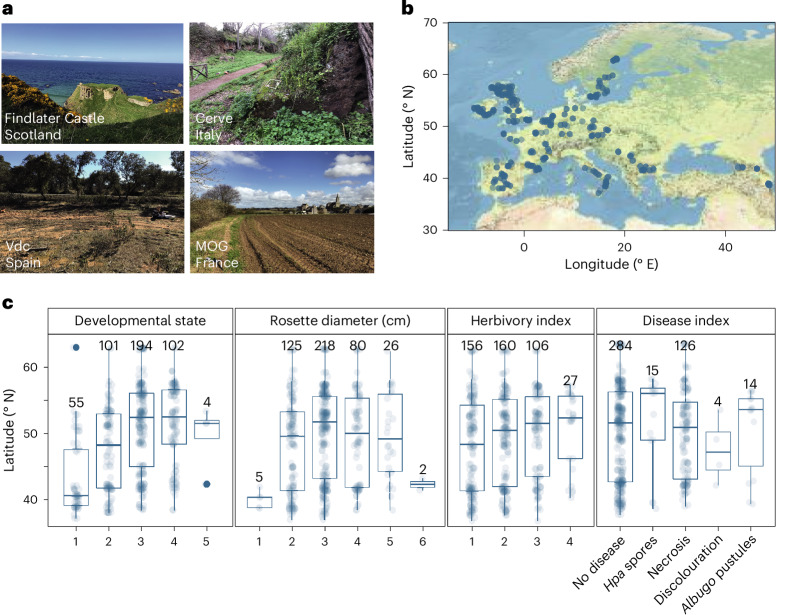
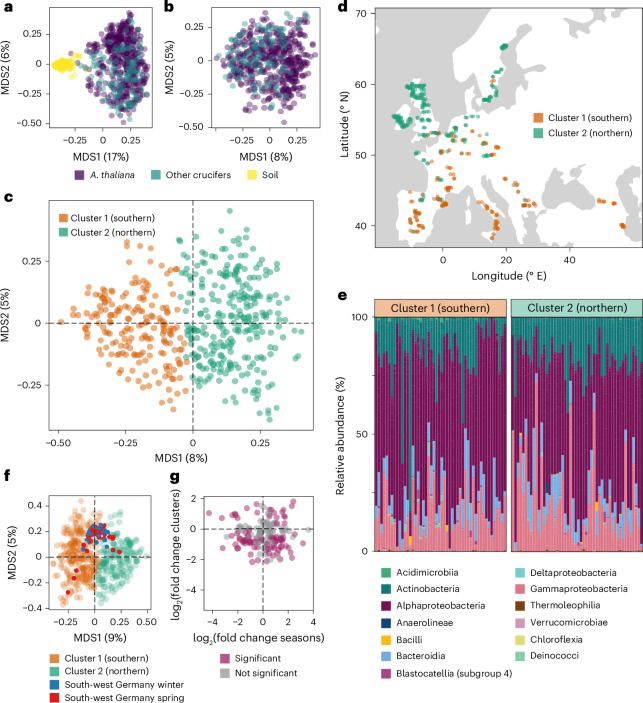
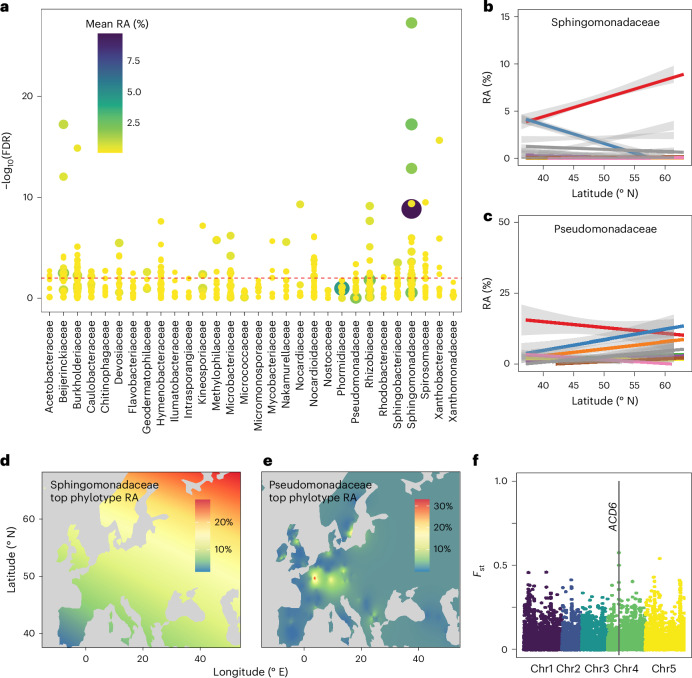
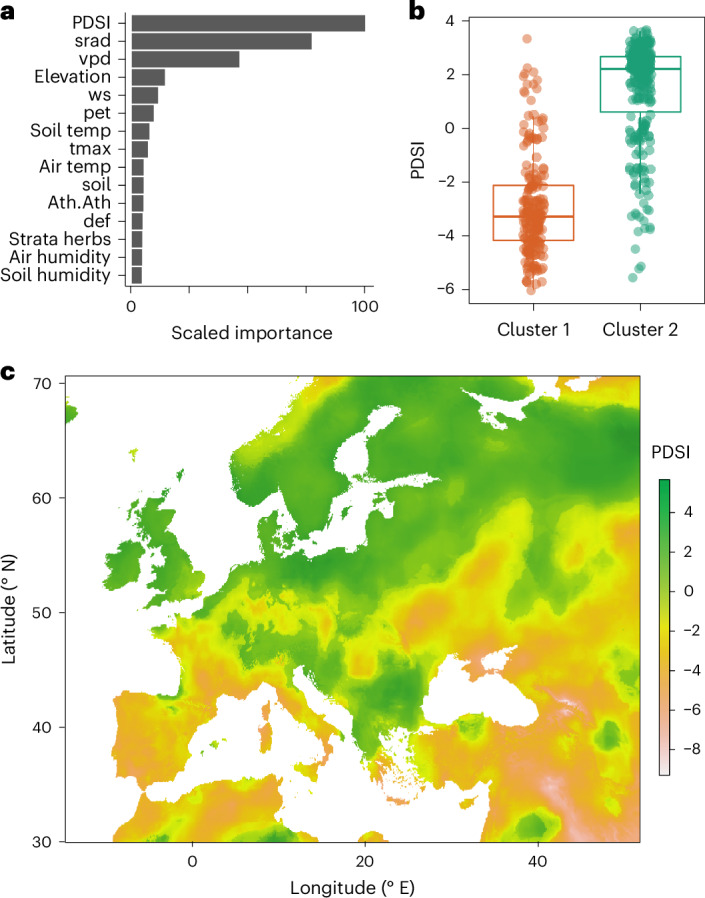
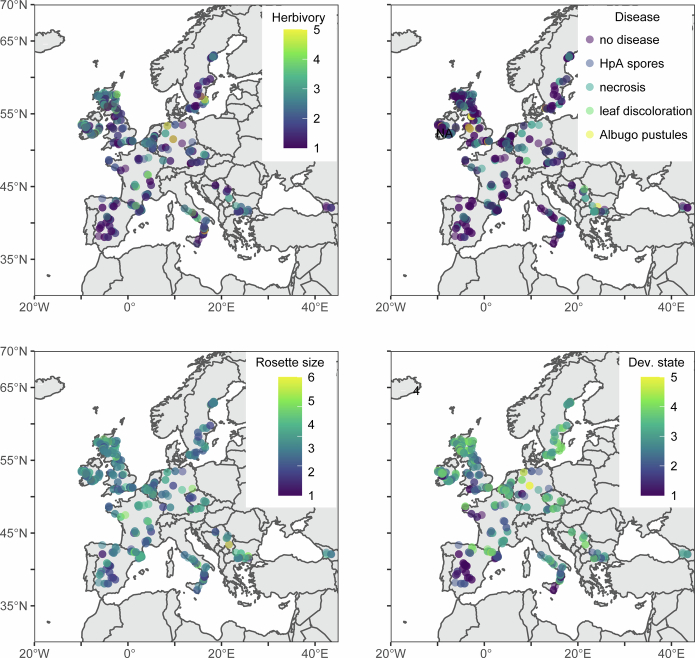
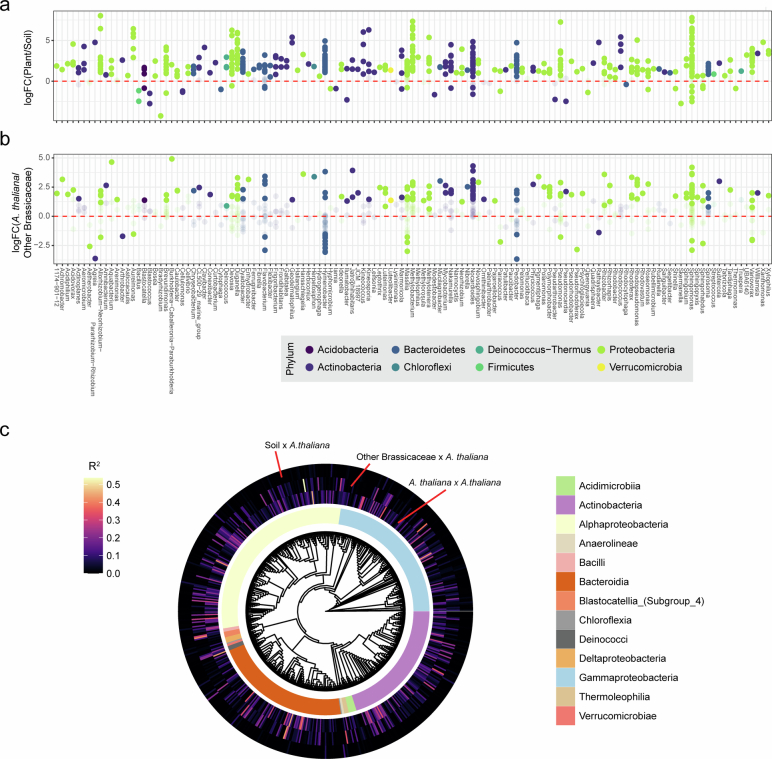
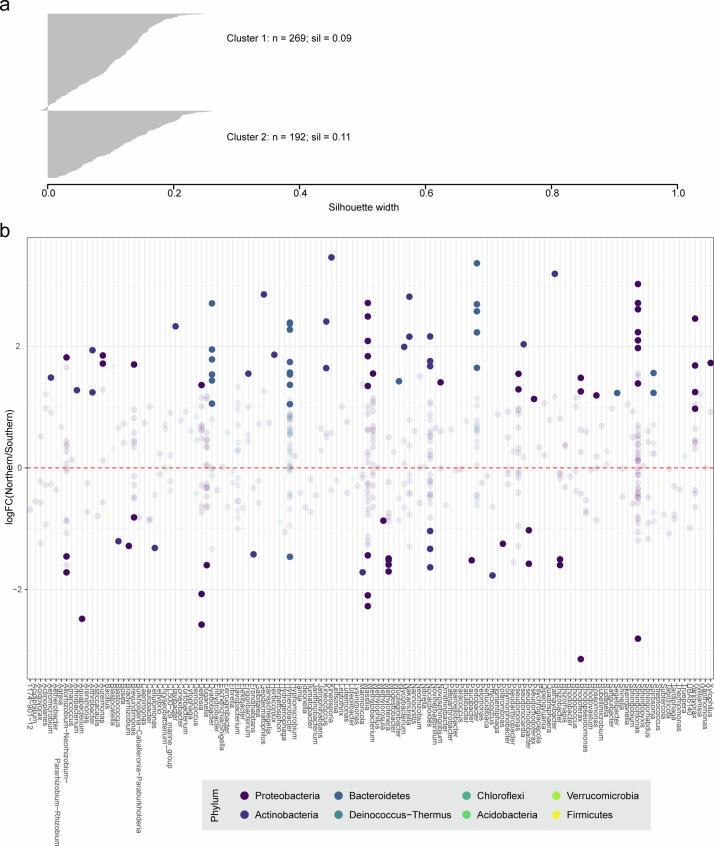
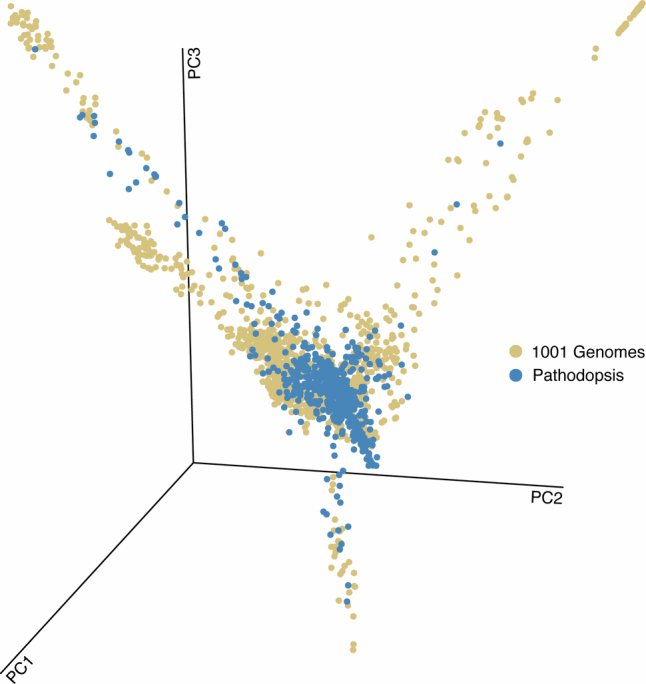
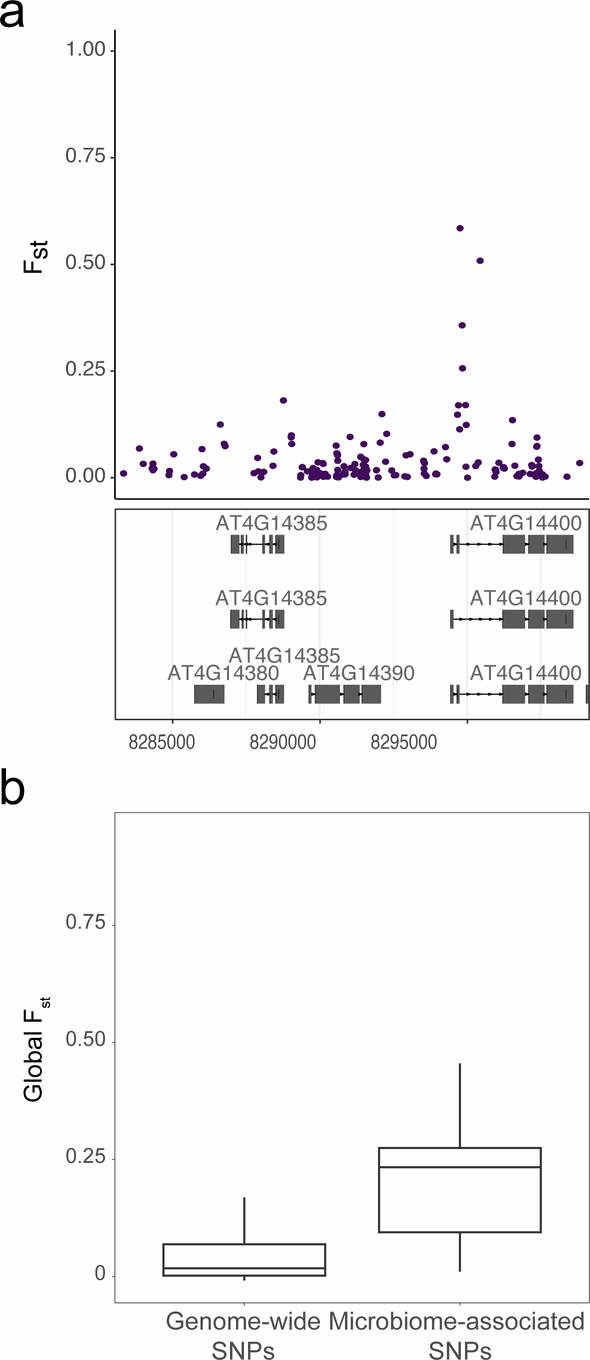
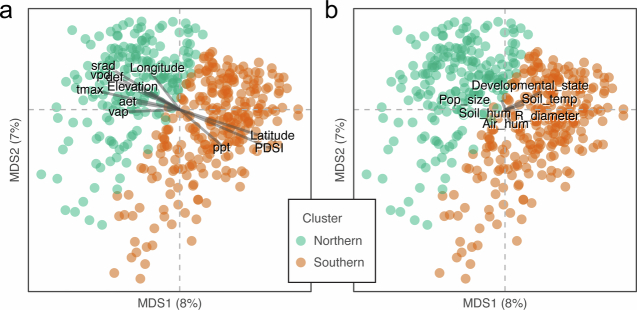
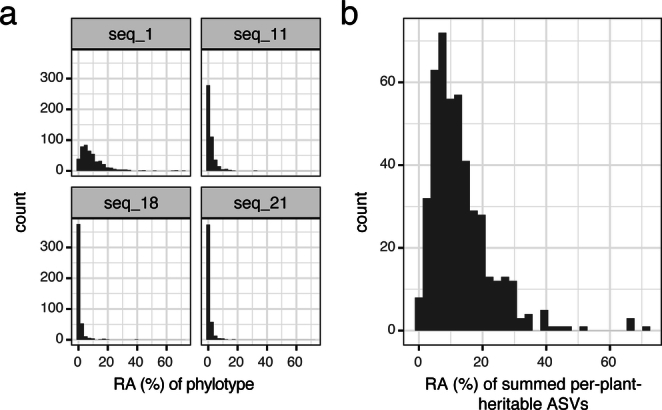
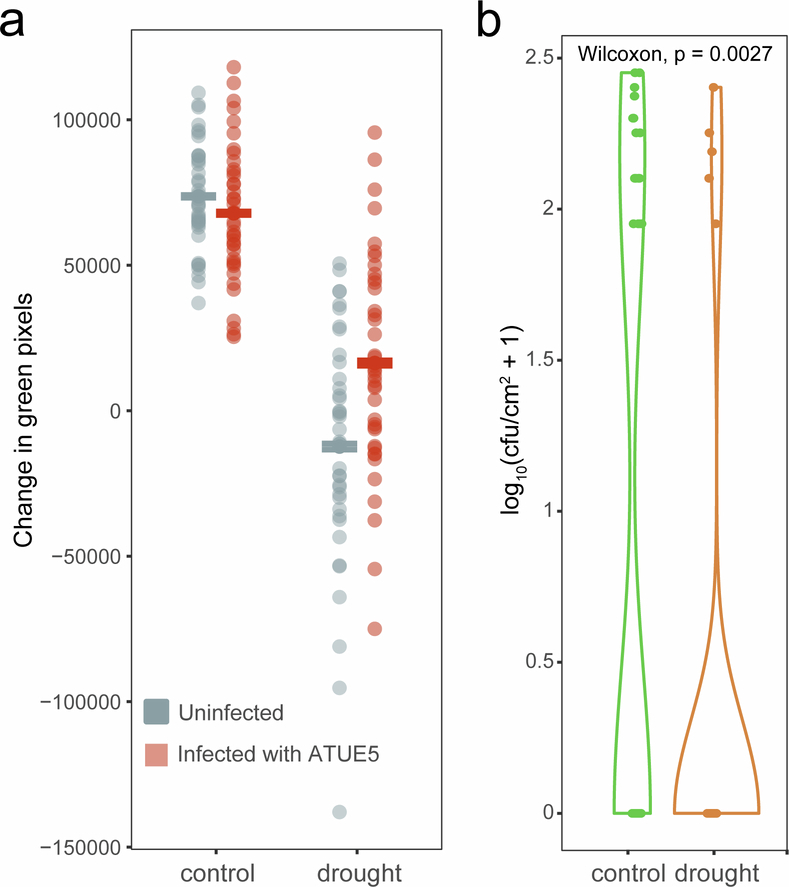
Plants are colonized by distinct pathogenic and commensal microbiomes across different regions of the globe, but the factors driving their geographic variation are largely unknown. Here, using 16S ribosomal DNA and shotgun sequencing, we characterized the associations of the Arabidopsis thaliana leaf microbiome with host genetics and climate variables from 267 populations in the species' native range across Europe. Comparing the distribution of the 575 major bacterial amplicon variants (phylotypes), we discovered that microbiome composition in A. thaliana segregates along a latitudinal gradient. The latitudinal clines in microbiome composition are predicted by metrics of drought, but also by the spatial genetics of the host. To validate the relative effects of drought and host genotype we conducted a common garden field study, finding 10% of the core bacteria to be affected directly by drought and 20% to be affected by host genetic associations with drought. These data provide a valuable resource for the plant microbiome field, with the identified associations suggesting that drought can directly and indirectly shape genetic variation in A. thaliana via the leaf microbiome.


Conflict of interest statement

D.W. holds equity in Computomics, which advises plant breeders. D.W. consults for KWS SE, a plant breeder and seed producer. The other authors declare no competing interests.

Figures

Fig. 1
Fig. 1. Representative sampling of A. thaliana phyllosphere microbiomes across Europe.
a,b, A. thaliana plants were collected from distinct ecosystems. a, Examples of aspects of collection locations. b, Latitude/longitude of all locations. MOG is an acronym for Moguériec, France, and Vdc for Villaviciosa de Córdoba, Spain. c, Based on images of individual plants taken at each site, we assessed plant health and development. The x axis represents qualitative values (Methods), except for the rosette diameter, which is classified in intervals of (1) 0–1 cm, (2) 1–2 cm and so on. The disease index corresponds to different macroscopic disease symptoms as indicated (Hpa, Hyaloperonospora arabidopsidis). The central horizontal line in each box indicates the median, the bounds indicate the upper and lower quartiles and the number above the boxes indicates the individuals in each group.
Fig. 2
Fig. 2. Two distinct microbiome types in A. thaliana along a latitudinal cline.
a,b, Ordination on a Hellinger transformation of the samples. Arabidopsis thaliana leaf microbiomes are significantly differentiated from that of surrounding soil (a) and less so, but still significantly, from surrounding crucifers (Brassicaceae) (b). c,d, k-means clustering (k = 2) (c) identified two microbiome types that turned out to have a north–south latitudinal cline (d). e, Distribution of higher taxonomic levels across the southern and northern clusters. f, Comparison of extent of seasonal variation in south-west Germany (winter and spring) with the European geographic variation (clusters 1 and 2). g, Absence of correlation in fold changes (FCs) in phylotype abundance between the northern and southern clusters (y axis) and between the winter and spring samples from south-western Germany (x axis). Colour indicates association with the two north–south clusters 1 and 2.
Fig. 3
Fig. 3. Latitudinal clines in microbial abundances and association of a host immune gene with microbiome type.
a, Linear relationships between relative abundance (RA) of the most common phylotypes. The y axis represents −log10-transformed FDR-corrected P values obtained when regressing the abundance of a phylotype on latitude (linear regression). Phylotypes are grouped by families, which are indicated on the bottom. b,c, There is a strong latitudinal cline for the RA of the most abundant sphingomonads (b) but not for the most abundant pseudomonads (c; note the difference in RA scale). d,e, Interpolation of the abundance of the top sphingomonad phylotype (d) and of ATUE5 (e), the top pseudomonad phylotype and a known opportunistic pathogen, revealed a continuous spatial gradient for the top sphingomonad (d), but a patchy distribution with regional hotspots for the top pseudomonad (e). f, The relationship between microbiome type and polymorphism in plant immune genes was assessed with the Fst population differentiation index. The most extreme Fst values were found in the immune regulator ACD6. Data in b and c are presented as the estimated regression value ± s.e.m. Chr, chromosome.
Fig. 4
Fig. 4. PDSI is the best predictor of phyllosphere microbiome type.
a, Random forest modelling was used to determine environmental variables associated with microbiome type. The abbreviations are explained in Methods. b, PDSI of the location was the best predictor of microbiome type, explaining more than 50% of the variance. The upper and lower hinges of the boxes represent the first and third quartiles and the central line the median, with n = 269 plants in cluster 1 and n = 192 plants in cluster 2. c, The mean PDSI throughout Europe for January to April 2018.
Extended Data Fig. 1
Extended Data Fig. 1. Distribution of sampled A. thaliana plants with various developmental and health states.
Arbitrary scales (see Methods) except for rosette size (cm).
Extended Data Fig. 2
Extended Data Fig. 2. Differential abundance of phylotypes in soil, A. thaliana phyllospheres, and phyllospheres of other Brassicaceae.
a, 91% of phylotypes were differentially abundant between A. thaliana and soil. b, 36% of phylotypes were differentially abundant between A. thaliana and other Brassicaceae. Bold points indicate significance with an FDR ≤ 0.01. c, Within-site correlation of phylotype abundance. Correlation coefficients (scale on top left) were calculated for the co-occurrence of a phylotype within a site between the two A. thaliana plants collected at the site, A. thaliana x A. thaliana (third ring from the outside), other Brassicaceae x A. thaliana (second ring from the outside), and soil x A. thaliana (outermost ring). The central tree in the Circos plot represents the maximum likelihood tree of phylotypes, plotted without inferred branch lengths.
Extended Data Fig. 3
Extended Data Fig. 3. Contrasts in phylotype abundances between Southern and Northern microbiome clusters.
a, Silhouette scores for membership assignment to either of the two main microbiome types, cluster 1 (Southern) and cluster 2 (Northern). For each cluster, number of individuals and average distance between a sample and members of the other cluster is indicated. b, Differential abundance of phylotypes between Southern and Northern microbiome clusters. y-axis shows the log2(Fold Change) for the relative abundance difference of a phylotype between clusters. Bold points indicate significance with an FDR ≤ 0.01.
Extended Data Fig. 4
Extended Data Fig. 4. Projection of A. thaliana genotypes from this study into genotypic PC space from the 1001 Genomes Project.
Individuals from this study (‘Pathodopsis’) align well with the broader 1001 Genomes (https://1001genomes.org) collection of primarily Eurasian accessions.
Extended Data Fig. 5
Extended Data Fig. 5. Fst around ACD6 and globally.
a, Cockerham and Weir’s fixation index Fst was estimated for SNPs in a list of known immune-associated genes. The genome-wide most extreme Fst values are concentrated in a region on chromosome 4 that includes the immune regulator ACD6 (At4g14400). Reference genome positions (in nt) on chromosome 4 given at the bottom. b, Bergelson and colleagues identified A. thaliana SNPs associated with (and likely to influence) microbiome composition. We compared the geographic differentiation of these SNPs (Fst) to the genome-wide distribution. Microbiome-associated SNPs exhibit significantly higher Fst values than the remainder of the genomic SNPs (Wilcoxon rank-sum test p < 2.2x10⁻¹⁶). The central horizontal line in each box indicates the median, the bounds indicate the upper and lower quartiles and the whiskers indicate 1.5*inner quartile range.
Extended Data Fig. 6
Extended Data Fig. 6. Distance-Semivariance plot for ATUE5.
Relationship between the geographic distance between two sampled A. thaliana plants, and the correlation of the abundance of ATUE5 between these two plants.
Extended Data Fig. 7
Extended Data Fig. 7. Correlogram of relationship between environmental and developmental covariates used in random forest modeling.
Covariates are detailed in Methods.
Extended Data Fig. 8
Extended Data Fig. 8. Biplots of the correlation of environmental and physiological variables on the MDS axes in Fig. 2.
a, Environmental variables derived from Terraclimate. b, Environmental variables measured at time of collection. Correlations were assessed with the envfit() function in vegan, and vector length corresponds to strength of correlation. Long-term climate variables (a) are better predictors of microbiome composition than are more temporary weather and physiological variables measured at the time of collection (b).
Extended Data Fig. 9
Extended Data Fig. 9. Relative abundance of phylotypes is significantly associated with plant genotype classification.
Four out of 20 phylotypes that were shared between the Eurasian collections and California field experiment were significantly associated with plant genotype. a, Histograms for the relative abundance of each of the four significant phylotypes across all plants collected in Eurasia. b, Histogram of the total relative abundance per plant of the sum of all four phylotypes (mean = 13.2% RA).
Extended Data Fig. 10
Extended Data Fig. 10. Impact of a common phylotype on plant growth as a function of drought status.
Arabidopsis thaliana plants were exposed to combinations of drought and infection with ATUE5 strain p25.c2. a, The change in plant leaf area from day 0 to day 10 as calculated based on daily images and extracting green pixels from images. Infection with ATUE5 reduced the negative effect of drought on plant growth (ANOVA, p = 0.0063 in ANOVA). b, measured colony forming units (cfu) on day 3 post infection. 5/41 (12%) drought-treated plants had established infection on day 3, whereas 17/23 (42%) of control plants had established infection at this same timepoint (Wilcoxon rank-sum p = 0.0027).

References

    1. 1001 Genomes Consortium. 1,135 genomes reveal the global pattern of polymorphism in Arabidopsis thaliana. Cell166, 481–491 (2016). - PMC - PubMed
    1. Hancock, A. M. et al. Adaptation to climate across the Arabidopsis thaliana genome. Science334, 83–86 (2011). - PubMed
    1. Bartoli, C. et al. In situ relationships between microbiota and potential pathobiota in Arabidopsis thaliana. ISME J.12, 2024–2038 (2018). - PMC - PubMed
    1. Thiergart, T. et al. Root microbiota assembly and adaptive differentiation among European Arabidopsis populations. Nat. Ecol. Evol.4, 122–131 (2020). - PubMed
    1. Wagner, M. R. et al. Host genotype and age shape the leaf and root microbiomes of a wild perennial plant. Nat. Commun.7, 12151 (2016). - PMC - PubMed