. 2024 Oct;9(10):2570-2582.
doi: 10.1038/s41564-024-01804-9. Epub 2024 Sep 6.

Primary succession of Bifidobacteria drives pathogen resistance in neonatal microbiota assembly

Affiliations

Primary succession of Bifidobacteria drives pathogen resistance in neonatal microbiota assembly

Yan Shao et al. Nat Microbiol. 2024 Oct.

Abstract

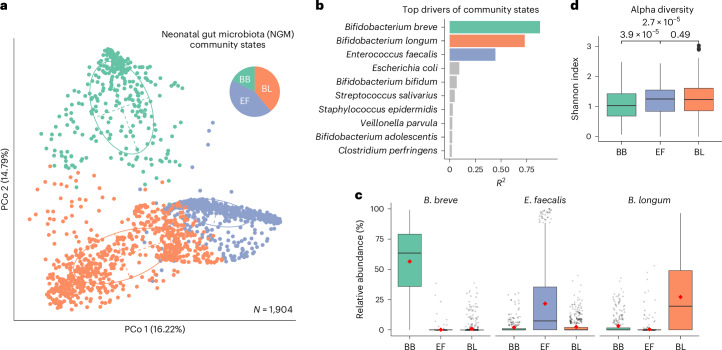
Human microbiota assembly commences at birth, seeded by both maternal and environmental microorganisms. Ecological theory postulates that primary colonizers dictate microbial community assembly outcomes, yet such microbial priority effects in the human gut remain underexplored. Here using longitudinal faecal metagenomics, we characterized neonatal microbiota assembly for a cohort of 1,288 neonates from the UK. We show that the pioneering neonatal gut microbiota can be stratified into one of three distinct community states, each dominated by a single microbial species and influenced by clinical and host factors, such as maternal age, ethnicity and parity. A community state dominated by Enterococcus faecalis displayed stochastic microbiota assembly with persistent high pathogen loads into infancy. In contrast, community states dominated by Bifidobacterium, specifically B. longum and particularly B. breve, exhibited a stable assembly trajectory and long-term pathogen colonization resistance, probably due to strain-specific functional adaptions to a breast milk-rich neonatal diet. Consistent with our human cohort observation, B. breve demonstrated priority effects and conferred pathogen colonization resistance in a germ-free mouse model. Our findings solidify the crucial role of Bifidobacteria as primary colonizers in shaping the microbiota assembly and functions in early life.


Conflict of interest statement

T.D.L. is the co-founder and CSO of Microbiotica. The other authors declare no competing interests.

Figures

Fig. 1
Fig. 1. Dominant species driving three NGM community states.
a, Principal coordinates analysis (PCoA) plots of 1,904 neonatal gut metagenomes sampled within the first 30 days of life and clustered using the PAM algorithm on the basis of species-level JSD. Three distinct NGM community states (optimal number clusters k = 3) were identified via PAM clustering. The inset pie chart displays the proportion of the three NGM community states, each labelled according to its primary driver species, namely B. breve (BB, green; N = 336, 17.6% of the samples), E. faecalis (EF, purple; N = 827, 43.4% of the samples) and B. longum (BL, orange; N = 741, 38.9% of the samples). Ellipses encapsulate 67% of the samples within each respective cluster. b, Top 10 driver species contributing to variation observed in the ordination space, as ranked by effect size (‘envfit’ R2, false discovery rate (FDR)-corrected two-sided test, P < 0.05). c,d, Each NGM community state is dominated by a single driver species, as measured by the high relative abundance of the driver species (c) and the low alpha diversity (d) across the three NGM community states (FDR-corrected, two-sided Wilcoxon test). Boxplot centre line and red point indicate the median and mean, respectively; box limits indicate the upper and lower quartiles; and whiskers indicate 1.5× the interquartile range (BB n = 336, EF n = 827, BL n = 741).
Fig. 2
Fig. 2. Clinical and sociodemographic variables associated with NGM community state in the first week of life (N = 1,108).
ac, Multivariate associations between clinical and sociodemographic variables and each week-1 NGM community state. Three different models were built: EF vs non-EF (a), BL vs non-BL (b) and BB vs non-BB (c). Likelihood ratio tests (two-sided) were used to calculate P values (without FDR correction), with P ≤ 0.05 in the multivariate models displayed. Odds ratios (OR) are plotted on a log10 scale. For details of univariate and multivariate analyses, refer to Supplementary Tables 5 and 6. The week-1 NGM community state was identified for each eligible participant using the earliest available sample from week 1, either on day 4 (N = 64) or day 7 (N = 1,044).
Fig. 3
Fig. 3. Dynamics and stability of NGM community states and their driver species.
a,b, Stability of NGM community states (a) and levels of three species driving NGM community states (b) (week 1, based on the earlier sample of day 4 or 7) in neonates longitudinally sampled from weeks 1 to 3 (day 21, total N = 306; VD N = 140; CS N = 166). The proportion of community states that remained consistent from weeks 1 to 3 is depicted as a percentage of their initial sample size in week 1 (labelled in black). Participants starting with BB or BL on week 1 were significantly more likely to retain their community state in week 3 compared with those with EF (pairwise chi-square tests with FDR correction, P < 0.001). ce, Persistence of the dominant abundance of driver species of NGM community states in week 1 (c,d) or week 3 (e) in the paired longitudinal samples obtained later at week 3 (c) and in infancy (d,e). f, Persistent carriage of week-1 driver species in paired longitudinal samples obtained later in infancy. Species carriage is defined using a threshold of 0.1% relative abundance. Sample sizes of participants longitudinally sampled for weeks 1 and 3 shown in ac are: total N = 306; VD N = 26/39/75 among BB/EF/BL, respectively; CS N = 26/114/26 among BB/EF/BL, respectively; for week 1 and infancy (also referred to as the ‘infancy persistence’ group) shown in d and f: total N = 302; VD N = 27/43/90 among BB/EF/BL, respectively; CS N = 17/108/17 among BB/EF/BL, respectively; and for week 3 and infancy shown in e: total N = 146; VD N = 12/11/43 among BB/EF/BL, respectively; CS N = 17/37/26 among BB/EF/BL, respectively. Colour represents NGM community states or driver species: BB and B. breve in green; EF and E. faecalis in purple; BL and B. longum in orange. Boxplots as in Fig. 1. Statistical differences in abundance between time points (a), species (ce) and carriage frequency (f) were determined using paired t-tests, Wilcoxon tests and chi-square tests (all two-sided) with FDR correction, respectively.
Fig. 4
Fig. 4. Bifidobacterium species drive resistance to antimicrobial resistance and pathogen colonization.
a, Counts of detected AMR and virulence genes in driver species genomes, with median values enclosed in brackets. Wilcoxon test (two-sided) with FDR correction; number of genomes (isolates in brackets): BB N = 297 (30), EF N = 561 (54) and BL N = 391 (49). b, Carriage of high-risk AMR genes associated with ESBL in the day-7 NGM community state samples based on raw metagenomic assemblies (BB N = 207, EF N = 498, BL N = 444). The x axis shows the most clinically prevalent ESBL genes belonging to CTX-M, OXA, SHV and TEM families. c, Proportion of species genomes, indicated by a colour gradient, predicted to utilize HMOs or their primary downstream products, lactose and fucose. The actual proportions are labelled for genotypes that are not completely present. The predictions are based on the presence of both the gene and its encoded transporters required for utilization of each substrate. 2′-fucosyllactose (2′-FL) liberates lactose and fucose which are also present in breast milk. Utilizations of LNnT, LNT and LNB will all liberate lactose. d, NGM driver species BB confers pathogen colonization resistance in vivo. The boxplot depicts the relative abundance of BB compared to the opportunistic pathogen species EF or K. oxytoca (KO). The x axis represents three experimental groups co-colonized as follows: (1) BB type strain DSM 20213 (2′-FL+) with EF; (2) BB natural variant D19 (2′-FL, isolated from a BBS neonate) with EF; and (3) BB type strain (2′-FL+) with KO (D63). The BB genotype (2′-FL+/−) indicates whether the strain encodes the α-l-fucosidase (GH95) enzyme encoding for 2′-FL metabolism. In each co-colonization group, one group of mice also received a 2′-FL supplement (50 mg ml−1 per day) in their daily drinking water. The y axis for BB co-colonization with KO is shown on a log scale. Each experimental condition included 3–5 mice per cage and 3 technical replicate cages. Statistical differences between treatment groups were determined using a t-test with Welch’s correction (two-sided). Boxplot centre line indicates the median, box limits indicate upper and lower quartiles, and whiskers indicate 1.5× the interquartile range.
Extended Data Fig. 1
Extended Data Fig. 1. Overview of sampling in the Baby Biome Study.
(a-b) Shotgun metagenomes of 2,387 faecal samples from 1,288 neonatal subjects across Phase 1 (Shao et al.) and Phase 2 (this paper). The majority of samples (80% or 1,904) are from the neonatal period (b), primarily taken on day 4 (N=360), day 7 (N=1,149), and day 21 (N=350). (a) Rows represent subjects with paired maternal samples (for ‘maternal transmission’ analysis), longitudinal samples taken during the neonatal period (for ‘neonatal longitudinal’ analysis), and samples from the infancy period (for ‘infancy persistence analysis’). These relationships are indicated by lines linking the samples, with summarised proportions in (c).
Extended Data Fig. 2
Extended Data Fig. 2. Consistency of NGM community state assignment across typing methods.
(a-d) Identification of three NGM community states using both (a) Partitioning Around Medoids (PAM) clustering of JSD, with statistical support from the Calinski-Harabasz (CH) index, and (c) Dirichlet Multinomial Mixture (DMM) modelling using the Laplace approximation. (b, d) PCoA plots, representing 1,904 neonatal gut metagenomes, are color-coded by community state assignments, and based on species-level Bray-Curtis distances. (e-g) PAM-based and DMM-based community state assignment concordance: (e) Correlation between community state assignments shown with a Cramér's V correlation of 0.726. The proportions of community states assigned by each method are labelled. The breakdown of community states BB/EF/BL in PAM is 336/827/741, and in DMM is 252/1097/555. (f) Overlap in the dominant core species (≥1% mean abundance) in each community state, grouped at the genus level, with exceptions for the driver species B. breve, E. faecalis and B. longum. PAM-based assignment was chosen in downstream analyses given the higher relative abundances of these driver species in their respective community states (versus DMM-based assignment): B. breve 67.9% vs 56.5% (p<0.001), E. faecalis 21.7% vs 16.8% (p<0.001), and B. longum 27.25% vs 29.90% (p=0.24). Wilcoxon-test (two-sided) with FDR correction. (g) The top 10 driver species for each DMM-based community state are displayed, ranked by their assignment strength, as indicated on the y-axis.
Extended Data Fig. 3
Extended Data Fig. 3. Consistency of NGM community state assignment across neonatal time points.
Identification of three NGM community states using PAM-based clustering across three major time points in the neonatal period (day 4, N=360; day 7, N=1,149; day 21, N=350). PCoA plots, are color-coded by community state assignments and based on species-level JSD. Ellipses encapsulate 67% of the samples within each respective cluster.
Extended Data Fig. 4
Extended Data Fig. 4. Abundance and co-occurrence of the NGM community state driver species.
PCoA plots depicted in Fig. 1, with arrows, illustrate the scale and direction of core NGM species (>1% mean abundance) driving the formation of NGM community states (clusters). The length of the arrows is scaled to reflect the degree of contribution to the variation in NGM composition, with the arrow points towards increasing species abundance. Species that frequently co-occur with the NGM driver species within their respective community states share the same arrow direction.
Extended Data Fig. 5
Extended Data Fig. 5. Validation of NGM community states and driver species across geographies and lifestyles.
All three NGM community states and the driver species (B. breve, B. longum or B. infantis, and E. faecalis) were independently detected in infant gut metagenomic cohorts (0–6 months) from diverse geographical regions and lifestyles. These include Europe (Sweden, days 4–12, N=37), the United States (TEDDY cohort, months 2–6, N=69), the Middle East (Israel, weeks 1–24, N=60), and South Asia (Bangladesh, months 0–2, N=234). In the Bangladeshi cohort, which is a non-industrialised and non-urban population, the B. infantis and E. coli-driven clusters are representative of the B. longum (closely related to B. infantis) and E. faecalis (also facultative anaerobe opportunistic pathogen) community states, respectively. The analysis and visualization methods are consistent with those described in Fig. 1a, b.
Extended Data Fig. 6
Extended Data Fig. 6. Strain-level dynamics and stability across NGM species.
(a) Frequency of study participants detected with the same strains (in grey, otherwise in white) from their mother's faecal samples across NGM community states. To delineate transmission trends, the chart is categorized by birth mode and the three NGM driver species. Frequency of strain-sharing event (for example, maternal transmission in mother-baby pair or strain persistence within-individual longitudinal samples) is presented as raw counts of detectable strain sharing events normalized by the total number of subjects per birth mode and NGM community state (week 1). (b) Bar plots counting strain-sharing events across three settings: (Left) Maternal transmission in mother-infant dyads (183 subjects; 167 transmissions from 213 evaluated species-sample pairs). (Middle) Neonatal persistence via neonatal longitudinal sampling (359 subjects; 700 transmissions from 938 evaluated pairs). (Right) Infancy persistence from neonatal into infancy period (302 subjects; 464 transmissions from 920 evaluated pairs). When longitudinal samples were considered, strain sharing events were considered only once per subject per setting, using the time point with highest counts. Only species with ≥20 strain-sharing events detected across three settings are shown. Three community state driver species are highlighted in boxes. Transmission patterns often align with phylogeny: Actinomycetota/Actinobacteria (pink) and Bacteroidota/Bacteroidetes (green) typically transmit maternally during vaginal birth and persist into infancy. Conversely, Bacillota/Firmicutes (purple) and Pseudomonadota/Proteobacteria (orange) show lower maternal transmission rates and reduced neonatal persistence. Notable outliers include E. coli and B. breve. The size of bubbles represents the transmissibility of each species, which is its ratio of detected to potential strain-sharing events, as determined by StrainPhlAn4. Only subject pairs with sequencing depth sufficient for StrainPhlAn strain-level analyses are displayed; data points not shown are non-evaluable.
Extended Data Fig. 7
Extended Data Fig. 7. Colonisation dynamics in neonatal longitudinal samples.
(a) Overview of NGM community states of all subjects individually sampled on major neonatal period sampling points day 4, 7 or 21, stratified by birth mode. In VD, N=176/602/156 on day 4, 7, and 21, respectively; In CS, N=184/547/194 on day 4, 7, and 21, respectively. Total samples N=1859. (b) Longitudinal shifts in NGM community states and the levels of driver species from week 1 to week 3, based on subjects longitudinally sampled across days 4, 7, and 21, N=234; VD, N=111; CS, N=123). Community states that remained consistent from first (day 4) to the final neonatal longitudinal sampling (day 7 or/and 21), is depicted as a percentage of their starting pool size (labelled in black). Subjects that began with either BB or BL community state on day 4 were significantly more likely to remain in the same community state on day 7 and 21, compared to those that began with EF (pairwise chi-squared tests with FDR correction, q-values < 0.01). However, this trend was not observed as early as day 7 (global chi-squared test, p=0.7043). The colour scheme represents the community states or driver species: BB and B. breve in green; EF and E. faecalis in purple; BL and B. longum in orange. Statistical differences in species abundance between longitudinal samples was determined using paired ANOVA test (two-sided) with FDR correction. Boxplot center line and red point indicate the median and mean, respectively; box limits indicate the upper and lower quartiles; and whiskers indicate 1.5× the interquartile range.
Extended Data Fig. 8
Extended Data Fig. 8. Species-driven functional divergence in NGM community states.
(a-b) Principal Component Analysis (PCA) of community state driver enterotype species genomes. Groupings are based on the presence of genes tied to the full metabolic repertoire using (a) KEGG orthologs (KOfams) and carbon metabolism via (b) Carbohydrate-Active enZYmes (CAZymes). Each dot denotes an individual strain: B. longum (BL, N=342) in orange, B. breve (BB, N=267) in green, and E. faecalis (EF, N=507) in blue. Ellipses encapsulate the 95% confidence intervals. Arrows showcase the contribution of select CAZy genes to principal components (details in Extended Data Fig. 8). CAZy genes for human milk oligosaccharides (HMOs) utilisation are highlighted in red.
Extended Data Fig. 9
Extended Data Fig. 9. Carbon metabolism of NGM community state driver species.
(a) A heatmap displays the clustering of carbohydrate-active enzymes (CAZymes) across the genomes of three driver species. Genes are coloured based on their corresponding carbohydrate substrate categories. (b-d) Volcano plots depict differentially enriched CAZymes in each driver species, comparing (b) BB vs. EF, (c) BL vs. EF, and (d) BB vs. BL. The effect size represents the difference in the proportion of genes between species. P-values are adjusted using Fisher's exact test (two-sided) with FDR correction. Genes related to HMO metabolism are marked in red. Significantly enriched genes are labelled for clarity. Arrows at the top indicate the direction of species enrichment in each comparison. B. longum (BL, N=342) is shown in orange, B. breve (BB, N=267) in green, and E. faecalis (EF, N=507) in blue.

References

    1. Shao, Y. et al. Stunted microbiota and opportunistic pathogen colonization in caesarean-section birth. Nature574, 117–121 (2019). - PMC - PubMed
    1. Mitchell, C. M. et al. Delivery mode affects stability of early infant gut microbiota. Cell Rep. Med.1, 100156 (2020). - PMC - PubMed
    1. Bogaert, D. et al. Mother-to-infant microbiota transmission and infant microbiota development across multiple body sites. Cell Host Microbe31, 447–460 (2023). - PubMed
    1. Ferretti, P. et al. Mother-to-infant microbial transmission from different body sites shapes the developing infant gut microbiome. Cell Host Microbe24, 133–145 (2018). - PMC - PubMed
    1. Yassour, M. et al. Strain-level analysis of mother-to-child bacterial transmission during the first few months of life. Cell Host Microbe24, 146–154 (2018). - PMC - PubMed

LinkOut - more resources