. 2024 Oct;43(42):3094-3107.
doi: 10.1038/s41388-024-03135-9. Epub 2024 Sep 7.

Loss of DOCK2 potentiates Inflammatory Bowel Disease-associated colorectal cancer via immune dysfunction and IFNγ induction of IDO1 expression

Affiliations

Loss of DOCK2 potentiates Inflammatory Bowel Disease-associated colorectal cancer via immune dysfunction and IFNγ induction of IDO1 expression

Antonia M D Churchhouse et al. Oncogene. 2024 Oct.

Abstract

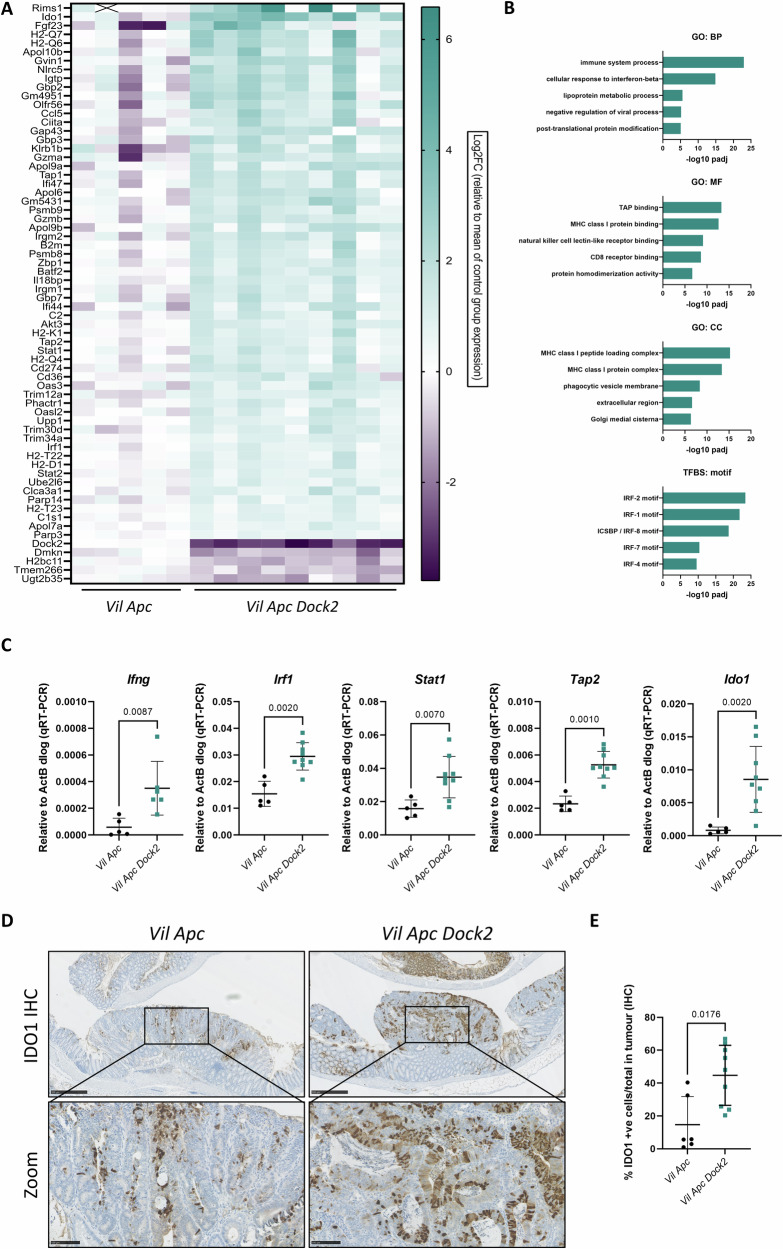
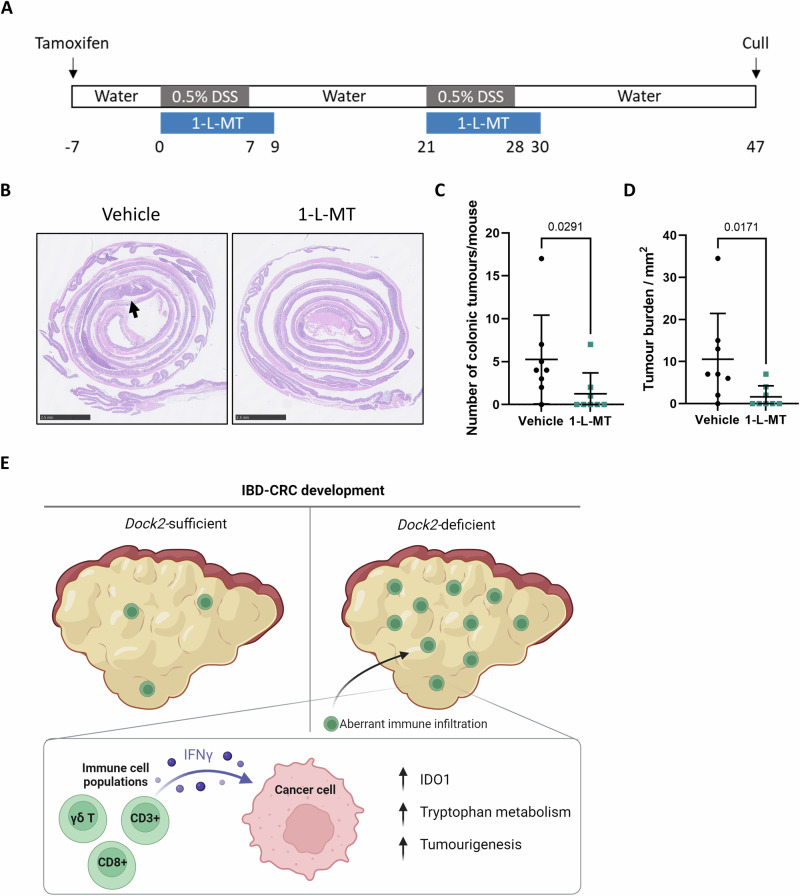
Inflammatory Bowel Disease-associated colorectal cancer (IBD-CRC) is a known and serious complication of Inflammatory Bowel Disease (IBD) affecting the colon. However, relatively little is known about the pathogenesis of IBD-associated colorectal cancer in comparison with its sporadic cancer counterpart. Here, we investigated the function of Dock2, a gene mutated in ~10% of IBD-associated colorectal cancers that encodes a guanine nucleotide exchange factor (GEF). Using a genetically engineered mouse model of IBD-CRC, we found that whole body loss of Dock2 increases tumourigenesis via immune dysregulation. Dock2-deficient tumours displayed increased levels of IFNγ-associated genes, including the tryptophan metabolising, immune modulatory enzyme, IDO1, when compared to Dock2-proficient tumours. This phenotype was driven by increased IFNγ-production in T cell populations, which infiltrated Dock2-deficient tumours, promoting IDO1 expression in tumour epithelial cells. We show that IDO1 inhibition delays tumourigenesis in Dock2 knockout mice, and we confirm that this pathway is conserved across species as IDO1 expression is elevated in human IBD-CRC and in sporadic CRC cases with mutated DOCK2. Together, these data demonstrate a previously unidentified tumour suppressive role of DOCK2 that limits IFNγ-induced IDO1 expression and cancer progression, opening potential new avenues for therapeutic intervention.


Conflict of interest statement

The authors declare no competing interests.

Figures

Fig. 1
Fig. 1. Dock2 deletion promotes colitis associated colorectal cancer.
A Schematic detailing the Apc loss-mediated mouse model of IBD-associated colorectal cancer, including inducible gene modification with tamoxifen, two rounds of 0.5% DSS, and termination at day 47 post DSS administration. B Representative H&E-stained colonic Swiss rolls, detailing tumour burden in Vil Apc and Vil Apc Dock2 mice (black arrows). Scale bars are 2.5 mm. C Tumour number in Vil Apc and Vil Apc Dock2 mice. N = 11 vs 11 mice. D Total tumour burden in Vil Apc and Vil Apc Dock2 mice. N = 11 vs 11 mice. E Representative BrdU-stained Vil Apc and Vil Apc Dock2 tumours. Scale bars are 50 μm. F Quantification of BrdU staining. N = 7 vs 11 mice. G Average tumour size in Vil Apc and Vil Apc Dock2 mice. N = 11 vs 11 mice. Data represented as mean and error bars SD. All statistical analysis for this figure was performed using two-tailed Mann–Whitney test. Exact p values are indicated in the panels.
Fig. 2
Fig. 2. Dock2 deficient tumours have elevated IFNγ signalling.
A Heatmap of genes with significantly altered expression in Vil Apc Dock2 tumour identified by RNAseq. B Gene ontology analysis of Vil Apc vs Vil Apc Dock2 tumours. The top 5 non-redundant Biological Processes (BP), Molecular Functions (MF), Cellular Components (CC) and Putative Transcription Factor Binding Sites (TFBS) are listed and corresponding –log10 padj shown. C RT-qPCR analysis of IFNγ target gene expression in Vil Apc and Vil Apc Dock2 tumours. N = 5 vs 6 tumours (Ifng) or 5 vs 9 tumours (others). D Representative IDO1-stained Vil Apc and Vil Apc Dock2 tumours. Scale bars are 500 μm and 100 μm (zoom). E Quantification of IDO1 staining. N = 6 vs 9 tumours. Data represented as mean and error bars SD. All statistical analysis for this figure was performed using two-tailed Mann–Whitney test. Exact p values are indicated in the panels.
Fig. 3
Fig. 3. IFNγ signalling is equivalent in normal and Dock2 deficient tissue.
A Collage overview of ApcKO and ApcKO Dock2 organoids. B Quantification of ApcKO and ApcKO Dock2 organoid size change 24 h post IFNγ treatment. N = 30 vs 30 vs 30 vs 30 organoids. C RT-qPCR analysis of IFNγ target gene expression in ApcKO and ApcKO Dock2 organoids 24 h post IFNγ treatment. N = 3 vs 3 vs 3 vs 3 independent technical replicates and 3 vs 3 vs 2 vs 3 independent technical replicates (Tap1). D Western blot analysis of IDO1 expression in ApcKO and ApcKO Dock2 organoids 24 h post IFNγ treatment. E Quantification of IDO1 Western blot. N = 3 vs 3 vs 3 vs 3 independent technical replicates. F Immunofluorescence staining of Ido1 expression in ApcKO organoids 24 h post IFNγ treatment. G Quantification of Ido1 staining intensity. N = 572 vs 232 organoid cells. H Quantification of % Ido1 positive cells. N = 3 vs 3 independent technical replicates. Data represented as mean and error bars SD. Statistical analysis for (B), (C) and (E) was performed using ordinary one-way ANOVA with Tukey’s multiple comparisons. Statistical analysis for (G) and (H) was performed using student T-test *p < 0.05, **p < 0.01, ***p < 0.001, ****p < 0.0001.
Fig. 4
Fig. 4. Dock2 deficient tumours have increased γδ T cell infiltration.
A Representative CD3-stained Vil Apc and Vil Apc Dock2 tumours. Scale bars are 50 μm (B) Quantification of CD3 staining. Values represent % of total tumour cells. N = 6 vs 10 mice. C Representative images of RNAscope for TRDC in tumours of Vil Apc and Vil Apc Dock2 mice. Scale bars are 100 μm. D Quantification of TRDC staining. Values represent % of total tumour cells. N = 7 vs 20 tumours. E RT-qPCR analysis of Trgv1 expression in Vil Apc and Vil Apc Dock2 tumours. N = 5 vs 9 tumours. Data represented as mean and error bars SD. All statistical analysis for this figure was performed using two-tailed Mann–Whitney test. Exact p values are indicated in the panels.
Fig. 5
Fig. 5. IFNγ producing γδ T cells are increased in Dock2 deficient colons independently of acute inflammation.
A Comparative weights of WT and Dock2 mice during treatment with 2% DSS. B Representative H&E-stained colonic Swiss rolls, detailing extent of colitis in WT and Dock2 mice. Representative areas of epithelial erosion are highlighted. Scale bars are 2.5 mm and 100 μm (zoom). C Quantification of colitic area in WT and Dock2 mice. N = 17 vs 14 mice. D Representative plots of CD3+ γδ T cells in WT and Dock2 colons at baseline or following acute DSS treatment. E Quantification of CD3+ γδ T cells. N = 3 vs 3 vs 3 vs 3 mice. F Representative plots of IFNγ producing γδ T cells in WT and Dock2 colons at baseline or following acute DSS treatment. G Quantification of IFNγ producing γδ T cells. N = 3 vs 3 vs 3 vs 3 mice. H Representative plots of IFNγ producing CD8 + T cells in WT and Dock2 colons at baseline or following acute DSS treatment. I Quantification of IFNγ producing CD8 + T cells. N = 3 vs 3 vs 3 vs 3 mice. J RT-qPCR analysis of IFNγ target gene expression in WT and Dock2 colons at baseline or following acute DSS treatment. N = 6 vs 6 vs 17 vs 14 mice. Data represented as mean and error bars SD. Statistical analysis for (C) was performed using two-tailed Mann–Whitney test. Statistical analysis for (E), (G), (I) and (J) was performed using ordinary one-way ANOVA with Tukey’s multiple comparisons. Exact p values are indicated in the panels.
Fig. 6
Fig. 6. IDO1 is elevated in human IBD-CRC and alters tryptophan metabolism in vivo.
A Representative IDO1-stained human normal colon, inflamed colon, dysplastic colon and IBD associated cancer (all regions of the same human resection specimen). Scale bars are 250 μm and 50 μm (zoom) (B) Quantification of IDO1 staining. N = 5 vs 5 vs 4 vs 12 patient samples. C Expression of IDO1 and IFNG in CRC patients with wildtype or mutated DOCK2. D Expression of IDO1 and IFNG in MSS CRC patients with wildtype or mutated DOCK2. E Survival plot of TCGA CRC dataset grouped on the mutational status of DOCK2. Note reduced survival of DOCK2 mutant patients. F Schematic outlining the tryptophan metabolism pathway. Note IDO1 catalysers the conversion of tryptophan to kynurenine. Metabolites altered in Vil Apc Dock2 tumours are highlighted in blue if downregulated (tryptophan) or red if upregulated (xanthurenate). G Volcano plot showing the polar metabolites filtered using p > 0.05 and FC > 1.3. H Individual value plots of log2 intensity values of selected metabolites. N = 12 vs 12 tumours. Data represented as mean and error bars SD. Statistical analysis for (B) was performed using ordinary one-way ANOVA with Tukey’s multiple comparisons. Statistical analysis for (C) and (D) was performed using student T-test. Statistical analysis for (H) was performed using two-tailed Mann–Whitney test. Exact p values are indicated in the panels.
Fig. 7
Fig. 7. IDO1 inhibition abrogates tumourigenesis in Vil Apc Dock2 mice.
A Schematic outlining IDO inhibitor (1-L-MT) treatment regimen in Vil Apc Dock2 mice. B Representative H&E-stained colonic swiss rolls, detailing tumour burden in vehicle and IDO1 inhibitor (1-L-MT) treated Vil Apc Dock2 mice (black arrows). Scale bars are 2.5 mm. C Tumour number in vehicle and IDO1 inhibitor treated Vil Apc Dock2 mice. D Total tumour burden in vehicle and IDO1 inhibitor treated Vil Apc Dock2 mice. N = 8 vs 8 mice. E A model outlining the proposed role of Dock2 in suppressing inflammation induced colorectal cancer. Data represented as mean and error bars SD. All statistical analysis for this figure was performed using two-tailed Mann–Whitney test. Exact p values are indicated in the panels.

References

    1. Beaugerie L, Itzkowitz SH. Cancers complicating inflammatory bowel disease. N Engl J Med. 2015;372:1441–52. - PubMed
    1. Coskun M, Vermeire S, Nielsen OH. Novel targeted therapies for inflammatory bowel disease. Trends Pharmacol Sci. 2017;38:127–42. - PubMed
    1. Jewel Samadder N, Valentine JF, Guthery S, Singh H, Bernstein CN, Wan Y, et al. Colorectal cancer in inflammatory bowel diseases: a population-based study in Utah. Dig Dis Sci. 2017;62:2126–32. - PubMed
    1. Olen O, Erichsen R, Sachs MC, Pedersen L, Halfvarson J, Askling J, et al. Colorectal cancer in ulcerative colitis: a Scandinavian population-based cohort study. Lancet. 2020;395:123–31. - PubMed
    1. Cancer Genome Atlas N. Comprehensive molecular characterization of human colon and rectal cancer. Nature. 2012;487:330–7. - PMC - PubMed

MeSH terms