. 2024 Sep 6;8(1):192.
doi: 10.1038/s41698-024-00682-y.

Amivantamab efficacy in wild-type EGFR NSCLC tumors correlates with levels of ligand expression

Affiliations

Amivantamab efficacy in wild-type EGFR NSCLC tumors correlates with levels of ligand expression

Ricardo Rivera-Soto et al. NPJ Precis Oncol. .

Abstract

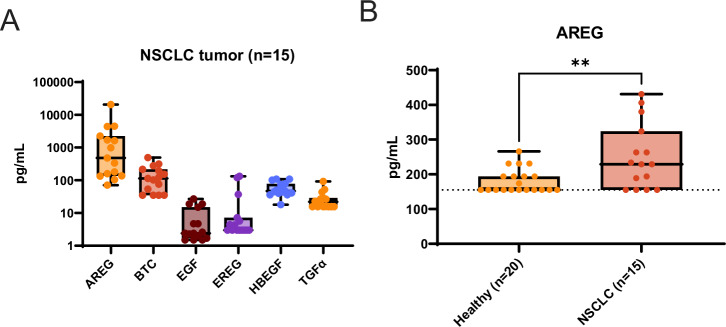
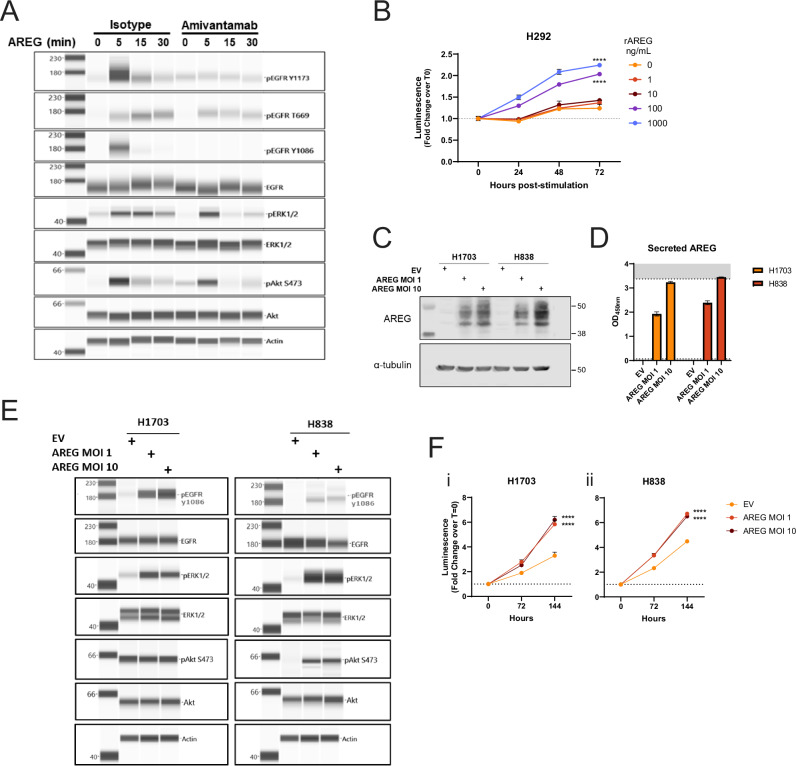
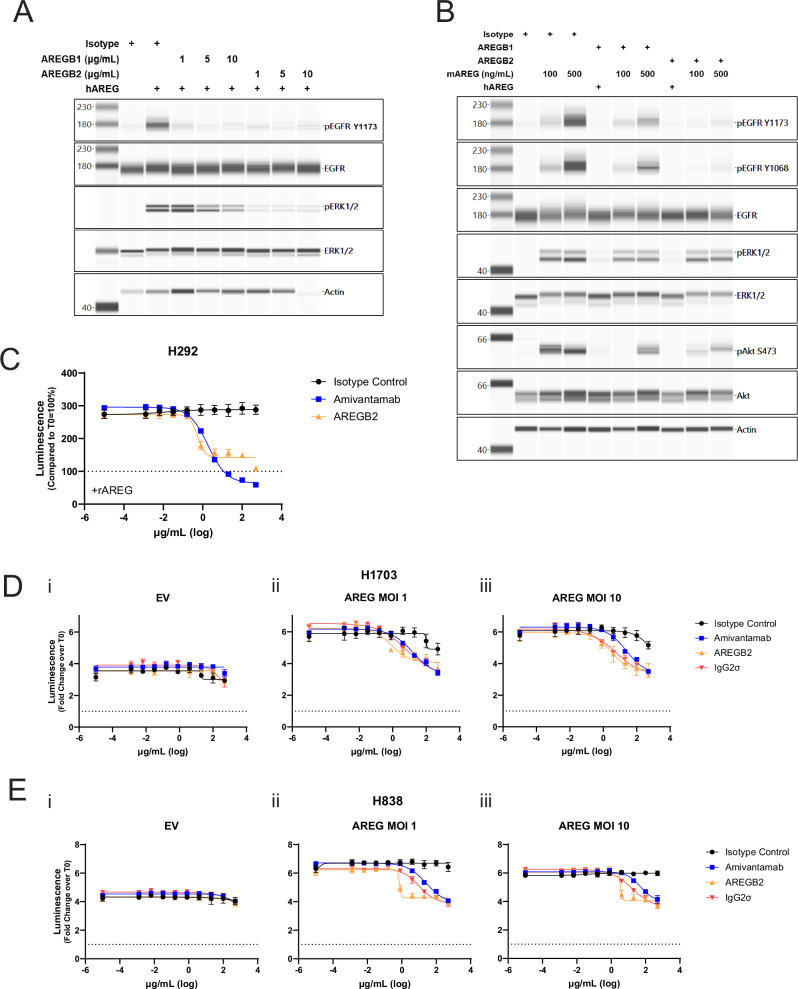
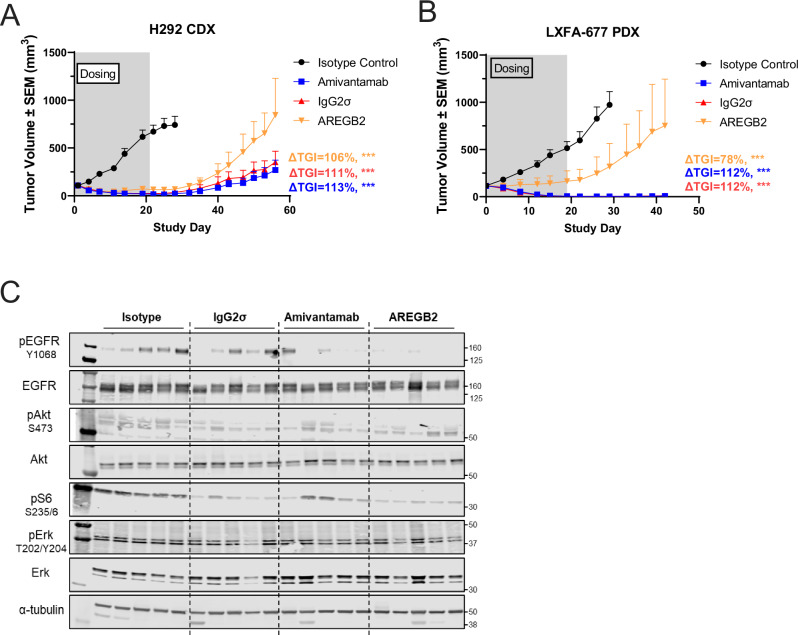
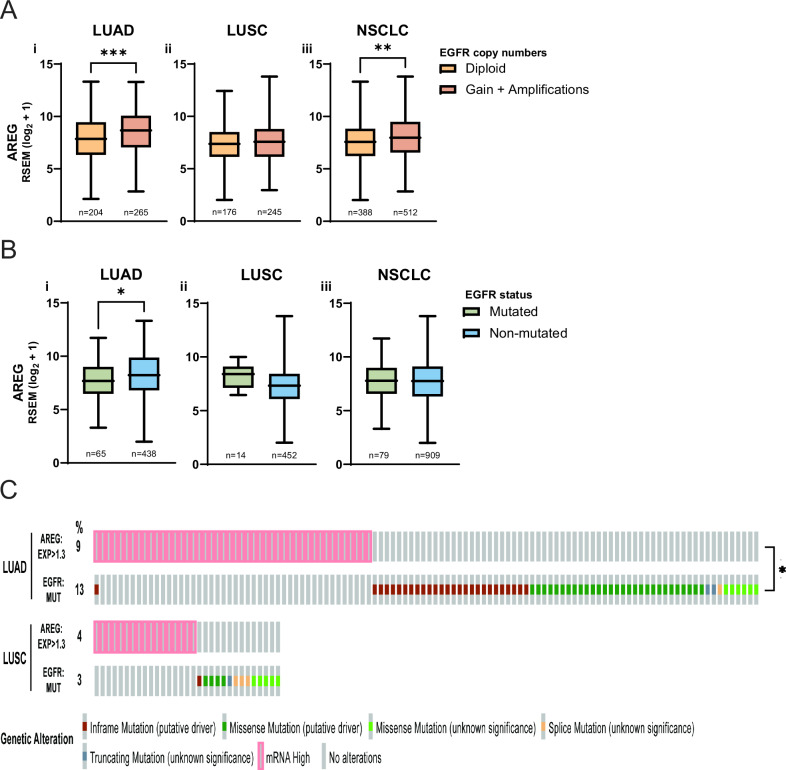
Amivantamab is an FDA-approved bispecific antibody targeting EGF and Met receptors, with clinical activity against EGFR mutant non-small cell lung cancer (NSCLC). Amivantamab efficacy has been demonstrated to be linked to three mechanisms of action (MOA): immune cell-mediated killing, receptor internalization and degradation, and inhibition of ligand binding to both EGFR and Met receptors. Among the EGFR ligands, we demonstrated that amphiregulin (AREG) is highly expressed in wild-type (WT) EGFR (EGFRWT) NSCLC primary tumors, with significantly higher circulating protein levels in NSCLC patients than in healthy volunteers. Treatment of AREG-stimulated EGFRWT cells/tumors with amivantamab or with an AREG-targeting antibody inhibited ligand-induced signaling and cell/tumor proliferation/growth. Across 11 EGFRWT NSCLC patient-derived xenograft models, amivantamab efficacy correlated with AREG RNA levels. Interestingly, in these models, amivantamab anti-tumor activity was independent of Fc engagement with immune cells, suggesting that, in this context, the ligand-blocking function is sufficient for amivantamab maximal efficacy. Finally, we demonstrated that in lung adenocarcinoma patients, high expression of AREG and EGFR mutations were mutually exclusive. In conclusion, these data 1) highlight EGFR ligand AREG as a driver of tumor growth in some EGFRWT NSCLC models, 2) illustrate the preclinical efficacy of amivantamab in ligand-driven EGFRWT NSCLC, and 3) identify AREG as a potential predictive biomarker for amivantamab activity in EGFRWT NSCLC.


Conflict of interest statement

R.R.S., B.H., S.L., H.G., M.W., S.V., T.S.Y. are current employees of Johnson & Johnson but declare no non-financial competing interests. S.L. and S.M. are former employees of Johnson & Johnson but declare no non-financial competing interests. MP and KPV declare no competing interests. S.M. and B.H. reports a patent application for US17/687,984 - Treatment of Cancers Lacking EGFR- Activating Mutations, pending. S.M reports a patent US9593164B2 - bispecific EGFR/Met antibodies, issued.

Figures

Fig. 1
Fig. 1. EGFR ligand levels in tumors and blood from NSCLC patients.
A Fresh frozen tumor tissues collected on dry ice were homogenized into protein lysates. EGFR ligand levels were measured using protein-based assays. AREG, EGF, EREG, HB-EGF ligands were measured by HCANCER2 panel, BTC level by HMPC18 panel, and TGFα levels using ELISA. B Serum AREG levels of NSCLC patients and healthy volunteers were measured by Luminex-based assay. Samples below the assay detection range are plotted at the lower limit of quantification (dotted line). P-value was determined by Tobit regression analysis, **P < 0.01. Box-and-whisker plots represents min-to-max distribution with center lines at the median.
Fig. 2
Fig. 2. AREG induces signaling and proliferation of NSCLC cell lines.
A NSCLC H292 cells were stimulated with 100 ng/mL of rAREG in the presence of 10 μg/mL of amivantamab or IgG1 isotype control (Isotype). Cells were harvested and lysed before stimulation (time 0) and at 5-, 15-, and 30 min post AREG treatment. Lysates were subjected to capillary-based electrophoresis to quantitate the levels of pEGFRY1173/T669/Y1086, EGFR, pErk1/2T202/Y204, Erk1/2, pAktS473, Akt, and actin (as loading control). Densitometry calculations are included in the Supplementary Fig. 2B. B Serum-starved H292 cells were stimulated with increasing concentrations of rAREG. Luminescence compared to T0, determined by ATP-dependent CellTiter-Glo (CTG) assay, were plotted over a time-course (24, 48, and 72 h post-stimulation). Dotted line represents T0. P-value was determined by two-way ANOVA with Dunnet’s multiple comparison tests; **** P < 0.0001. C AREG-low H1703 and H838 NSCLC cell lines were transduced at multiplicity of infection (MOI) of 1 or 10 with an AREG-containing lentiviruses or an empty vector control (EV). Equal amount of whole cell protein lysates was subjected to western blotting for AREG and loading control α-tubulin. The densitometry calculations are included in the Supplementary Fig. 2G. D Cell-free supernatants from H1703 and H838 cells stably expressing AREG were collected and AREG secretion measured by ELISA. Gray areas = above/below the limit of detection. E Stably expressing AREG H1703 and H838 cells were cultured overnight in low-serum conditions (1%) and whole cell lysates were collected and subjected to capillary-based electrophoresis for pEGFRY1086, EGFR, pErk1/2T202/4, Erk1/2, pAktS473, Akt, and β-actin detection and quantification. The densitometry calculations are included in the Supplementary Fig. 2G. F H1703 (i) and H838 (ii) cells were cultured for up to 6 days (144 h) in low serum (1%) and cell number measured by CTG to determine cell proliferation over time (0, 72, and 144 h). Dotted line represents T0. P-value was determined by two-way ANOVAs with Dunnet’s multiple comparison tests, ****P < 0.0001.
Fig. 3
Fig. 3. Amivantamab and AREG-neutralizing antibodies block AREG-induced signaling and cell proliferation.
A H292 cells were treated with a titration (1–10 μg/mL) of AREG-neutralizing antibodies AREGB1 (AR554) and AREGB2 (AR37), or 10 μg/mL of an IgG1 isotype control for five minutes in serum-free media. Cells were then stimulated with 100 ng/mL of recombinant human AREG (rhAREG) and harvested 15 min post-stimulation. Cells were lysed, and protein lysates were processed through capillary-based electrophoresis to quantitate levels of pEGFRY1173, EGFR, pErk1/2T202/Y204, Erk1/2, and control actin. The densitometry calculations for A are included in the Supplementary Fig. 3A. B H292 cells were treated with 5 μg/mL of AREGB1, AREGB2, or 10 μg/mL of isotype control for five minutes in serum-free media. Cells were then stimulated with 100 ng/mL of rhAREG, or 100 and 500 ng/mL of recombinant mouse AREG and harvested 15 min post-stimulation. Cells were lysed, and protein lysates were processed through simple western to quantitate levels of pEGFRY1173/Y1068, EGFR, pErk1/2T202/Y204, Erk1/2, pAktS473, Akt, and control actin. The densitometry calculations for B are included in the Supplementary Fig. 3B. C H292 cells were stimulated at days 0 and 3 with 100 ng/mL of rAREG and plated in 96-well plate. Cells in 1% FBS were treated with increasing concentrations of the IgG1 isotype control (black), amivantamab (blue), or AREGB2 (orange) for up to 6 days. Cell numbers on days 0, 3, and 6 were quantitated by CTG assay. The luminescence signals obtained at day 6 were normalized to their respective day 0 measurement (100%, dotted line). Day 3 data are included in the Supplementary Fig. 3D. H1703 (D) and H838 (E) cells previously transfected with EV (i) or AREG expressing lentivirus at MOI 1 (ii) or 10 (iii) (AREG-OE) were cultured at low-serum concentrations (1%) for up to six days in presence of increasing concentrations of IgG1 Isotype control (black), amivantamab (blue), EGFR/MET Fc-silent antibody (IgG2σ; red), or AREGB2 (orange). Cell numbers were quantitated by CTG to determine cell proliferation by comparing the luminescence signals obtained at day 6 with their respective day 0 measurement (dotted line). Day 3 data are included in the Supplementary Fig. 3F, G.
Fig. 4
Fig. 4. AREG is a driver of EGFRWT tumor growth which is inhibited by amivantamab.
The H292 (A) and LXFA-677 (B) non-small cell lung cancer (NSCLC) xenografts models were implanted subcutaneously in nude mice. After tumors reached 100–150 mm3, mice were randomized into four arms and treated i.p. twice a week with 10 mg/kg of IgG1 Isotype control (black), amivantamab (blue), EGFRxMet Fc-silent antibody (IgG2σ; red), or AREGB2 (orange) for 3 weeks (gray background). Tumor sizes were measured with caliper thrice per week. Change in tumor growth inhibition (ΔTGI) was calculated on days 28 (A) and 29 (B). Error bars represent the standard error of the mean. C Animals harboring the LXFA-677 tumors were treated for 24 h as in A, but tumor harvested immediately after animal euthanasia and snap-frozen in liquid nitrogen. Protein lysates were prepared from the tumors and subjected to western blotting for quantitation of pEGFRY1068, EGFR, pAktS473, Akt, pS6S235/6, pErk1/2T202/Y204, Erk1/2, and control α-tubulin. P-value was determined by Walt-type statistics, ***P < 0.001. The densitometry calculations are included in the Supplementary Fig. 4E.
Fig. 5
Fig. 5. AREG level of expression correlates with amivantamab efficacy against EGFRWT NSCLC PDX models independent of amivantamab Fc function.
A Ten EGFRWT NSCLC PDX models were established in mice and treated for 3-4 weeks twice a week with 10 mg/kg of either Isotype control, amivantamab, or IgG2σ. The ΔTGI (%) exerted by either amivantamab (blue) or IgG2σ (red) was calculated one week post treatment completion. IgG2σ was not evaluated in the LXFA-629 model. The ΔTGI induced by IgG2σ in the LXAA-SMTCA62 model was found to be a significant outlier and excluded from the analysis. Error bars represent the standard error of the mean. B Amivantamab (i) and IgG2σ (ii) ΔTGI (%) were determined against these NSCLC PDX models and plotted against EGFR ligand AREG RNA levels (transcripts per million, TPM) determined by RNAseq analysis. Spearman’s correlation were calculated for ligand: treatment relationship.
Fig. 6
Fig. 6. High AREG expression is mutually exclusive to EGFR aberration in NSCLC and AREG expression is significantly higher in EGFRWT versus mutated in LUAD.
The AREG RNA expression (RSEM) of NSCLC patients available from TCGA was graphed according to EGFR copy number (A) and status (B). P-values were determined by unpaired Student’s t-test, *P < 0.05; **P < 0.01; ***P < 0.001. Box-and-whisker plots represents min-to-max distribution with center lines at the median. C Oncoprints displays the patients with the highest levels of AREG expression (Z-score >1.3) and the mutational landscape for EGFR in LUAD and LUSC patients. P-value was determined by Fisher’s Exact test, * P < 0.05.

References

    1. Herbst, R. S., Morgensztern, D. & Boshoff, C. The biology and management of non-small cell lung cancer. Nature553, 446–454 (2018). 10.1038/nature25183 - DOI - PubMed
    1. Singh, B., Carpenter, G. & Coffey, R. J. EGF receptor ligands: recent advances. F1000Res5, 2270 (2016).10.12688/f1000research.9025.1 - DOI - PMC - PubMed
    1. Zhang, Y. et al. Function of the c-Met receptor tyrosine kinase in carcinogenesis and associated therapeutic opportunities. Mol. Cancer17, 45 (2018). 10.1186/s12943-018-0796-y - DOI - PMC - PubMed
    1. Moores, S. L. et al. A Novel Bispecific Antibody Targeting EGFR and cMet Is Effective against EGFR Inhibitor–Resistant Lung Tumors. Cancer Res.76, 3942–3953 (2016). 10.1158/0008-5472.CAN-15-2833 - DOI - PubMed
    1. Neijssen, J. et al. Discovery of amivantamab (JNJ-61186372), a bispecific antibody targeting EGFR and MET. J. Biol. Chem.296, 100641 (2021). 10.1016/j.jbc.2021.100641 - DOI - PMC - PubMed

LinkOut - more resources