. 2024 Oct;27(10):2033-2045.
doi: 10.1038/s41593-024-01731-2. Epub 2024 Sep 6.

Dissociative and prioritized modeling of behaviorally relevant neural dynamics using recurrent neural networks

Affiliations

Dissociative and prioritized modeling of behaviorally relevant neural dynamics using recurrent neural networks

Omid G Sani et al. Nat Neurosci. 2024 Oct.

Abstract

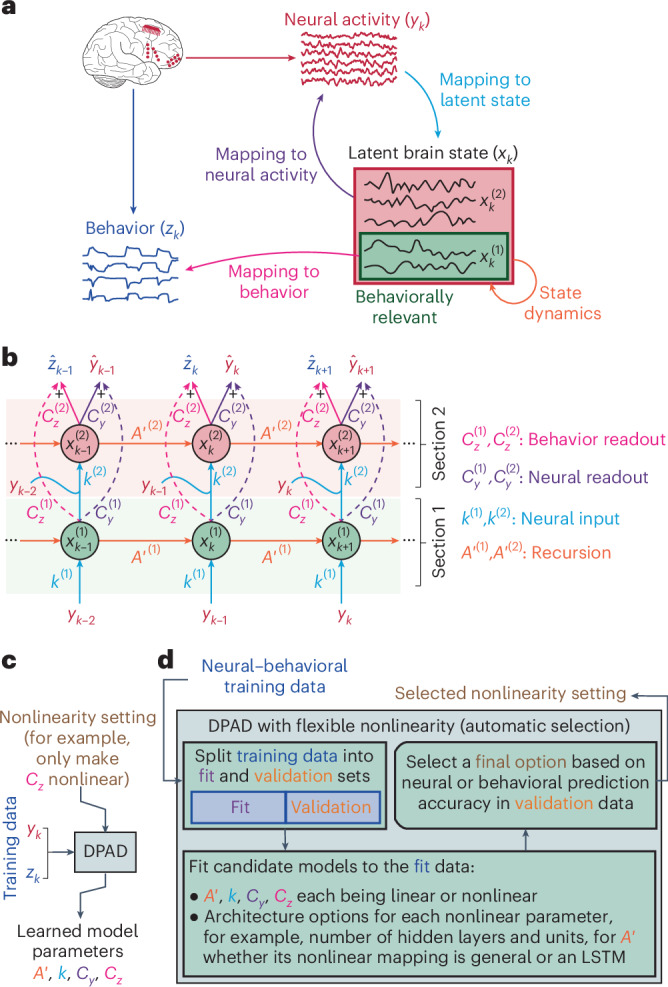
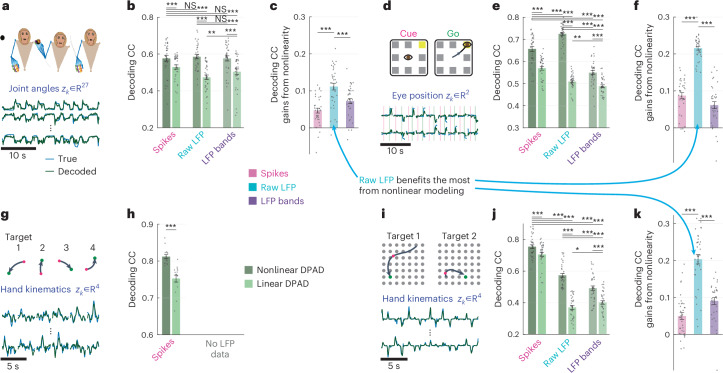
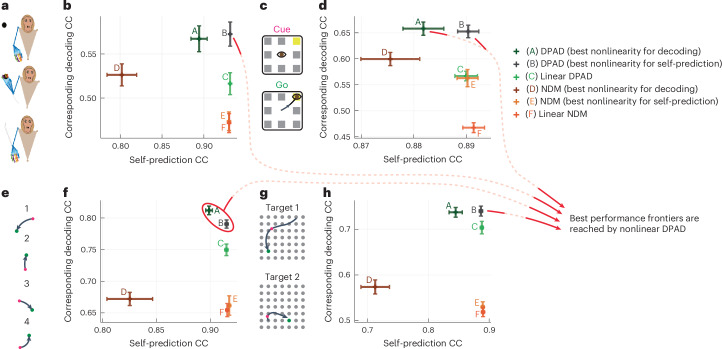
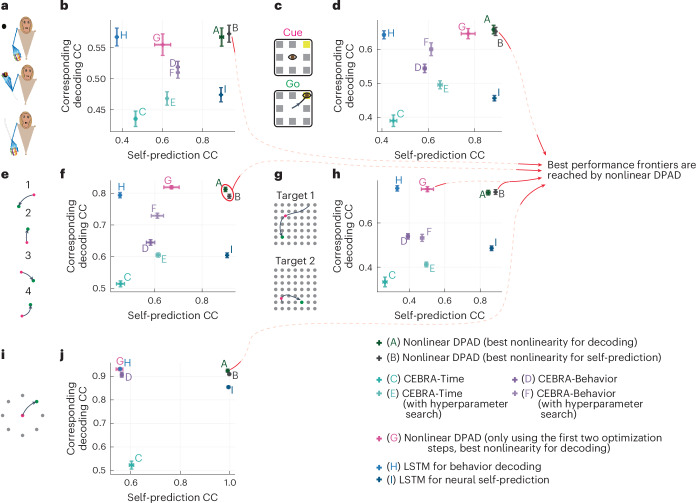
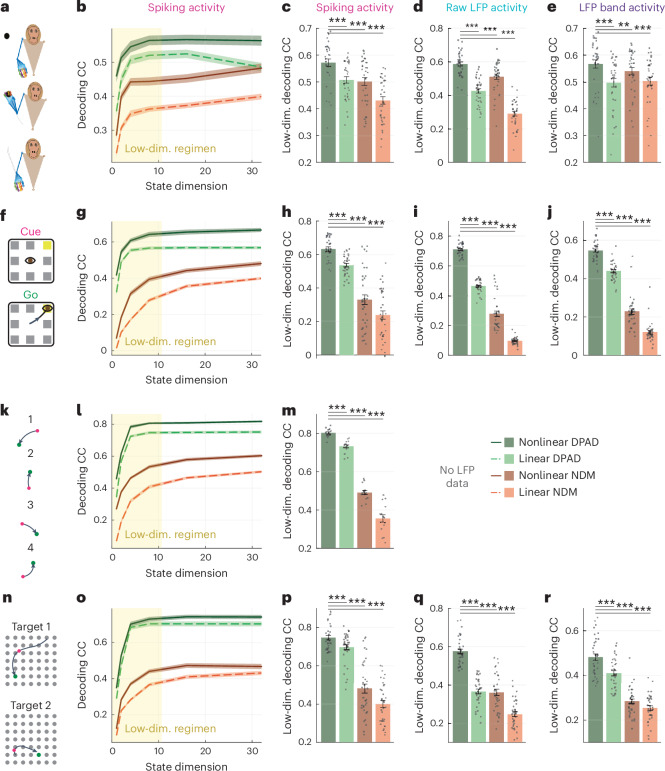
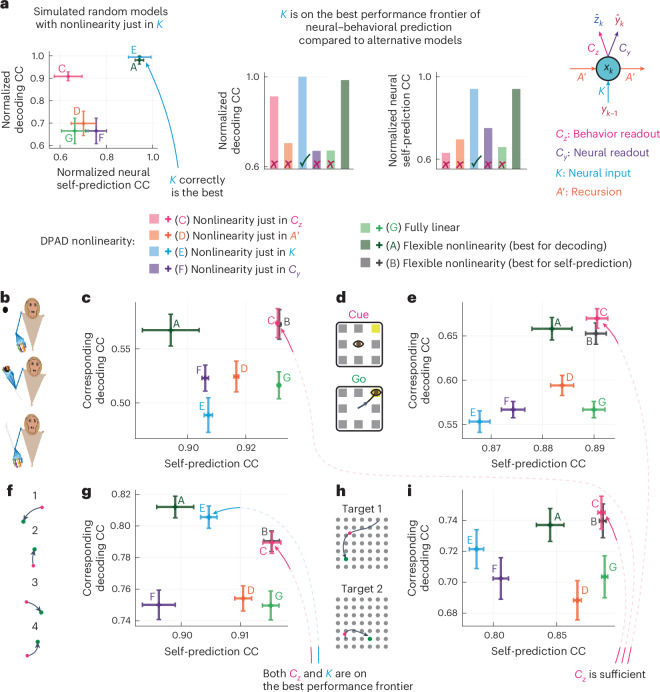
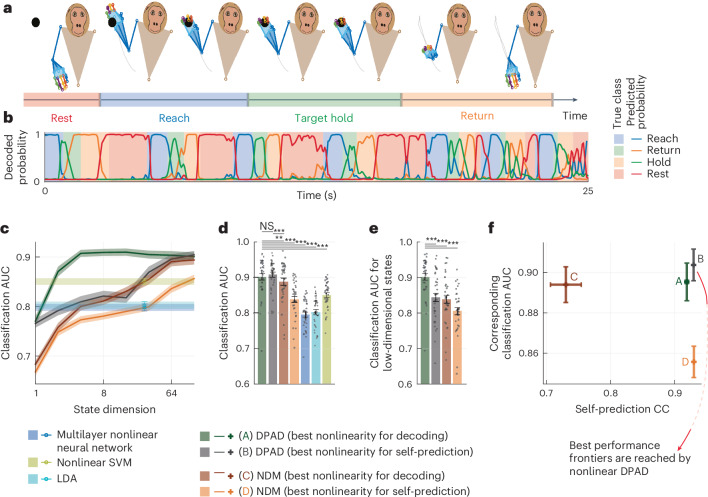
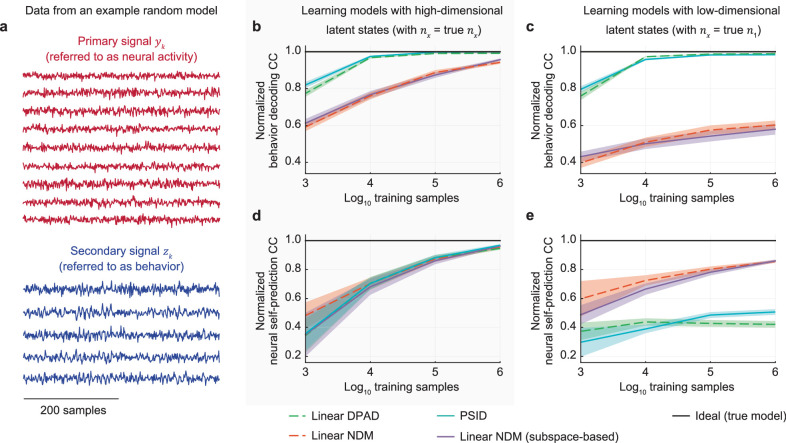
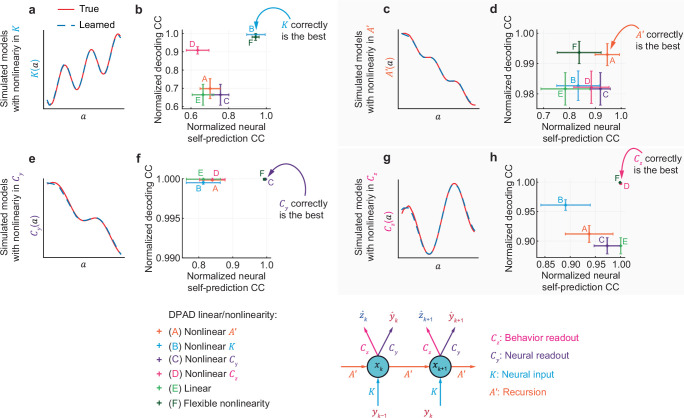
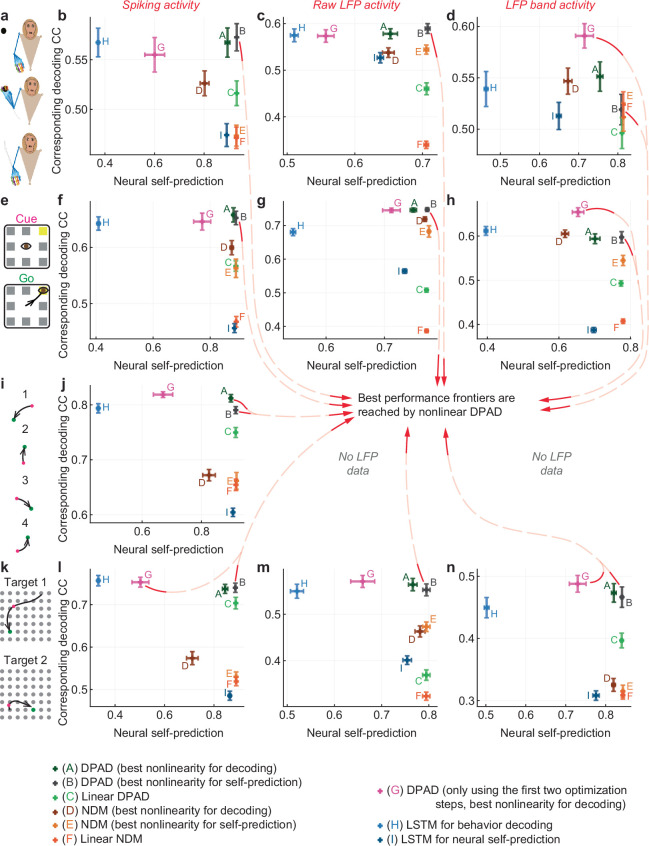
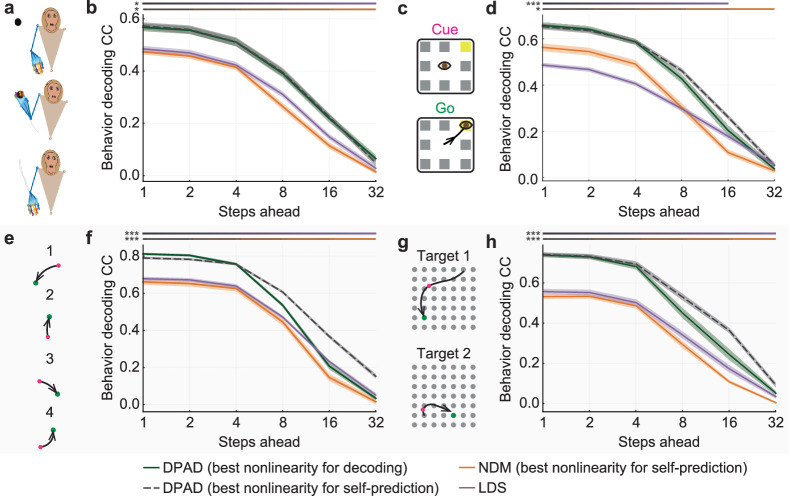
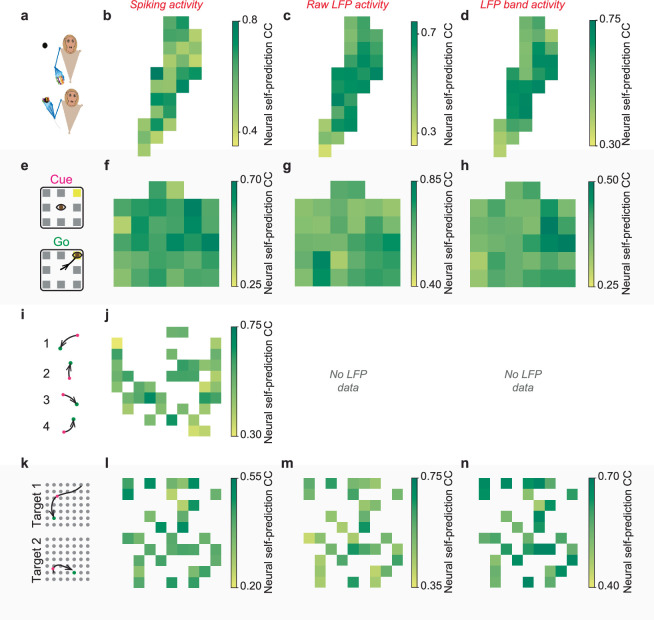
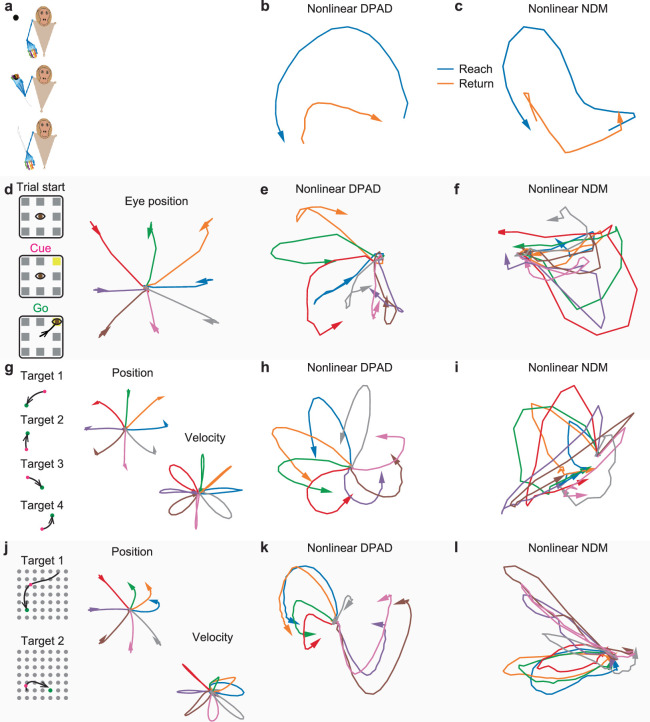
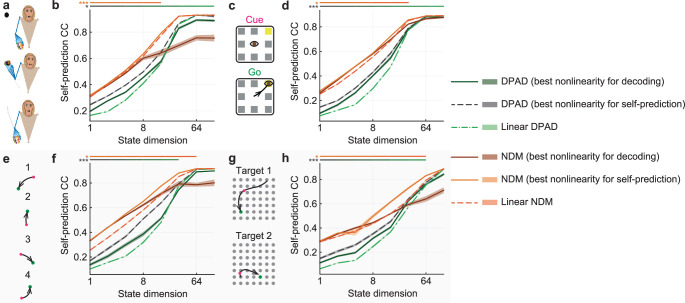
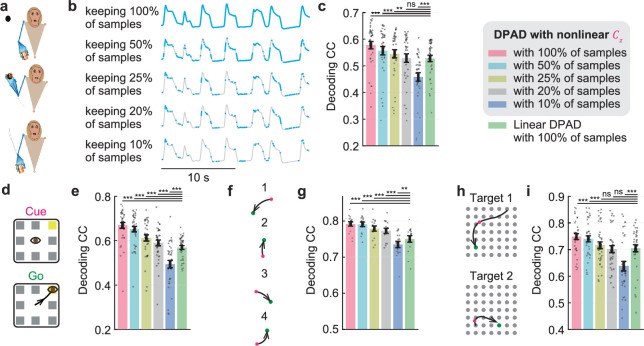
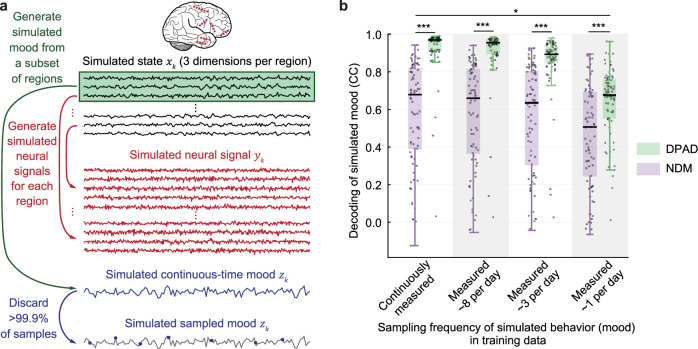
Understanding the dynamical transformation of neural activity to behavior requires new capabilities to nonlinearly model, dissociate and prioritize behaviorally relevant neural dynamics and test hypotheses about the origin of nonlinearity. We present dissociative prioritized analysis of dynamics (DPAD), a nonlinear dynamical modeling approach that enables these capabilities with a multisection neural network architecture and training approach. Analyzing cortical spiking and local field potential activity across four movement tasks, we demonstrate five use-cases. DPAD enabled more accurate neural-behavioral prediction. It identified nonlinear dynamical transformations of local field potentials that were more behavior predictive than traditional power features. Further, DPAD achieved behavior-predictive nonlinear neural dimensionality reduction. It enabled hypothesis testing regarding nonlinearities in neural-behavioral transformation, revealing that, in our datasets, nonlinearities could largely be isolated to the mapping from latent cortical dynamics to behavior. Finally, DPAD extended across continuous, intermittently sampled and categorical behaviors. DPAD provides a powerful tool for nonlinear dynamical modeling and investigation of neural-behavioral data.


Conflict of interest statement

University of Southern California has a patent related to modeling and decoding of shared dynamics between signals in which M.M.S. and O.G.S. are inventors. The other author declares no competing interests.

Figures

Fig. 1
Fig. 1. DPAD overview.
a, DPAD decomposes the neural–behavioral transformation into four interpretable mapping elements. It learns the mapping of neural activity (yk) to latent states (xk), termed neural input in the model; learns the dynamics or temporal structure of the latent states, termed recursion in the model; dissociates the behaviorally relevant latent states (xk1) that are relevant to a measured behavior (zk) from other states (xk2); learns the mapping of the latent states to behavior and to neural activity, termed behavior and neural readouts in the model; and allows flexible linear or nonlinear mappings in any of its elements. DPAD additionally prioritizes the learning of behaviorally relevant neural dynamics to learn them accurately. b, Computation graph of the DPAD model consists of a two-section RNN whose input is neural activity at the current time step and whose outputs are the predicted behavior and neural activity in the next time step (Methods). This graph assumes that computations are Markovian, that is, with a high enough dimension, latent states can summarize the information from past neural data that is useful for predicting future neural–behavioral data. Each of the four mapping elements from a has a corresponding parameter in each section of the RNN model, indicated by the same colors and termed as introduced in a. c, We developed a four-step optimization method to learn all the model parameters from training neural–behavioral data (Supplementary Fig. 1a). Further, each model parameter can be specified via the ‘nonlinearity setting’ to be linear or nonlinear with various options to implement the nonlinearity (Supplementary Fig. 1b,c). After a model is learned, only past neural activity is used to decode behavior and predict neural activity using the computation graph in b. d, DPAD also has the option of automatically selecting the ‘nonlinearity setting’ for the data by fitting candidate models and comparing them in terms of both behavior decoding and neural self-prediction accuracy (Methods). In this work, we chose among 90 candidate models with various nonlinearity settings (Methods). We refer to this automatic selection of nonlinearity as ‘DPAD with flexible nonlinearity’.
Fig. 2
Fig. 2. DPAD learns more accurate models of behaviorally relevant neural dynamics for all neural modalities by capturing nonlinearities, with raw LFP activity benefiting the most from nonlinear modeling.
a, The 3D reach task, along with example true and decoded behavior dimensions, decoded from spiking activity using DPAD, with more example trajectories for all modalities shown in Supplementary Fig. 3. b, Cross-validated decoding accuracy correlation coefficient (CC) achieved by linear and nonlinear DPAD. Results are shown for spiking activity, raw LFP activity and LFP band power activity (Methods). For nonlinear DPAD, the nonlinearities are selected automatically based on the training data to maximize behavior decoding accuracy (that is, flexible nonlinearity). The latent state dimension in each session and fold is chosen (among powers of 2 up to 128) as the smallest that reaches peak decoding in the training data among all state dimensions (Methods). Bars show the mean, whiskers show the s.e.m., and dots show all data points (N = 35 session-folds). Asterisks (*) show significance level for a one-sided Wilcoxon signed-rank test (*P < 0.05, **P < 0.005 and ***P < 0.0005); NS, not significant. c, The difference between the nonlinear and linear results from b shown with the same notations. df, Same as ac for the second dataset with saccadic eye movements (N = 35 session-folds). g,h, Same as a and b for the third dataset, which did not include LFP data, with sequential cursor reaches controlled via a 2D manipulandum (N = 15 session-folds). Behavior consists of the 2D position and velocity of the cursor, denoted as ‘hand kinematics’ in the figure. ik, Same as ac for the fourth dataset, with random grid virtual reality cursor reaches controlled via fingertip movement (N = 35 session-folds). For all DPAD variations, only the first two optimization steps were used in this figure (that is, n1 = nx) to only focus on learning behaviorally relevant neural dynamics. Source data
Fig. 3
Fig. 3. DPAD more accurately learns behaviorally relevant neural dynamics while also capturing overall neural dynamics as accurately as other methods.
a, The 3D reach task. b, Cross-validated neural self-prediction accuracy (CC) achieved by each method shown on the horizontal axis versus the corresponding behavior decoding accuracy on the vertical axis for modeling spiking activity. Latent state dimension for each method in each session, and fold is chosen (among powers of 2 up to 128) as the smallest that reaches peak neural self-prediction in training data or reaches peak decoding in training data, whichever is larger (Methods). The plus on the plot shows the mean self-prediction and decoding accuracy across sessions and folds (N = 35 session-folds), and the horizontal and vertical whiskers show the s.e.m. for these two measures, respectively. Capital letter annotations denote the methods according to the legend to make the plots more accessible. Models whose self-prediction and decoding accuracy measures lead to values toward the top-rightmost corner of the plot lie on the best performance frontier (indicated by red arrows) as they have better performance in both measures and thus better explain the neural–behavioral data (Methods). c,d, Same as a and b for the second dataset with saccadic eye movements (N = 35 session-folds). e,f, Same as a and b for the third dataset, with sequential cursor reaches controlled via a 2D manipulandum (N = 15 session-folds). g,h, Same as a and b for the fourth dataset with random grid virtual reality cursor reaches controlled via fingertip position (N = 35 session-folds). For all DPAD variations, the first 16 latent state dimensions are learned using the first two optimization steps, and the remaining dimensions are learned using the last two optimization steps (that is, n1 = 16). For nonlinear DPAD/NDM, we fit models with different combinations of nonlinearities and then select a final model among these fitted models based on either decoding or self-prediction accuracy in the training data and report both sets of results (Supplementary Fig. 1 and Methods). DPAD with nonlinearity selected based on neural self-prediction was better than all other methods overall (b, d, f and h). Source data
Fig. 4
Fig. 4. DPAD outperforms various existing methods in neural–behavioral prediction.
ah, Figure content is parallel to Fig. 3 (with pluses and whiskers defined in the same way) but instead of NDM shows CEBRA and LSTM networks as baselines (Methods). i,j, Here, we also add a fifth dataset (Methods), where in each trial an NHP moves a cursor from a center point to one of eight peripheral targets (i). In this fifth dataset (N = 5 folds), we use the exact CEBRA hyperparameters that were used for this dataset from the paper introducing CEBRA. In the other four datasets (N = 35 session-folds in b,d and h and N = 15 session-folds in f), we also show CEBRA results for when hyperparameters are picked based on an extensive search (Methods). Two types of LSTM networks are shown, one fitted to decode behavior from neural activity and another fitted to predict the next time step of neural activity (self-prediction). We also show the results for DPAD when only using the first two optimization steps. Note that CEBRA-Behavior (denoted by D and F), LSTM for behavior decoding (denoted by H) and DPAD when only using the first two optimization steps (denoted by G) dedicate all their latent states to behavior-related objectives (for example, prediction or contrastive loss), whereas other methods dedicate some or all latent states to neural self-prediction. As in Fig. 3, the final latent dimension for each method in each session and fold is chosen (among powers of 2 up to 128) as the smallest that reaches peak neural self-prediction in training data or reaches peak decoding in training data, whichever is larger (Methods). Across all datasets, DPAD outperforms baseline methods in terms of cross-validated neural–behavioral prediction and lies on the best performance frontier. For a summary of the fundamental differences in goals and capabilities of these methods, see Extended Data Table 1. Source data
Fig. 5
Fig. 5. DPAD enables nonlinear and prioritized dynamical dimensionality reduction, thus learning more accurate models of behaviorally relevant neural dynamics with lower-dimensional latent states.
a, The 3D reach task. b, Cross-validated decoding accuracy (CC) achieved by variations of linear/nonlinear DPAD/NDM for different latent state dimensions. For nonlinear DPAD/NDM, the nonlinearities are selected automatically based on the training data to maximize behavior decoding accuracy (flexible nonlinearity). Solid lines show the average across sessions and folds (N = 35 session-folds), and the shaded areas show the s.e.m.; Low-dim., low-dimensional. c, Decoding accuracy of nonlinear DPAD versus linear DPAD and nonlinear/linear NDM at the latent state dimension for which DPAD reaches within 5% of its peak decoding accuracy in the training data across all latent state dimensions. Bars, whiskers, dots and asterisks are defined as in Fig. 2b (N = 35 session-folds). d, Same as c for modeling of raw LFP (N = 35 session-folds). e, Same as c for modeling of LFP band power activity (N = 35 session-folds). fj, Same as ae for the second dataset with saccadic eye movements (N = 35 session-folds). km, Same as ac for the third dataset, which did not include LFP data, with sequential cursor reaches controlled via a 2D manipulandum (N = 15 session-folds). nr, Same as ae for the fourth dataset, with random grid virtual reality cursor reaches controlled via fingertip position (N = 35 session-folds). For all DPAD variations, only the first two optimization steps were used in this figure (that is, n1 = nx) to only focus on learning behaviorally relevant neural dynamics in the dimensionality reduction regimen. Source data
Fig. 6
Fig. 6. DPAD reveals that across our datasets, nonlinearities can be largely captured in the behavior readout of the model.
a, The process of determining the origin of nonlinearity via hypothesis testing shown with an example simulation. Simulation results are taken from Extended Data Fig. 2b, and the origin is correctly identified as K. Pluses and whiskers are defined as in Fig. 3 (N = 20 random models). b, The 3D reach task. c, DPAD’s hypothesis testing. Cross-validated neural self-prediction accuracy (CC) for each nonlinearity and the corresponding decoding accuracy. DPAD variations that have only one nonlinear parameter (for example, Cz) use a nonlinear neural network for that parameter and keep all other parameters linear. Linear and flexible nonlinear results are as in Fig. 3. Latent state dimension in each session and fold is chosen (among powers of 2 up to 128) as the smallest that reaches peak neural self-prediction in training data or reaches peak decoding in training data, whichever is larger (Methods). Pluses and whiskers are defined as in Fig. 3 (N = 35 session-folds). Annotated arrows indicate any individual nonlinearities that are on the best performance frontier compared to all other models. Results are shown for spiking activity here and for raw LFP and LFP power activity in Supplementary Fig. 6. d,e, Same as b and c for the second dataset with saccadic eye movements (N = 35 session-folds). f,g, Same as b and c for the third dataset, with sequential cursor reaches controlled via a 2D manipulandum (N = 15 session-folds). h,i, Same as b and c for the fourth dataset, with random grid virtual reality cursor reaches controlled via fingertip position (N = 35 session-folds). For all DPAD variations, the first 16 latent state dimensions are learned using the first two optimization steps, and the remaining dimensions are learned using the last two optimization steps (that is, n1 = 16). Source data
Fig. 7
Fig. 7. DPAD extends to modeling categorical behaviors.
a, In the 3D reach dataset, we model spiking activity along with the epoch of the task as discrete behavioral data (Methods and Fig. 2a). The epochs/classes are (1) reaching toward the target, (2) holding the target, (3) returning to resting position and (4) resting until the next reach. b, DPAD’s predicted probability for each class is shown in a continuous segment of the test data. Most of the time, DPAD predicts the highest probability for the correct class. c, The cross-validated behavior classification performance, quantified as the area under curve (AUC) for the four-class classification, is shown for different methods at different latent state dimensions. Solid lines and shaded areas are defined as in Fig. 5b (N = 35 session-folds). AUC of 1 and 0.5 indicate perfect and chance-level classification, respectively. We include three nondynamic/static classification methods that map neural activity for a given time step to class label at the same time step (Extended Data Table 1): (1) multilayer neural network, (2) nonlinear support vector machine (SVM) and (3) linear discriminant analysis (LDA). d, Cross-validated behavior classification performance (AUC) achieved by each method when choosing the state dimension in each session and fold as the smallest that reaches peak classification performance in the training data among all state dimensions with that method (Methods). Bars, whiskers, dots and asterisks are defined as in Fig. 2b (N = 35 session-folds). e, Same as d when all methods use the same latent state dimension as DPAD (best nonlinearity for decoding) does in d (N = 35 session-folds). c and e show DPAD’s benefit for dimensionality reduction. f, Cross-validated neural self-prediction accuracy achieved by each method versus the corresponding behavior classification performance. Here, the latent state dimension for each method in each session and fold is chosen (among powers of 2 up to 128) as the smallest that reaches peak neural self-prediction in training data or reaches peak decoding in training data, whichever is larger (Methods). Pluses and whiskers are defined as in Fig. 3 (N = 35 session-folds). Source data
Extended Data Fig. 1
Extended Data Fig. 1. DPAD dissociates and prioritizes the behaviorally relevant neural dynamics while also learning the other neural dynamics in numerical simulations of linear models.
a, Example data generated from one of 100 random models (Methods). These random models do not emulate real data but for terminological consistency, we still refer to the primary signal (that is, yk in Eq. (1)) as the ‘neural activity’ and to the secondary signal (that is, zk in Eq. (1)) as the ‘behavior’. b, Cross-validated behavior decoding accuracy (correlation coefficient, CC) for each method as a function of the number of training samples when we use a state dimension equal to the total state dimension of the true model. The performance measures for each random model are normalized by their ideal values that were achieved by the true model itself. Performance for the true model is shown in black. Solid lines and shaded areas are defined as in Fig. 5b (N = 100 random models). c, Same as b but when learned models have low-dimensional latent states with enough dimensions just for the behaviorally relevant latent states (that is, nx = n1). d-e, Same as b-c showing the cross-validated normalized neural self-prediction accuracy. Linear NDM, which learns the parameters using a numerical optimization, performs similarly to a linear algebraic subspace-based implementation of linear NDM, thus validating NDM’s numerical optimization implementation. Linear DPAD, just like PSID, achieves almost ideal behavior decoding even with low-dimensional latent states (c); this shows that DPAD correctly dissociates and prioritizes behaviorally relevant dynamics, as opposed to aiming to simply explain the most neural variance as non-prioritized methods such as NDM do. For this reason, with a low-dimensional state, non-prioritized NDM methods can explain neural activity well (e) but prioritized methods can explain behavior much better (c). Nevertheless, using the second stage of PSID and the last two optimization steps in DPAD, these two prioritized techniques are still able to learn the overall neural dynamics accurately if state dimension is high enough (d). Overall, the performance of linear DPAD and PSID are similar for the special case of linear modeling.
Extended Data Fig. 2
Extended Data Fig. 2. DPAD successfully identifies the origin of nonlinearity and learns it in numerical simulations.
DPAD can perform hypothesis testing regarding the origin of nonlinearity by considering both behavior decoding (vertical axis) and neural self-prediction (horizontal axis). a, True value for nonlinear neural input parameter K in an example random model with nonlinearity only in K and the nonlinear value that DPAD learned for this parameter when only K in the learned model was set to be nonlinear. The true and learned mappings match and almost exactly overlap. b, Behavior decoding and neural self-prediction accuracy achieved by DPAD models with different locations of nonlinearities. These accuracies are for data generated from 20 random models that only had nonlinearity in the neural input parameter K. Performance measures for each random model are normalized by their ideal values that were achieved by the true model itself. Pluses and whiskers are defined as in Fig. 3 (N = 20 random models). c,d, Same as a,b for data simulated from models that only have nonlinearity in the recursion parameter A′. e-f, Same as a,b for data simulated from models that only have nonlinearity in the neural readout parameter Cy. g,h, Same as a,b for data simulated from models that only have nonlinearity in the behavior readout parameter Cz. In each case (b,d,f,h), the nonlinearity option that reaches closest to the upper-rightmost corner of the plot, that is, has both the best behavior decoding and the best neural self-prediction, is chosen as the model that specifies the origin of nonlinearity. Regardless of the true location of nonlinearity (b,d,f,h), always the correct location (for example, K in b) achieves the best performance overall compared with all other locations of nonlinearities. These results provide evidence that by fitting and comparing DPAD models with different nonlinearities, we can correctly find the origin of nonlinearity in simulated data.
Extended Data Fig. 3
Extended Data Fig. 3. Across spiking and LFP neural modalities, DPAD is on the best performance frontier for neural-behavioral prediction unlike LSTMs, which are fitted to explain neural data or behavioral data.
a, The 3D reach task. b, Cross-validated neural self-prediction accuracy achieved by each method versus the corresponding behavior decoding accuracy on the vertical axis. Latent state dimension for each method in each session and fold is chosen (among powers of 2 up to 128) as the smallest that reaches peak neural self-prediction in training data or reaches peak decoding in training data, whichever is larger (Methods). Pluses and whiskers are defined as in Fig. 3 (N = 35 session-folds). Note that DPAD considers an LSTM as a special case (Methods). Nevertheless, results are also shown for LSTM networks fitted to decode behavior from neural activity (that is, RNN decoders in Extended Data Table 1) or to predict the next time step of neural activity (self-prediction). Also, note that LSTM for behavior decoding (denoted by H) and DPAD when only using the first two optimization steps (denoted by G) dedicate all their latent states to behavior prediction, whereas other methods dedicate some or all latent states to neural self-prediction. Compared with all methods including these LSTM networks, DPAD always reaches the best performance frontier for predicting the neural-behavioral data whereas LSTM does not; this is partly due to the four-step optimization algorithm in DPAD that allows for overall neural-behavioral description rather than one or the other, and that prioritizes the learning of the behaviorally relevant neural dynamics. c, Same as b for raw LFP activity (N = 35 session-folds). d, Same as b for LFP band power activity (N = 35 session-folds). e-h, Same as a-d for the second dataset, with saccadic eye movements (N = 35 session-folds). i,j, Same as a and b for the third dataset, with sequential cursor reaches controlled via a 2D manipulandum (N = 15 session-folds). k-n, Same as a-d for the fourth dataset, with random grid virtual reality cursor reaches controlled via fingertip position (N = 35 session-folds). Results and conclusions are consistent across all datasets. Source data
Extended Data Fig. 4
Extended Data Fig. 4. DPAD can also be used for multi-step-ahead forecasting of behavior.
a, The 3D reach task. b, Cross-validated behavior decoding accuracy for various numbers of steps into the future. For m-step-ahead prediction, behavior at time step k is predicted using neural activity up to time step km. All models are taken from Fig. 3, without any retraining or finetuning, with m-step-ahead forecasting done by repeatedly (m−1 times) passing the neural predictions of the model as its neural observation in the next time step (Methods). Solid lines and shaded areas are defined as in Fig. 5b (N = 35 session-folds). Across the number of steps ahead, the statistical significance of a one-sided pairwise comparison between nonlinear DPAD vs nonlinear NDM is shown with the orange top horizontal line with p-value indicated by asterisks next to the line as defined in Fig. 2b (N = 35 session-folds). Similar pairwise comparison between nonlinear DPAD vs linear dynamical system (LDS) modeling is shown with the purple top horizontal line. c-d, Same as a-b for the second dataset, with saccadic eye movements (N = session-folds). e-f, Same as a-b for the third dataset, with sequential cursor reaches controlled via a 2D manipulandum (N = 15 session-folds). g-h, Same as a-b for the fourth dataset, with random grid virtual reality cursor reaches controlled via fingertip position (N = 35 session-folds).
Extended Data Fig. 5
Extended Data Fig. 5. Neural self-prediction accuracy of nonlinear DPAD across recording electrodes for low-dimensional behaviorally relevant latent states.
a, The 3D reach task. b, Average neural self-prediction correlation coefficient (CC) achieved by nonlinear DPAD for analyzed smoothed spiking activity is shown for each recording electrode (N = 35 session-folds; best nonlinearity for decoding). c, Same as b for modeling of raw LFP activity. d, Same as b for modeling of LFP band power activity. Here, prediction accuracy averaged across all 8 band powers (Methods) of a given recording electrode is shown for that electrode. e-h, Same a-d for the second dataset, with saccadic eye movements (N = 35 session-folds). For datasets with single-unit activity (Methods), spiking self-prediction of each electrode is averaged across the units associated with that electrode. i-j, Same as a,b for the third dataset, with sequential cursor reaches controlled via a 2D manipulandum (N = 15 session-folds). White areas are due to electrodes that did not have a neuron associated with them in the data. k-n, Same as a-d for the fourth dataset, with random grid virtual reality cursor reaches controlled via fingertip position (N = 35 session-folds). For all results, the latent state dimension was 16, and all these dimensions were learned using the first optimization step (that is, n1 = 16).
Extended Data Fig. 6
Extended Data Fig. 6. Nonlinear DPAD extracted distinct low dimensional latent states from neural activity for all datasets, which were more behaviorally relevant than those extracted using nonlinear NDM.
a, The 3D reach task. b, The latent state trajectory for 2D states extracted from spiking activity using nonlinear DPAD, averaged across all reach and return epochs across sessions and folds. Here only optimization steps 1-2 of DPAD are used to just extract 2D behaviorally relevant states. c, Same as b for 2D states extracted using nonlinear NDM (special case of using just DPAD optimization steps 3-4). d, Saccadic eye movement task. Trials are averaged depending on the eye movement direction. e, The latent state trajectory for 2D states extracted using DPAD (extracted using optimizations steps 1-2), averaged across all trials of the same movement direction condition across sessions and folds. f, Same as d for 2D states extracted using nonlinear NDM. g-i, Same as d-f for the third dataset, with sequential cursor reaches controlled via a 2D manipulandum. j-l, Same as d-f for the fourth dataset, with random grid virtual reality cursor reaches controlled via fingertip position. Overall, in each dataset, latent states extracted by DPAD were clearly different for different behavior conditions in that dataset (b,e,h,k), whereas NDM’s extracted latent states did not as clearly dissociate different conditions (c,f,i,l). Of note, in the first dataset, DPAD revealed latent states with rotational dynamics that reversed direction during reach versus return epochs, which is consistent with the behavior roughly reversing direction. In contrast, NDM’s latent states showed rotational dynamics that did not reverse direction, thus were less congruent with behavior. In this first dataset, in our earlier work, we had compared PSID and a subspace-based linear NDM method and, similar to b and c here, had found that only PSID uncovers reverse-directional rotational patterns across reach and return movement conditions. These results thus also complement our prior work by showing that even nonlinear NDM models may not uncover the distinct reverse-directional dynamics in this dataset, thus highlighting the need for dissociative and prioritized learning even in nonlinear modeling, as enabled by DPAD.
Extended Data Fig. 7
Extended Data Fig. 7. Neural self-prediction across latent state dimensions.
a, The 3D reach task. b, Cross-validated neural self-prediction accuracy (CC) achieved by variations of nonlinear and linear DPAD/NDM, for different latent state dimensions. Solid lines and shaded areas are defined as in Fig. 5b (N = 35 session-folds). Across latent state dimensions, the statistical significance of a one-sided pairwise comparison between nonlinear DPAD/NDM (with best nonlinearity for self-prediction) vs linear DPAD/NDM is shown with a horizontal green/orange line with p-value indicated by asterisks next to the line as defined in Fig. 2b (N = 35 session-folds). c,d, Same as a,b for the second dataset, with saccadic eye movements (N = 35 session-folds). e,f, Same as a,b for the third dataset, with sequential cursor reaches controlled via a 2D manipulandum (N = 15 session-folds). g,h Same as a,b for the fourth dataset, with random grid virtual reality cursor reaches controlled via fingertip position (N = 35 session-folds). For all DPAD variations, the first 16 latent state dimensions are learned using the first two optimization steps and the remaining dimensions are learned using the last two optimization steps (that is, n1 = 16). As expected, at low state dimensions, DPAD’s latent states achieve higher behavior decoding (Fig. 5) but lower neural self-prediction than NDM because DPAD prioritizes the behaviorally relevant neural dynamics in these dimensions. However, by increasing the state dimension and utilizing optimization steps 3-4, DPAD can reach similar neural self-prediction to NDM while doing better in terms of behavior decoding (Fig. 3). Also, for low dimensional latent states, nonlinear DPAD/NDM consistently result in significantly more accurate neural self-prediction than linear DPAD/NDM. For high enough state dimensions, linear DPAD/NDM eventually reach similar neural self-prediction accuracy to nonlinear DPAD/NDM. Given that NDM solely aims to optimize neural self-prediction (irrespective of the relevance of neural dynamics to behavior), the latter result suggests that the overall neural dynamics can be approximated with linear dynamical models but only with high-dimensional latent states. Note that in contrast to neural self-prediction, behavior decoding of nonlinear DPAD is higher than linear DPAD even at high state dimensions (Fig. 3). Source data
Extended Data Fig. 8
Extended Data Fig. 8. DPAD accurately learns the mapping from neural activity to behavior dynamics in all datasets even if behavioral samples are intermittently available in the training data.
Nonlinear DPAD can perform accurately and better than linear DPAD even when as little as 20% of training behavior samples are kept. a, The 3D reach task. b, Examples are shown from one of the joints in the original behavior time series (light gray) and intermittently subsampled versions of it (cyan) where a subset of the time samples of the behavior time series are randomly chosen to be kept for use in training. In each subsampling, all dimensions of the behavior data are sampled together at the same time steps; this means that at any given time step, either all behavior dimensions are kept or all are dropped to emulate the realistic case with intermittent measurements. c, Cross-validated behavior decoding accuracy (CC) achieved by linear DPAD and by nonlinear DPAD with nonlinearity in the behavior readout parameter Cz. For this nonlinear DPAD, we show the CC when trained with different percentage of behavior samples kept (that is, we emulate different rates of intermittent sampling). The state dimension in each session and fold is chosen (among powers of 2 up to 128) as the smallest that reaches peak decoding in training data. Bars, whiskers, dots, and asterisks are defined as in Fig. 2b (N = 35 session-folds). d,e, Same as a,c for the second dataset, with saccadic eye movements (N = 35 session-folds). f,g, Same as a,c for the third dataset, with sequential cursor reaches controlled via a 2D manipulandum (N = 15 session-folds). h,i, Same as a,c for the fourth dataset, with random grid virtual reality cursor reaches controlled via fingertip position (N = 35 session-folds). For all DPAD variations, the first 16 latent state dimensions are learned using the first two optimization steps and the remaining dimensions are learned using the last two optimization steps (that is, n1 = 16). Source data
Extended Data Fig. 9
Extended Data Fig. 9. Simulations suggest that DPAD may be applicable with sparse sampling of behavior, for example with behavior being a self-reported mood survey value collected once per day.
a, We simulated the application of decoding self-reported mood variations from neural signals,. Neural data is simulated based on linear models fitted to intracranial neural data recorded from epilepsy subjects. Each recorded region in each subject is simulated as a linear state-space model with a 3-dimensional latent state, with the same parameters as those fitted to neural recordings from that region. Simulated latent states from a subset of regions were linearly combined to generate a simulated mood signal (that is, biomarker). As the simulated models were linear, we used the linear versions of DPAD and NDM (NDM used the subspace identification method that we found does similarly to numerical optimization for linear models in Extended Data Fig. 1). We generated the equivalent of 3 weeks of intracranial recordings, which is on the order the time-duration of the real intracranial recordings. We then subsampled the simulated mood signal (behavior) to emulate intermittent behavioral measures such as mood surveys. b, Behavior decoding results in unseen simulated test data, across N = 87 simulated models, for different sampling rates of behavior in the training data. Box edges show the 25th and 75th percentiles, solid horizontal lines show the median, whiskers show the range of data, and dots show all data points (N = 87 simulated models). Asterisks are defined as in Fig. 2b. DPAD consistently outperformed NDM regardless of how sparse behavior measures were, even when these measures were available just once per day (P < 0.0005, one-sided signed-rank, N = 87).

References

    1. Cunningham, J. P. & Yu, B. M. Dimensionality reduction for large-scale neural recordings. Nat. Neurosci.17, 1500–1509 (2014). - PMC - PubMed
    1. Macke, J. H. et al. Empirical models of spiking in neural populations. In Advances in Neural Information Processing Systems 24 (eds. Shawe-Taylor, J., Zemel, R. S., Bartlett, P. L., Pereira, F. & Weinberger, K. Q.) 1350–1358 (Curran Associates, 2011).
    1. Kao, J. C. et al. Single-trial dynamics of motor cortex and their applications to brain–machine interfaces. Nat. Commun.6, 7759 (2015). - PMC - PubMed
    1. Bondanelli, G., Deneux, T., Bathellier, B. & Ostojic, S. Network dynamics underlying OFF responses in the auditory cortex. eLife10, e53151 (2021). - PMC - PubMed
    1. Abbaspourazad, H., Choudhury, M., Wong, Y. T., Pesaran, B. & Shanechi, M. M. Multiscale low-dimensional motor cortical state dynamics predict naturalistic reach-and-grasp behavior. Nat. Commun.12, 607 (2021). - PMC - PubMed

LinkOut - more resources