Meta-Analysis
. 2025 Jan;30(1):310-326.
doi: 10.1038/s41380-024-02719-x. Epub 2024 Sep 6.

A systematic review and meta-analysis on the transcriptomic signatures in alcohol use disorder

Affiliations
Meta-Analysis

A systematic review and meta-analysis on the transcriptomic signatures in alcohol use disorder

Marion M Friske et al. Mol Psychiatry. 2025 Jan.

Abstract

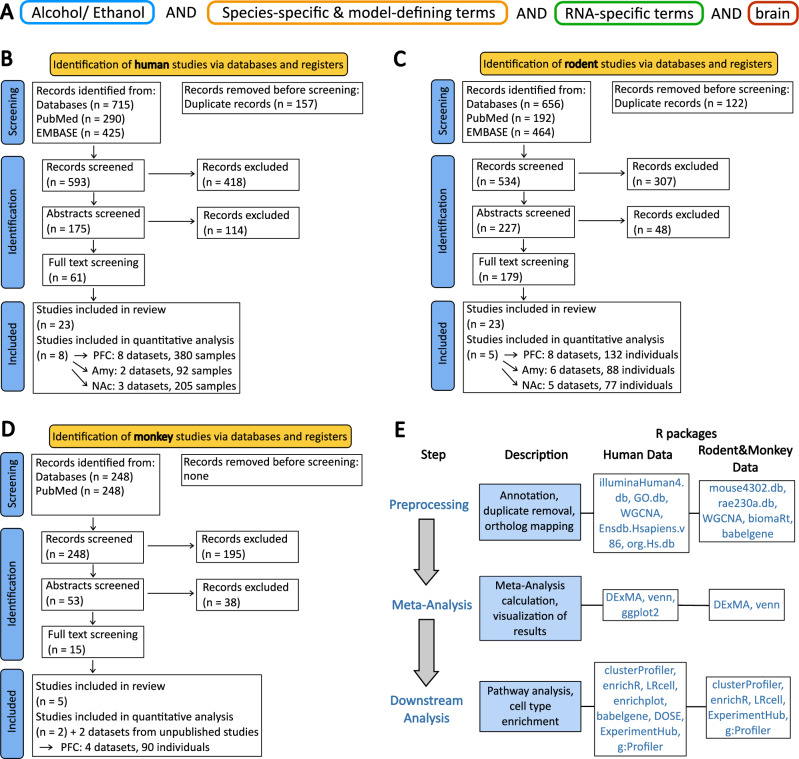
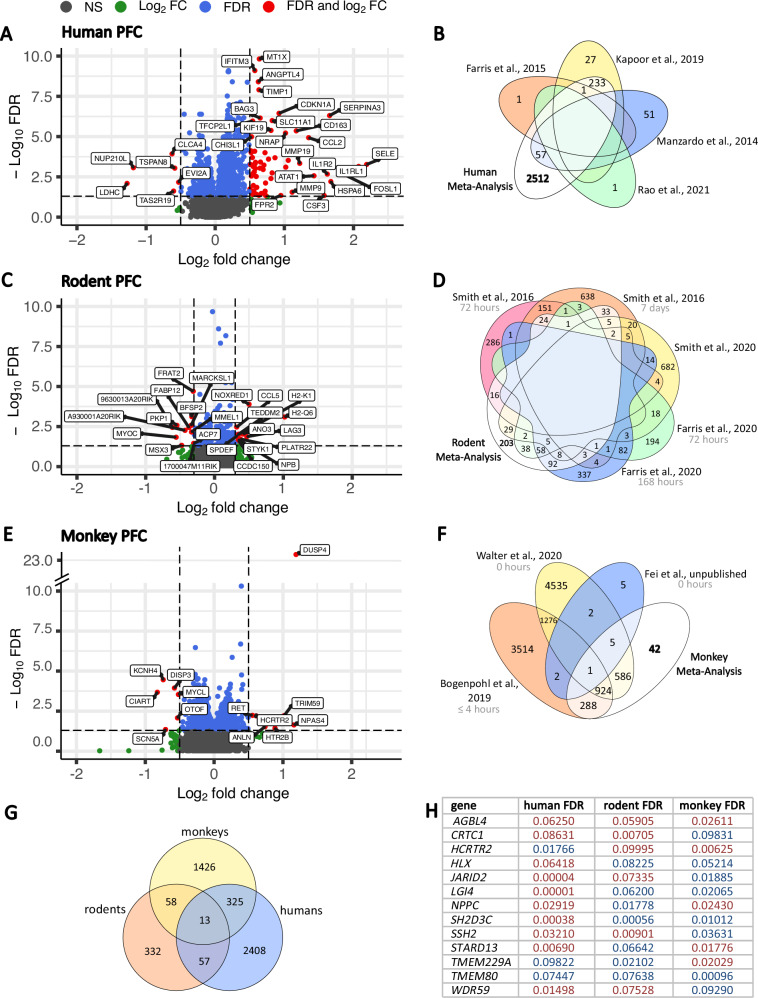
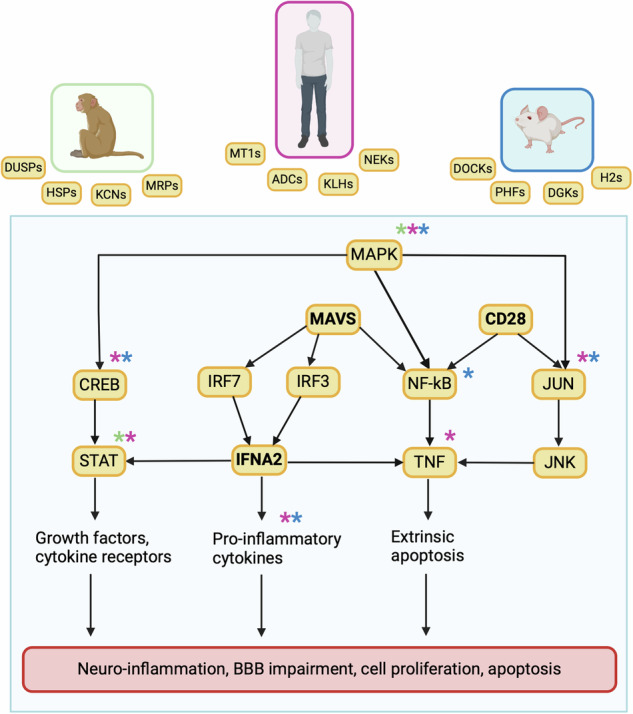
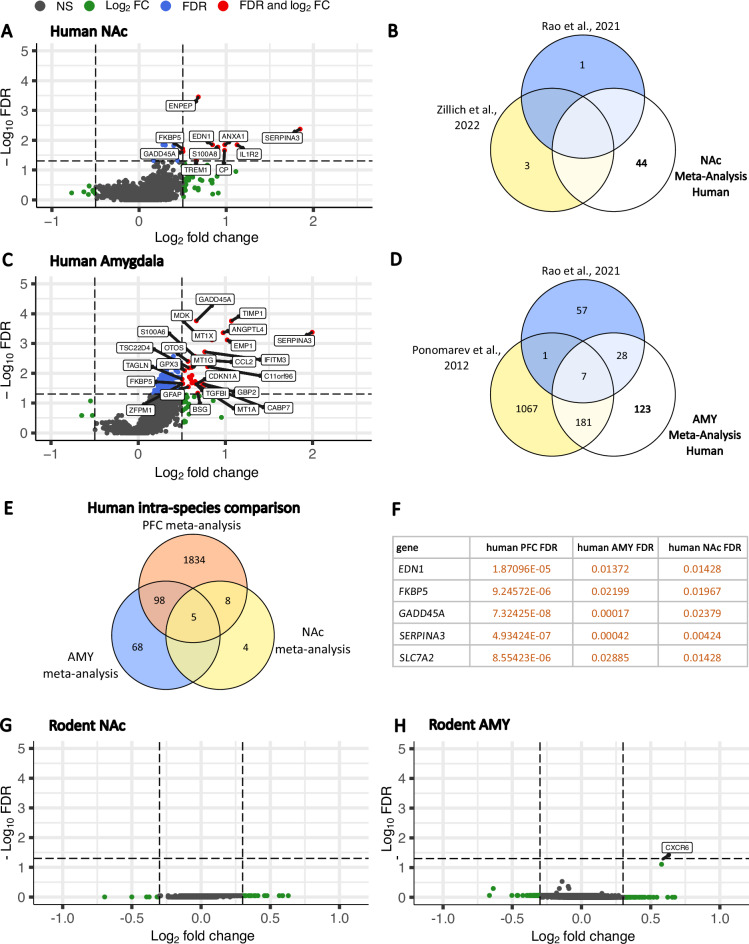
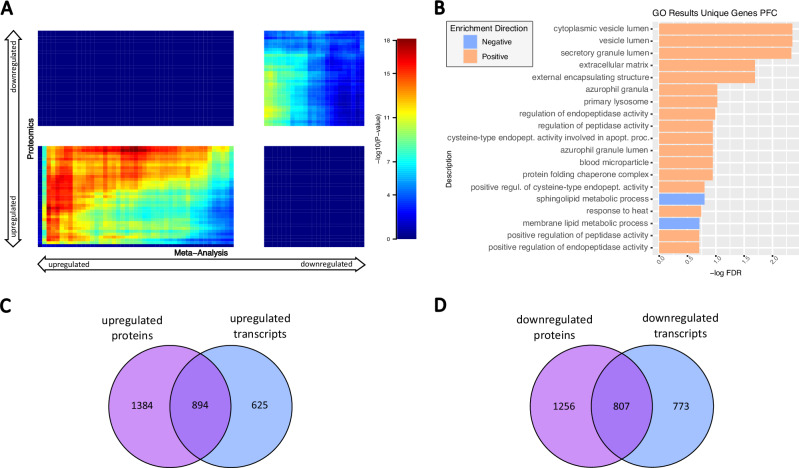
Currently available clinical treatments on alcohol use disorder (AUD) exhibit limited efficacy and new druggable targets are required. One promising approach to discover new molecular treatment targets involves the transcriptomic profiling of brain regions within the addiction neurocircuitry, utilizing animal models and postmortem brain tissue from deceased patients with AUD. Unfortunately, such studies suffer from large heterogeneity and small sample sizes. To address these limitations, we conducted a cross-species meta-analysis on transcriptome-wide data obtained from brain tissue of patients with AUD and animal models. We integrated 36 cross-species transcriptome-wide RNA-expression datasets with an alcohol-dependent phenotype vs. controls, following the PRISMA guidelines. In total, we meta-analyzed 964 samples - 502 samples from the prefrontal cortex (PFC), 282 nucleus accumbens (NAc) samples, and 180 from amygdala (AMY). The PFC had the highest number of differentially expressed genes (DEGs) across rodents, monkeys, and humans. Commonly dysregulated DEGs suggest conserved cross-species mechanisms for chronic alcohol consumption/AUD comprising MAPKs as well as STAT, IRF7, and TNF. Furthermore, we identified numerous unique gene sets that might contribute individually to these conserved mechanisms and also suggest novel molecular aspects of AUD. Validation of the transcriptomic alterations on the protein level revealed interesting targets for further investigation. Finally, we identified a combination of DEGs that are commonly regulated across different brain tissues as potential biomarkers for AUD. In summary, we provide a compendium of genes that are assessable via a shiny app, and describe signaling pathways, and physiological and cellular processes that are altered in AUD that require future studies for functional validation.


Conflict of interest statement

Competing interests: The authors declare no competing interests.

Figures

Fig. 1
Fig. 1. Systematic literature screening and meta-analysis.
Systematic literature screening of PubMed and EMBASE to retrieve transcriptome-wide expression datasets derived from (B) postmortem brain tissue of deceased AUD patients and controls, C from CIE rodents, and D from monkeys that had long-term intermittent voluntary alcohol consumption. A General structure for the keyword design for systematic literature research (B) PRISMA workflow for the screening of human studies. Before the screening procedure, duplicates due to overrepresentation in the two databases screened were removed by using EndNote. The template for overview of the screening procedure and the resulting studies was taken from www.prisma-statement.org. Eventually, we identified ten human postmortem studies matching our criteria [, –128] (C) PRISMA workflow for the screening of rodent studies resulted in five studies to include [–133] (D) PRISMA workflow for the screening of monkey studies identified two studies to include in the meta-analysis [134, 135]. In addition, unpublished data were kindly provided by Dr. Kathleen A. Grant and Dr. Suzanne Fei. E General workflow of the meta-analysis pipeline with the respective packages used for the statistical software R.
Fig. 2
Fig. 2. Transcriptome-wide meta-analysis of PFC data.
Meta-Analyses of the transcriptome-wide gene expression data derived from the PFC of humans (A, B), rodents (C, D) and monkeys (E, F) identified by species-specific Stouffer’s p-value combination with FDR < 0.05 as threshold for significantly altered transcripts (DEGs). A Volcano plot depicting all genes analyzed in the human PFC meta-analysis. Transcripts with FDR < 0.05 and log2 fold-change (FC) > 0.5 are highlighted in red, DEGs with FDR < 0.05 and FC < 0.25 are highlighted in blue, DEGs with FDR > 0.05 and FC > 0.25 are highlighted in green. DEGs with FDR > 0.05 and FC < 0.5 are highlighted in gray (B) Venn diagram comparing DEGs with FDR < 0.1 of the human PFC studies and the meta-analysis identified 2,512 unique genes being significant in the meta-analysis, that have not reached significance in the original studies. No significant DEG has been identified across all studies commonly. Only datasets representing significant DEGs are shown. C Volcano plot depicting all genes analyzed in the rodent PFC meta-analysis. Transcripts with FDR < 0.05 and log2 fold-change (FC) > 0.3 are highlighted in red, DEGs with FDR < 0.05 and FC < 0.25 are highlighted in blue, DEGs with FDR > 0.05 and FC > 0.25 are highlighted in green. DEGs with FDR > 0.05 and FC < 0.3 are highlighted in gray (D) Venn diagram comparing DEGs with FDR < 0.1 of the rodent PFC studies and the meta-analysis identified 203 unique genes being significant in the meta-analysis, that have not reached significance in the original studies. No significant DEG has been identified across all studies commonly. Only datasets representing significant DEGs are shown. Studies include the time span of last alcohol experience and time point of death as indicated in light gray below the respective study. E Volcano plot depicting all genes analyzed in the monkey PFC meta-analysis. Transcripts with FDR < 0.05 and log2 fold-change (FC) > 0.5 are highlighted in red, DEGs with FDR < 0.05 and FC < 0.25 are highlighted in blue, DEGs with FDR > 0.05 and FC > 0.25 are highlighted in green. DEGs with FDR > 0.05 and FC < 0.5 are highlighted in gray (F) Venn diagram comparing DEGs with FDR < 0.1 of the monkey PFC studies and the meta-analysis identified 42 unique genes being significant in the meta-analysis, that have not reached significance in the original studies. One significant DEG has been identified across all studies commonly. Only datasets representing significant DEGs are shown. G Venn diagram depicting the cross-species comparison considering DEGs with FDR < 0.1 across the human, rodent and monkey meta-analysis results. H Thirteen DEGs were detected as significantly altered in the PFC across all three species with two transcripts being dysregulated in the same direction - AGBLA4 and TMEM80. FDR values depicted in blue represent down-regulated transcripts, while FDR values in red stand for up-regulated DEGs.
Fig. 3
Fig. 3. Proposed conserved cross-species mechanism for chronic alcohol consumption/AUD.
In the gray box, the conserved mechanism includes the upstream regulators MAVS, CD28, and IFNA2 (highlighted in bold) and underlying pathways are highlighted. These pathways work together to cause neuroinflammatory responses as well as impairment in BBB integrity, cell proliferation and apoptosis regulation. Above the gray box, the three analyzed species monkey, human, and rodent are shown with their top distinct findings and how those interact with the conserved mechanism as indicated by asterisks in the respective colors (green for monkey, pink for human, blue for rodent). This figure was created with Biorender. DUSP dual specificity phosphatases, HSPs heat shock proteins, KCNs potassium channels, MRPs multidrug resistance-associated proteins, MT1s metallothionines 1, ADCs adenylyl cyclases, KLHs Kelch-like genes, NEKs NIMA related kinases, DOCKs dedicators of cytokines, PHFs PHD finger proteins, DGKs diacylglycerol kinases, H2s histocompatibility complex II genes.
Fig. 4
Fig. 4. Transcriptome-wide meta-analysis of NAc and AMY data.
Meta-Analysis of the transcriptome-wide gene expression data from NAc and AMY from humans (AF) and rodents (G, H) identified by Stouffer’s p-value combination with FDR < 0.05 as threshold for significant DEGs. Transcripts with FDR < 0.05 and log2 fold-change (FC) > 0.5 are highlighted in red; DEGs with FDR < 0.05 and FC < 0.25 are highlighted in blue; DEGs with FDR > 0.05 and FC > 0.25 are highlighted in green; DEGs with FDR > 0.05 and FC < 0.5 for humans and FC < 0.3 are highlighted in gray. A Gene expression pattern of the transcriptome-wide meta-analysis in human NAc. B Overlapping transcripts derived from human NAc original studied and the meta-analysis (FDR < 0.1). C Gene expression pattern of the transcriptome-wide meta-analysis in human AMY. D Overlapping transcripts derived from human AMY original studied and the meta-analysis (FDR < 0.1). E Venn diagram depicting the interspecies comparison considering the DEGs with FDR < 0.05 across the human PFC, NAc and AMY meta-analysis results. F Five DEGs have been detected to be consistently up-regulated across these brain regions: EDN, FKBP5, GADD45A, SERPINA3, and SLC7A2. G Gene expression pattern of the transcriptome-wide meta-analysis in rodent NAc. H Gene expression pattern of the transcriptome-wide meta-analysis in rodent AMY. Considering a threshold of FDR < 0.05, no DEGs were detected for both rodent NAc and AMY meta-analysis.
Fig. 5
Fig. 5. Integrative analysis of AUD transcriptomics and proteomics data to obtain direct effects of the mRNA alterations identified in the meta-analysis on the protein level.
Since RRHO only allows inclusion of identically named targets, this analysis comprised 4,685 transcripts and their respective protein homolog. A Enrichment plot of stratified RRHO considering all four possibilities of concordant and discordant overlaps. Top left quadrant represents up-regulated gene expression and down-regulated protein expression, top right quadrant represents concordant down-regulation of gene and protein expression, bottom left quadrant represent concordant up-regulation of gene and protein expression and bottom right quadrant represents down-regulated gene expression and up-regulated protein expression. 1,701 transcripts (36.3%) were dysregulated into the same direction as their respective protein (representation factor:1.5, p < 1.34e-117). B GSEA of the overlapping transcripts. C Venn diagram depicting transcript-protein overlaps that are concordantly up-regulated. D Venn diagram depicting transcript-protein overlaps that are concordantly down-regulated.

References

    1. Alcohol: Fact sheet. https://www.who.int/en/news-room/fact-sheets/detail/alcohol, 2018.
    1. MacKillop J, Agabio R, Feldstein Ewing SW, Heilig M, Kelly JF, Leggio L, et al. Hazardous drinking and alcohol use disorders. Nat Rev Dis Primers. 2022;8:80. - PMC - PubMed
    1. Collaborators GBDA. Alcohol use and burden for 195 countries and territories, 1990-2016: a systematic analysis for the Global Burden of Disease Study 2016. Lancet. 2018;392:1015–35. - PMC - PubMed
    1. Heilig M, MacKillop J, Martinez D, Rehm J, Leggio L, Vanderschuren L. Addiction as a brain disease revised: why it still matters, and the need for consilience. Neuropsychopharmacology. 2021;46:1715–23. - PMC - PubMed
    1. Heilig M, Augier E, Pfarr S, Sommer WH. Developing neuroscience-based treatments for alcohol addiction: A matter of choice? Transl Psychiatry. 2019;9:255. - PMC - PubMed