. 2024 Sep 6;23(1):188.
doi: 10.1186/s12943-024-02102-y.

NAC1 promotes stemness and regulates myeloid-derived cell status in triple-negative breast cancer

Affiliations

NAC1 promotes stemness and regulates myeloid-derived cell status in triple-negative breast cancer

Chrispus Ngule et al. Mol Cancer. .

Erratum in

Abstract

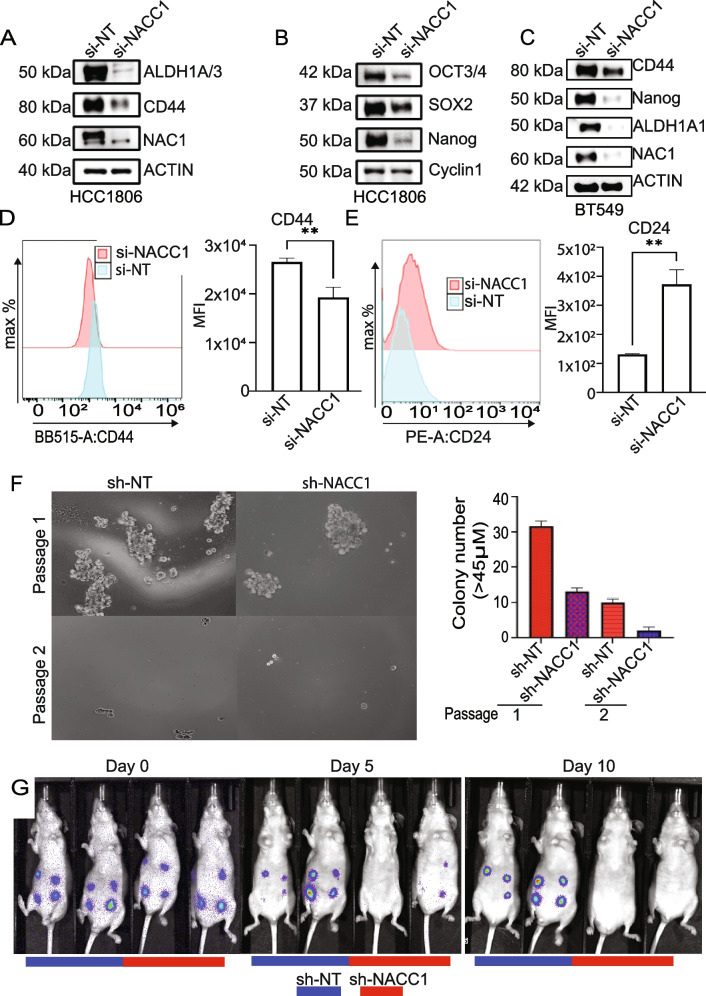
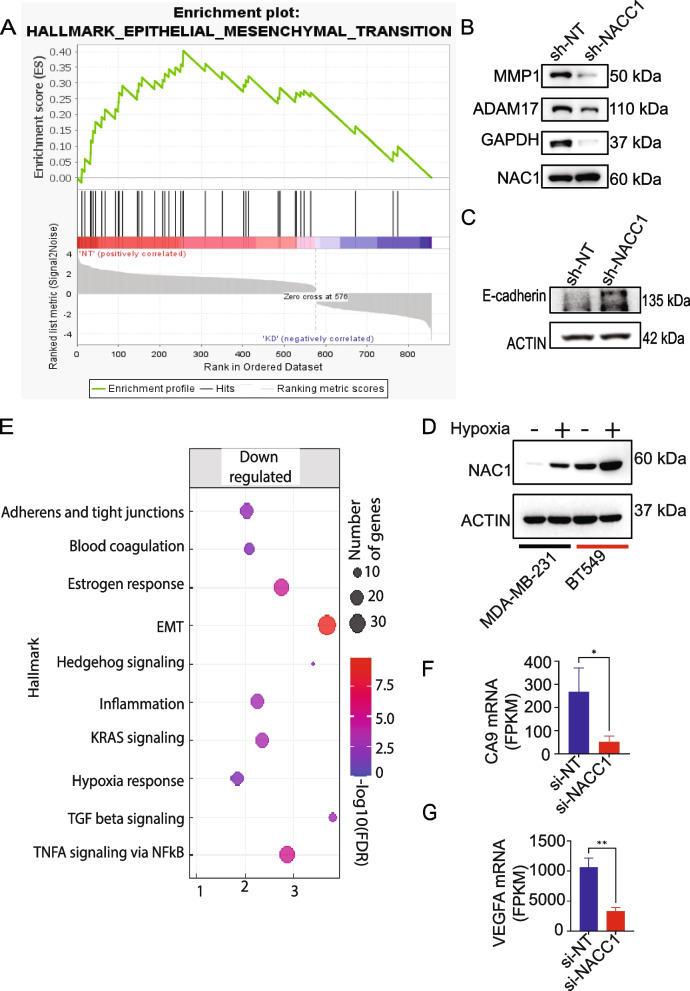
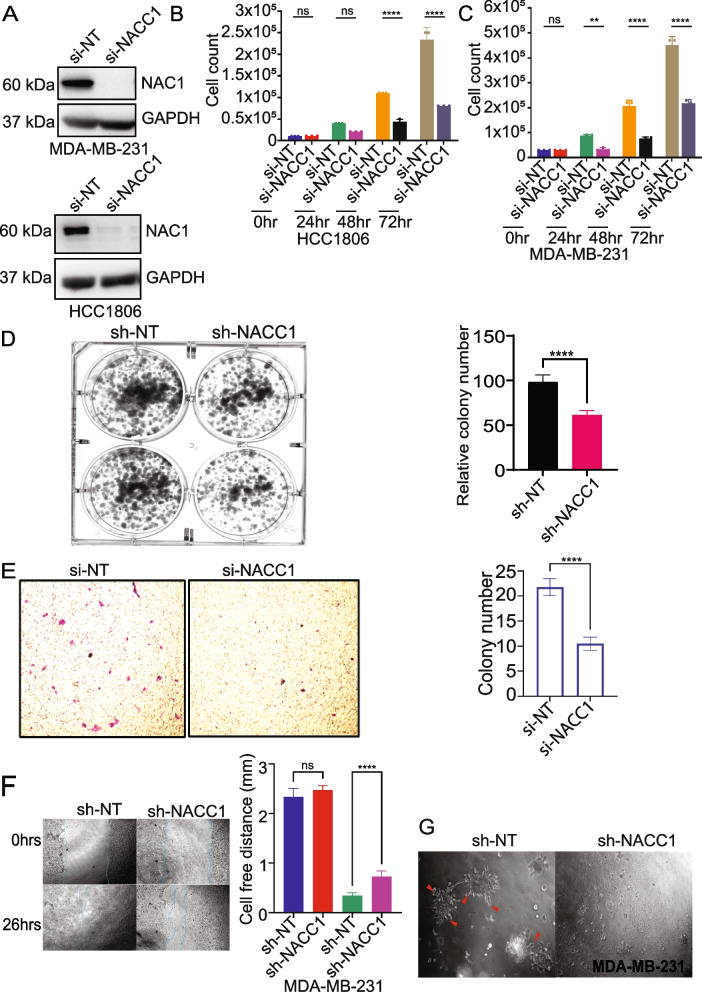
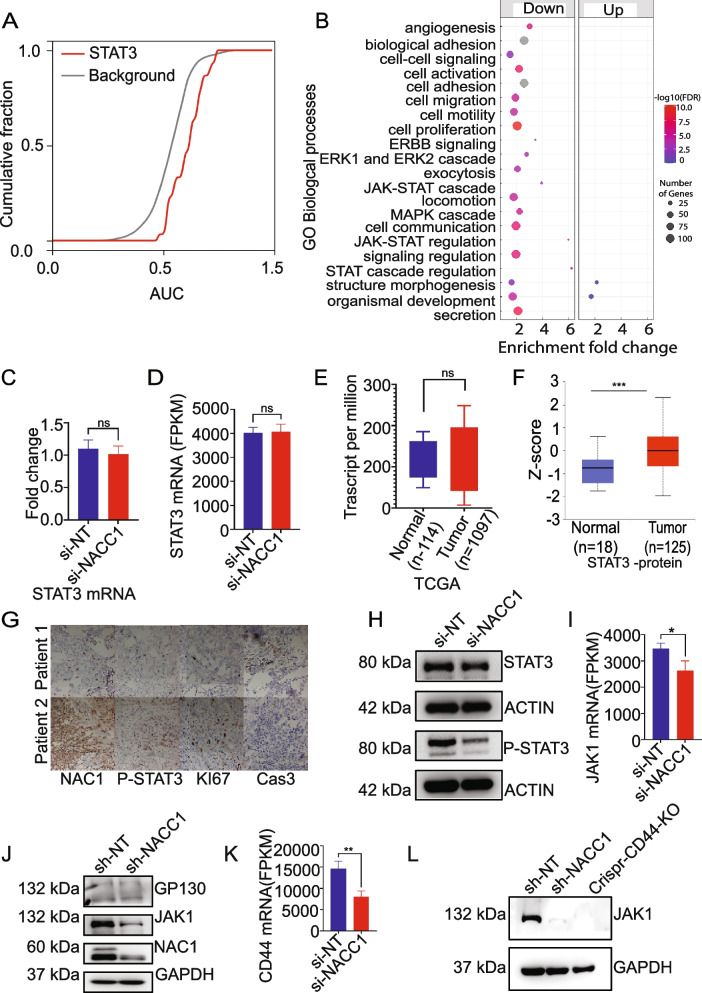
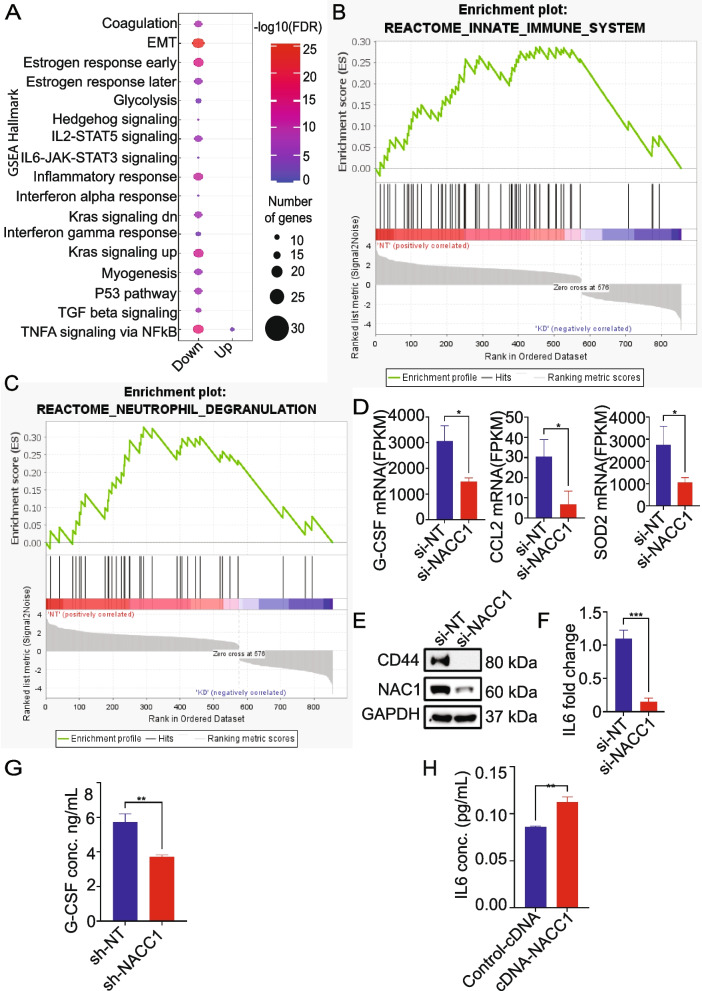
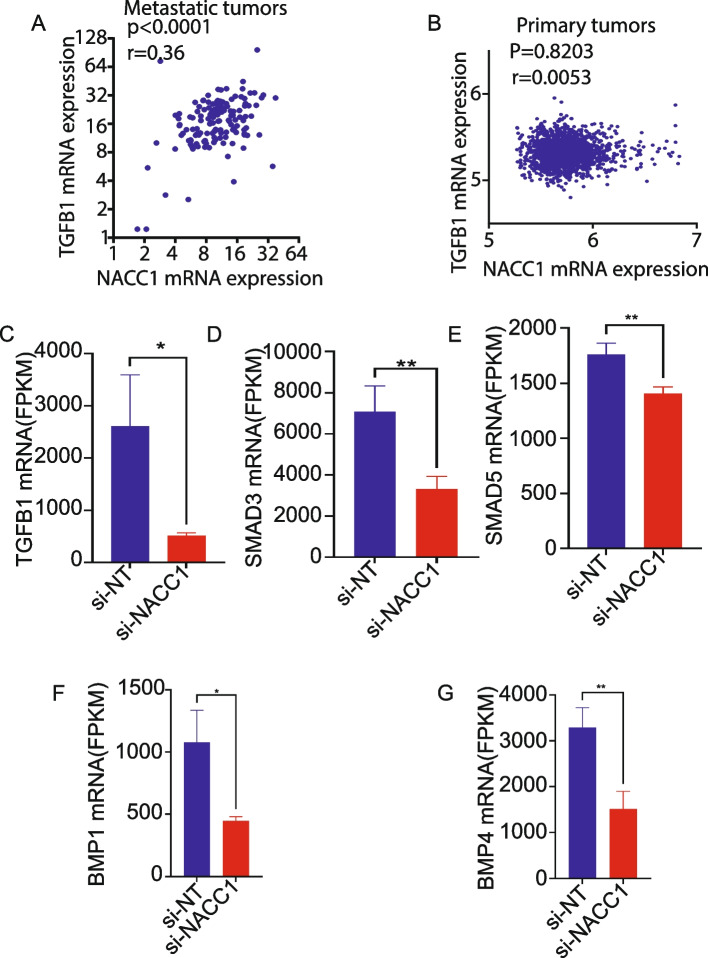
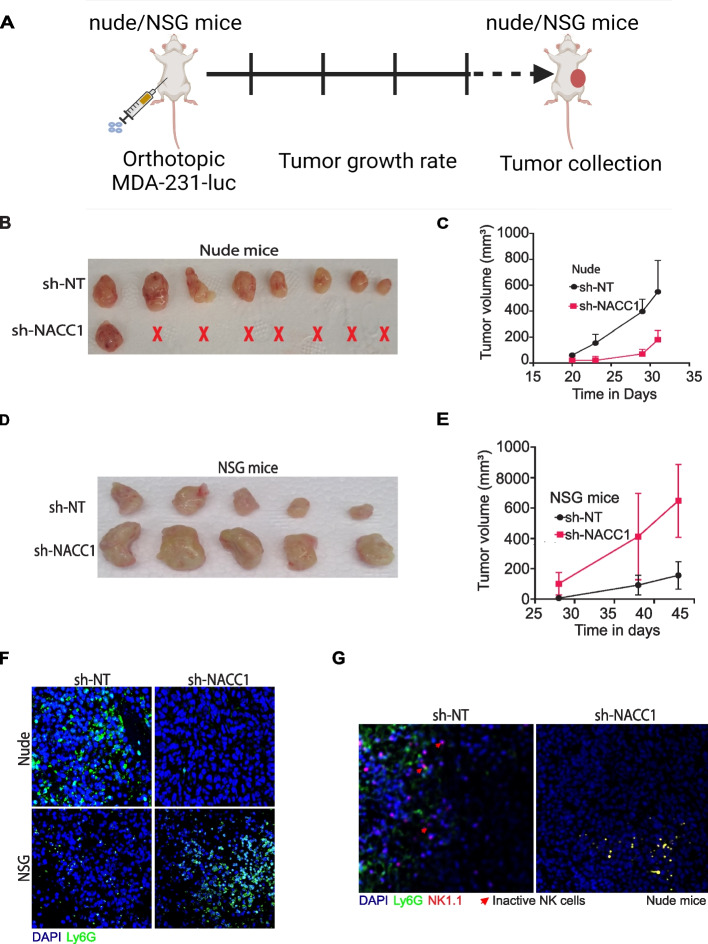
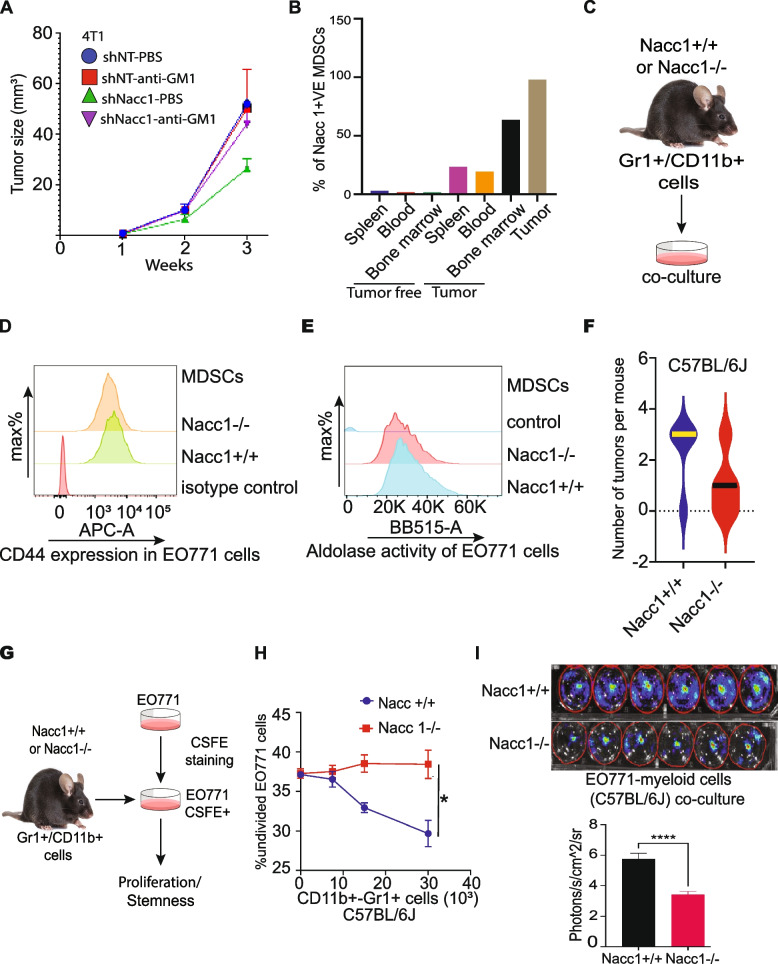
Triple negative breast cancer (TNBC) is a particularly lethal breast cancer (BC) subtype driven by cancer stem cells (CSCs) and an immunosuppressive microenvironment. Our study reveals that nucleus accumbens associated protein 1 (NAC1), a member of the BTB/POZ gene family, plays a crucial role in TNBC by maintaining tumor stemness and influencing myeloid-derived suppressor cells (MDSCs). High NAC1 expression correlates with worse TNBC prognosis. NAC1 knockdown reduced CSC markers and tumor cell proliferation, migration, and invasion. Additionally, NAC1 affects oncogenic pathways such as the CD44-JAK1-STAT3 axis and immunosuppressive signals (TGFβ, IL-6). Intriguingly, the impact of NAC1 on tumor growth varies with the host immune status, showing diminished tumorigenicity in natural killer (NK) cell-competent mice but increased tumorigenicity in NK cell-deficient ones. This highlights the important role of the host immune system in TNBC progression. In addition, high NAC1 level in MDSCs also supports TNBC stemness. Together, this study implies NAC1 as a promising therapeutic target able to simultaneously eradicate CSCs and mitigate immune evasion.

Keywords: Cancer stem cells; MDSCs; NAC1; NK cells; TME; TNBC.


Conflict of interest statement

The authors declare no competing interests.

Figures

Fig. 1
Fig. 1
High NAC1 expression is associated with tumor progression, stemness, and poor prognosis in TNBC patients. A Genetic alterations of NAC1 in breast cancer primary tumors (BPT) in TCGA and Metabric cbioportal datasets. B Genetic alterations of NAC1 in breast cancer metastatic tumors (BMT) in archived and provisional cbioportal datasets. C Correlation between NAC1 copy number alterations and mRNA expression in TCGA breast cancer patient tissues. D Evaluation of NAC1 expression in different stages of breast cancer. E NAC1 mRNA expression in TNBC (basal), claudin-low, other breast cancer subtypes (non-TNBC), and normal tissues in Metabric dataset samples. F NAC1 copy number alterations in TNBC (basal), other breast cancer subtypes (non-TNBC), and normal tissues in Metabric dataset samples. G Western blot of NAC1 expression in TNBC and non-TNBC cell lines. H Effect of NAC1 expression on overall survival of patients with TNBC, as analyzed using the TIDE datasets. I NAC1 expression in different cell subpopulations at single cell level (Broad Institute single cell portal). J Association of NAC1 expression with stemness markers in various cells within the TNBC tumor microenvironment (Broad Institute single cell portal). n.s: not significant; *: p = 0.05; ***: p = 0.01; ***: p = 0.001; ****: p = 0.001
Fig. 2
Fig. 2
Effect of NAC1 on stemness of TNBC cells. A-C Western blot analysis of the stemness-associated markers in HCC1806 and BT549 TNBC cells with or without knockdown of NAC1. D Flow cytometry analysis of CD44 protein surface expression in MDA-MB-231 cells with or without knockdown of NAC1. E Flow cytometry analysis of CD24 protein surface expression in MDA-MB-231 cells with or without knockdown of NAC1. F Right: Mammosphere formation of TNBC cells with or without depletion of NAC1; Left: quantification of the number of spheres larger than 45 µM. G Tumor initiation and growth of MDA-MB-231 cells with or without depletion of NAC1 in nu/nu mice. Number of tumors(n) = 2, number of tumors per mouse (Tn) = 4. Luminescence intensity signifies a relative number of detectable live cells
Fig. 3
Fig. 3
Analysis of bulky RNA sequencing data reveals the tumor progression-associated pathways potentially regulated by NAC1. A Enrichment of DEGs associated with epithelial-mesenchymal transition (EMT) in MDA-MB-231 cells with deficiency of NAC1. B Western blot of metalloproteases in MDA-MB-231 cells with or without depletion of NAC1. C Protein expression of EMT-associated marker E-cadherin in MDA-MB-231 cells with or without depletion of NAC1. D MDA-MB-231 and BT549 cells subjected to hypoxia show increased NAC1 expression. E Gene ontology analysis shows the enrichment of hypoxia, immune regulation, and EMT-associated genes in NAC1-knockdown MDA-MB-231 cells. F Expression of hypoxia-associated CA9 gene in MDA-MB-231 cells with or without depletion of NAC1. G Expression of vascularization-associated gene VEGFA in MDA-MB-231 cells with or without depletion of NAC1
Fig. 4
Fig. 4
Effect of NAC1 on proliferation, migration, and invasion of TNBC cells. A Western blot of NAC1 in TNBC cells transfected si-NACC1 or si-NT. B, C Proliferation of TNBC cells with or without depletion of NAC1. D Clonogenic formation of MDA-MB-231 cells with or without depletion of NAC1. E Migration of MDA-MB-231 cells with or without depletion of NAC1. F Wound healing assay for the migratory ability of MDA-MB-231 cells with or without depletion of NAC1. G Matrigel assay for the migratory ability of MDA-MB-231 cells with or without depletion of NAC1
Fig. 5
Fig. 5
CD44/JAK-STAT3 is involved in the NAC1-mediated control of TNBC stemness and progression. A Analysis of the transcription factors (TFs) associated with the differentially expressed genes in NAC1 knockdown cells demonstrates STAT3 as an important TF in NAC1-induced phenotypes. B GSEA analysis demonstrates reduction of genes associated with tumor progression phenotypes and pathways including angiogenesis, cell migration, cell motility and JAK/STAT3 cascade. C STAT3 qPCR mRNA analysis of MDA-MB-231 cells. D STAT3 mRNA expression in MDA-MB-231 cells with depletion of NAC1. E TCGA STAT3 mRNA expression analysis reveals insignificant change (p > 0.05) in tumor samples compared to adjacent normal tissues. F STAT3 protein expression significantly increases in CPTAC dataset tumor samples compared to normal. G Correlation between NAC1, proliferation marker KI67, caspase 3, and phospho-STAT3 in TNBC patients’ tissue from the University of Kentucky retrospective tissue bank. H Depletion of NAC1 downregulates STAT3 and phospho-STAT3 protein expression in TNBC cells. I JAK1 mRNA expression in MDA-MB-231 cells with depletion of NAC1. J Western blot analysis of JAK/STAT3 pathway-associated proteins in MDA-MB-231 cells with depletion of NAC1. K CD44 mRNA expression in MDA-MB-231 cells with depletion of NAC1. L Depletion of CD44 caused downregulation of JAK1 in MDA-MB-231 cells
Fig. 6
Fig. 6
Analysis of bulky RNA sequencing data reveals the immunosuppressive TME-associated factors potentially regulated by NAC1. A Altered oncogenic-associated pathways and genes in NAC1-deficient tumor cells. B Reactome analysis shows downregulation of innate immunity-associated genes in tumor cells with NAC1 knockdown. C Enrichment of the genes associated with neutrophil degranulation in tumor cells with NAC1 knockdown. D Expression of G-CSF, CCL2, and SOD2 in MDA-MB-231 cells with or without depletion of NAC1. E Expression of CD44 in MDA-MB-231 cells with or without depletion of NAC1. F IL6 mRNA expression in MDA-MB-231 cells with or without depletion of NAC1. G Level of soluble G-CSF in MDA-MB-231 cells with or without depletion of NAC1. H Soluble IL6 concentration in EO771 cells with forced expression of NAC1
Fig. 7
Fig. 7
Effect of NAC1 on TGFβ1 signaling pathway. A, B Analysis of the association of NAC1 and TGFβ1 expression using the archived metastatic breast cancer sample dataset (A) and using the Metabric breast cancer primary tumor sample dataset (B). C-G mRNA expressions of TGFβ1 (C), SMAD3 (D), SMAD5 (E), BMP1 (F), and BMP4 (G) in MDA-MB-231 cells with or without depletion of NAC1
Fig. 8
Fig. 8
Comparison of tumor growth of NAC1-expressing and NAC1-deficient TNBC cells in nude or NSG mice (n = 3, Tn = 2). A Illustration of tumor orthotopic inoculation in nude and NSG mice models. Mice were orthotopically injected with MDA-MB-231 cells (1 × 106 cells/injection, n = 4, Tn = 2 on the 4th mammary fat pad) with or without depletion of NAC1, and tumor growth was monitored every five days until mice showed adverse clinical symptoms due to increased tumor burden. B, C Tumor growth in nu/nu mice. D, E Tumor growth in NSG mice. To evaluate the infiltration of MDSCs and NK cells into the tumor microenvironment, we performed an immunofluorescence assay using Ly6G for MDSCs and NK1.1 and CD16 antibodies for NK cells. F Tumor infiltration of MDSCs in the tumor-bearing nude or NSG mice. G Tumor infiltration of NK cells in tumor-bearing nude mice, as shown by staining with NK1.1 and CD16 antibodies. Red arrows indicate the inactive NK cells
Fig. 9
Fig. 9
Effects of NK cells on growth of NAC1-expressing and NAC1-deficient TNBC cells in nude mice. A Illustration of NK cell depletion approach. Mice were orthotopically inoculated with the luciferase plasmid transfected-MDA-MB-231 cells with or without depletion of NAC1 (1 × 106 cells/inoculation, n = 4, Tn = 4). On day four following tumor inoculation, the mice were given NK1.1 antibody or control IgG (4 mg/kg) intraperitoneally five times with a four day-interval to deplete NK cells. Tumor cell proliferation and tumor growth were monitored using the Lago optical imaging system. B, C Luminescence intensity of tumor cells grown in mice with or without NK cell depletion (B) and quantification of the luminescence intensity (photon emission) (C). D Tumor volume (mm3) in mice with or without NK cell depletion. E Tumor formations in the mice treated with NK1.1 antibody or IgG. F Tumor weights in mice with or without depletion of NK cells. G Illustration of MDSCs depletion approach. Mice were orthotopically inoculated with the luciferase plasmid transfected-MDA-MB-231 cells (1 × 106 cells/inoculation, n = 2, Tn = 4) with or without depletion of NAC1. On day four following tumor inoculation, the mice were given Ly6G antibody or control IgG (4 mg/kg) intraperitoneally five times with a four day-interval to deplete MDSCs. Tumor cell proliferation and tumor growth were monitored using the Lago optical imaging system. H, I Luminescence intensity of tumor cells grown in mice with or without depletion of MDSCs (H) and quantification of the luminescence intensity (photon emission) obtained on the last day of antibody depletion treatment. J Tumor volume (mm3) in mice with or without depletion of MDSCs. K Tumor formations in the mice treated with Ly6G antibody or IgG. L Tumor weights in mice with or without depletion of MDSCs
Fig. 10
Fig. 10
Myeloid-derived cells with expression of NAC1 supports CSCs. A Tumor growth rate for knockdown 4T1 allografted cells with or without NK cell depletion. B Expression of NAC1 in MDSCs from 4T1 tumor-bearing or tumor-free BALB/C mice. C Gr1+/CD11b+ cells were isolated from the NACC1+/+ or NACC1−/− mice bearing EO771 tumors through negative selection to obtain MDSCs and were further purified using CD45 positive selection assay kit (Stemcell technologies) to eliminate contaminating tumor cells. D EO771 cells co-cultured with NACC1−/− Gr1+/CD11b+ cells showed reduced CD44 expression compared to the co-culture with NACC1+/+ Gr1+/CD11b+ cells. E Aldolase activity of EO771 cells co-cultured with NACC1+/+ or NACC1−/− mice Gr1+/CD11b+ cells. F Tumor initiation ability of EO771 cells orthotopically inoculated in NACC1+/+ or NACC1−/− mice (n = 5, Tn = 2). G-I EO771 cells were co-cultured with NACC1+/+ or NACC1−/− Gr1+/CD11b+ cells, and cell viability was determined using the CellTrace™ CFSE Cell Proliferation Kit (G) or luciferase assay (H)
Fig. 11
Fig. 11
Proposed model. High expression of NAC1 in TNBC promotes tumor stemness and induces secretion of immunosuppressive cytokines, which orchestrate tumor infiltration of MDSCs and NK cells and tumor stemness. MDSCs support stemness properties and aid tumor immune evasion, promoting tumor growth and progression

References

    1. Cha XY, et al. NAC-1, a rat brain mRNA, is increased in the nucleus accumbens three weeks after chronic cocaine self-administration. J Neurosci. 1997;17(18):6864–71. - PMC - PubMed
    1. Wang J, et al. A protein interaction network for pluripotency of embryonic stem cells. Nature. 2006;444(7117):364–8. - PubMed
    1. Kim J, et al. An extended transcriptional network for pluripotency of embryonic stem cells. Cell. 2008;132(6):1049–61. - PMC - PubMed
    1. Malleshaiah M, et al. NAC1 Coordinates a Sub-network of Pluripotency Factors to Regulate Embryonic Stem Cell Differentiation. Cell Rep. 2016;14(5):1181–94. - PMC - PubMed
    1. Yap KL, et al. Loss of NAC1 expression is associated with defective bony patterning in the murine vertebral axis. PLoS ONE. 2013;8(7): e69099. - PMC - PubMed

MeSH terms

LinkOut - more resources