. 2024 Dec 10;30(69):e202402492.
doi: 10.1002/chem.202402492. Epub 2024 Nov 3.

Surface Chemistry of a Halogenated Borazine: From Supramolecular Assemblies to a Random Covalent BN-Substituted Carbon Network

Affiliations

Surface Chemistry of a Halogenated Borazine: From Supramolecular Assemblies to a Random Covalent BN-Substituted Carbon Network

Birce Sena Tömekce et al. Chemistry. .

Abstract

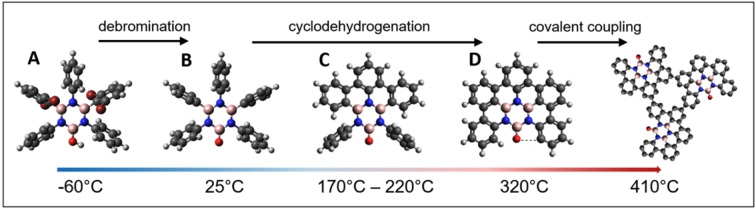
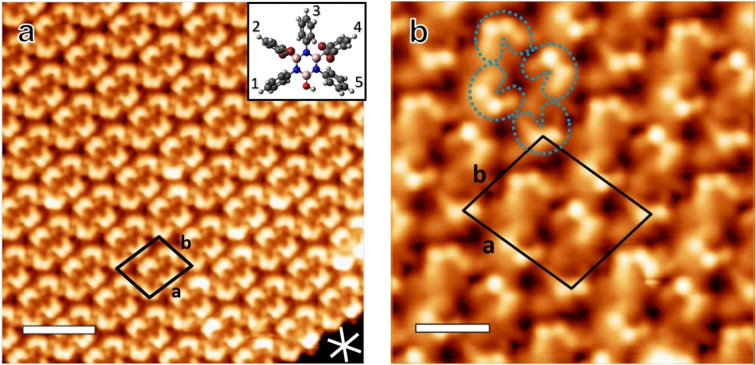
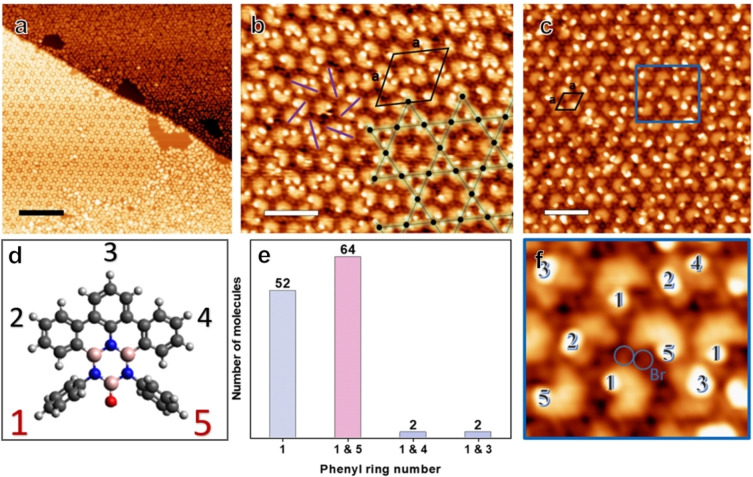
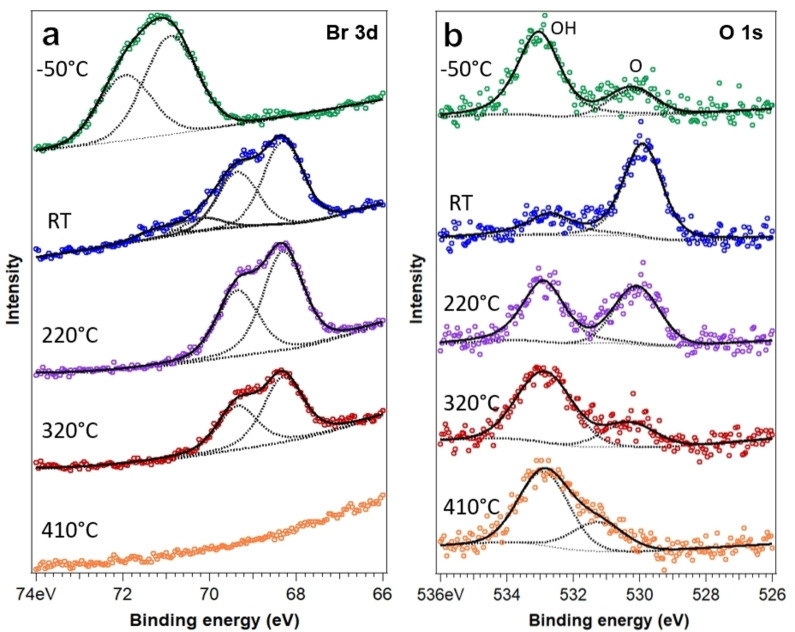
The on-surface synthesis strategy has emerged as a promising route for fabricating well-defined two-dimensional (2D) BN-substituted carbon nanomaterials with tunable electronic properties. This approach relies on specially designed precursors and requires a thorough understanding of the on-surface reaction pathways. It promises precise structural control at the atomic scale, thus complementing chemical vapor deposition (CVD). In this study, we investigated a novel heteroatomic precursor, tetrabromoborazine, which incorporates a BN core and an OH group, on Ag(111) using low temperature scanning tunnelling microscopy/spectroscopy (LT-STM/STS) and X-ray photoelectron spectroscopy (XPS). Through sequential temperature-induced reactions involving dehalogenation and dehydrogenation, distinct tetrabromoborazine derivatives were produced as reaction intermediates, leading to the formation of specific self-assemblies. Notably, the resulting intricate supramolecular structures include a chiral kagomé lattice composed of molecular dimers exhibiting a unique electronic signature. The final product obtained was a random covalent carbon network with BN-substitution and embedded oxygen heteroatoms. Our study offers valuable insights into the significance of the structure and functionalization of BN precursors in temperature-induced on-surface reactions, which can help future rational precursor design. Additionally, it introduces complex surface architectures that offer a high areal density of borazine cores.

Keywords: BNC structure; Borazine; Covalent network; Nanostructures; Surface chemistry.


Conflict of interest statement

The authors declare no conflict of interest.

Figures

Scheme 1
Scheme 1
Atomistic models of (A) unreacted tetrabromoborazine and (B−D) selected reaction products. The figure covers the experimentally accessed temperature range (bottom) and the corresponding on‐surface reaction steps (top), activated upon thermal annealing. Dark grey, dark red, pink, blue, red and white correspond to C, Br, B, N, O, and H, respectively.
Figure 1
Figure 1
STM images of self‐assembled arrays of intact tetrabromoborazine on Ag(111), prepared by deposition at −60 °C. (a) Large scale image including the unit cell (black rhomboid). The white lines indicate the three dense‐packed crystal directions of the Ag(111) lattice. The inset shows a structural model with slight variations in the (out of plane) tilt angles of the rings, which are numbered from 1 to 5 for identification. (Image parameters: It: 44 pA, Vb: 71 mV, scale bar: 3.6 nm). (b) STM image with submolecular resolution. The blue dashed outlines highlight individual tetrabromoborazine molecules, with the bright protrusions attributed to the Br atoms attached to the tilted phenyl rings. The unit cell contains four molecules. (Image parameters: It: 150 pA, Vb: 28 mV, scale bar: 1.3 nm).
Figure 2
Figure 2
(a) STM image of the coexisting self‐assemblies, i. e., the kagomé and hexagonal phase, observed after annealing at 170 °C. (b) STM image of the kagomé phase. The overlayed kagomé lattice points (black dots) are located at the centers of the dimers. The counter clockwise chirality of this domain is indicated by purple lines, the unit cell is represented by the black rhombus. (c) STM image of the hexagonal phase. (d) Molecular model with the numbering of the phenyl rings. (e) Histogram showing the statistics of the tilted phenyl rings of the dimers counted from the kagomé phase in (b). (f) Zoom‐in STM image of the area marked by a blue rectangle, highlighting the tilted phenyl rings (numbered accordingly) and showing the cleaved off Br atoms. (Image parameters (a) It: 0.16 nA, Vb: 1 V, scale bar: 20 nm, (b) It: 0.11 nA, Vb: 1.08 V, scale bar: 4.5 nm, (c) It: 0.13 nA, Vb: 0.82 V, scale bar: 4.1 nm.)
Figure 3
Figure 3
STM images taken after annealing at (a) 320 °C, (b lower panel) 410 °C, and (b upper panel) 440 °C respectively. Inset: Structure of a fully planarized monomer. (c) STM image of the random BNC network obtained by tetrabromoborazine deposition on Ag(111) kept at 410 °C. The superimposed black dashed lines highlight extended oligomeric segments achieved by random coupling of monomeric units. (Image parameters, (a): It: 99 pA, Vb: 1075 mV, scale bar: 2 nm, (b upper panel): It: 0.22 nA, Vb: 1078 mV, scale bar: 37 nm, (b lower panel): It: 68 pA, Vb: −634 mV, scale bar: 5.7 nm, (c): It: 0.49 nA, Vb: 284 mV, scale bar: 1.8 nm).
Figure 4
Figure 4
Evolution of (a) Br 3d doublet and (b) O 1s core level spectra with temperature. The topmost spectrum (in green) was measured at −50 °C. The other spectra were recorded at room temperature (RT, blue), after annealing to 220 °C (purple), 320 °C (red), and finally 410 °C (orange). The low binding energy component reflects carbonyl, whereas the high binding energy component is attributed to hydroxyl at low temperature and to a covalent C−O−B link at higher temperatures.
Figure 5
Figure 5
(a) dI/dV spectra measured on the centres of distinct molecules in the kagomé phase. Monomers are shown in red, dimer molecules featuring two tilted phenyl rings in different shades of green, and dimer molecules featuring one tilted phenyl ring in blue, respectively. The corresponding topography image is shown in the inset (scale bar: 2 nm). (Vb: 2 V, It: 0.13 nA, lock‐in modulation voltage: 100 mV) (b) STM images (left) and the corresponding dI/dV maps measured at constant current (right). The intensity is coloured from red (high) to purple (low). (It: 0.13 nA, lock‐in modulation voltage: 50 mV, scale bar: 1.4 nm)

References

    1. Caputo L., Nguyen V. H., Charlier J. C., Phys. Rev. Mater. 2022, 6, 1–9.
    1. Fu Y., Yang H., Gao Y., Huang L., Berger R., Liu J., Lu H., Cheng Z., Du S., Gao H. J., Feng X., Angew. Chem. Int. Ed. 2020, 59, 8873–8879. - PMC - PubMed
    1. Herrera-Reinoza N., dos Santos A. C., de Lima L. H., Landers R., de Siervo A., Chem. Mater. 2021, 33, 2871–2882.
    1. Gong Y., Shi G., Zhang Z., Zhou W., Jung J., Gao W., Ma L., Yang Y., Yang S., You G., Vajtai R., Xu Q., Macdonald A. H., Yakobson B. I., Lou J., Liu Z., Ajayan P. M., Nat. Commun. 2014, 5, 3193. - PubMed
    1. Ci L., Song L., Jin C., Jariwala D., Wu D., Li Y., Srivastava A., Wang Z. F., Storr K., Balicas L., Liu F., Ajayan P. M., Nat. Mater. 2010, 9, 430–435. - PubMed

LinkOut - more resources