. 2024 Oct 17;187(21):6016-6034.e25.
doi: 10.1016/j.cell.2024.08.013. Epub 2024 Sep 6.

Sex-dependent effects in the aged melanoma tumor microenvironment influence invasion and resistance to targeted therapy

Affiliations

Sex-dependent effects in the aged melanoma tumor microenvironment influence invasion and resistance to targeted therapy

Yash Chhabra et al. Cell. .

Abstract

There is documented sex disparity in cutaneous melanoma incidence and mortality, increasing disproportionately with age and in the male sex. However, the underlying mechanisms remain unclear. While biological sex differences and inherent immune response variability have been assessed in tumor cells, the role of the tumor-surrounding microenvironment, contextually in aging, has been overlooked. Here, we show that skin fibroblasts undergo age-mediated, sex-dependent changes in their proliferation, senescence, ROS levels, and stress response. We find that aged male fibroblasts selectively drive an invasive, therapy-resistant phenotype in melanoma cells and promote metastasis in aged male mice by increasing AXL expression. Intrinsic aging in male fibroblasts mediated by EZH2 decline increases BMP2 secretion, which in turn drives the slower-cycling, highly invasive, and therapy-resistant melanoma cell phenotype, characteristic of the aged male TME. Inhibition of BMP2 activity blocks the emergence of invasive phenotypes and sensitizes melanoma cells to BRAF/MEK inhibition.

Keywords: DNA damage; aging; epigenetics; fibroblast; melanoma; metastasis; senescence; sex dimorphism; sex disparity; therapy resistance; tumor microenvironment.


Conflict of interest statement

Declaration of interests A.T.W. is on the board of reGAIN Therapeutics and the Melanoma Research Foundation. E.M.J. reports other support from Abmeta, personal fees from Genocea, personal fees from Achilles, personal fees from DragonFly, personal fees from Candel Therapeutics, other support from the Parker Institute, grants and other support from Lustgarten, personal fees from Carta, grants and other support from Genentech, grants and other support from AstraZeneca, personal fees from NextCure, and grants and other support from Break Through Cancer outside of the submitted work. D.J.Z. reports grant funding (paid to Johns Hopkins University) from Roche/Genentech. Y.C. and M.E.F. are affiliated with the Cancer Signaling and Microenvironment program, FoxChase Cancer Center, Philadelphia, PA, USA.

Figures

Figure 1.
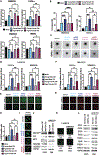
Figure 1.. Age-associated replicative senescence in primary dermal fibroblasts is sex-dependent
(A) Quantification of BrdU incorporation as percentage BrdU-positive nuclei (green) in age and sex-stratified fibroblasts over indicated time points. BrdU was added in media supplemented with charcoal-depleted serum and devoid of phenol red (**p<0.01, *p<0.05, n=3). (B) Representative immunofluorescent images of BrdU incorporation for 16 and 24 hours from (A). Scale bars show 100 μm. (C) Quantification of SA-βgal positive cells in age and sex-stratified fibroblasts (** p<0.01, n=3). (D) Representative images of SA-βgal assay from (C). Scale bars show 100 μm. (E) Immunoblot for SASP proteins in age and sex-stratified fibroblasts. HSP90 was used as loading control. (F) Representative immunofluorescence image of active RB (pRB-Green) and nuclei (DAPI) in age and sex-stratified fibroblasts indicating percentage of p-RB positive nuclei (n=2). Scale bar shows 50 μm (G) Quantification of BrdU incorporation in genetically identical fibroblasts from the same donor (<55 years and >65 years) stratified by sex, represented as paired analysis (before and after) (n=2). (H) Representative images of BrdU incorporation from (G). Scale bars show 100 μm. (I) Quantification of SA-βgal positive cells in genetically identical fibroblasts from the same donor (<55 years and >65 years) stratified by sex, represented as paired analysis (before and after) (n=2). (J) Representative images of SA-βgal assay from (I). Scale bars show 100 μm. (K) Immunoblot of senescence phenotype-associated proteins in genetically identical fibroblasts from the same donor (<55 years and >65 years) stratified by sex. HSP90 was used as loading control. (L) Representative chemokine array blot on the conditioned media derived from aged male and female fibroblasts normalized by cell number. Significantly altered chemokines between the two groups are marked (red box) and numbered (n=2). (M) Heat map of significantly altered chemokines numbered in (L) measured from densitometry analysis (arbitrary units). Values are presented as mean ± SEM. See also Figure S1.
Figure 2.
Figure 2.. Elevated oxidative stress in aged male dermal fibroblasts promotes acquisition of a SASP
(A) Quantification of CellROX-green in age and sex-stratified fibroblasts measured as corrected total cell fluorescence (arbitrary units) (***p<0.001, n=3). (B) Representative images of CellROX-green stained age and sex-stratified fibroblasts from (A). Scale bars show 100 μm. (C) Quantification of MitoSOX-red in age and sex-stratified fibroblasts measured as corrected total cell fluorescence (arbitrary units) (***p<0.001, **p<0.01, *p<0.05, n=3). (D) Representative images of MitoSOX-red stained age and sex-stratified fibroblasts from (C). Scale bars show 100 μm. (E) Quantification of 53BP1 foci in age and sex-stratified fibroblasts measured as percentage of nuclei with >2 foci (****p<0.0001, **p<0.01, n=3). (F) Representative immunofluorescent images of 53BP1 foci (red) in age and sex-stratified fibroblasts from (E). Scale bars show 5 μm (G) Quantification of ROS levels in age and sex-stratified fibroblasts; PBS treated (Mock), 30 minutes after acute (2 mM) hydrogen peroxide treatment and 24 hours after hydrogen peroxide (2 mM for 30 minutes) treatment (***p<0.001, **p<0.01, *p<0.05, n=3). (H) Quantification of γH2Ax foci in fibroblasts treated with PBS (Mock) and measured as percentage γH2Ax positive nuclei with foci> 2 per nuclei and as percentage of cells with indicated number of foci per nuclei (*p<0.05, n=2). (I) Quantification of γH2Ax foci in fibroblasts 24 hours after 30 minutes of hydrogen peroxide (2 mM) treatment and measured as percentage γH2Ax positive nuclei with foci> 2 per nuclei and as percentage of cells with indicated number of foci per nuclei (***p<0.001, **p<0.01, *p<0.05, n=2). (J) Representative immunofluorescent images of γH2Ax (Ser139) in age and sex-stratified fibroblasts treated with PBS (Mock) or 24 hours post-hydrogen peroxide treatment from (H) and (I). Scale bars show 5 μm. (K) Total antioxidants in conditioned media derived from age and sex-stratified fibroblasts measured by ELISA (*p<0.05, n=3). (L) Quantification of CellROX-green in genetically identical fibroblasts from the same donor (<55 years and >65 years) stratified by sex and represented as corrected total cell fluorescence (arbitrary units) (***p<0.001, *p<0.05, n=3). (M) Representative images of CellROX-green from (L). Scale bars show 100 μm. (N) Quantification of MitoSOX-red in genetically identical fibroblasts from the same donor (<55 years and >65 years) stratified by sex and represented as corrected total cell fluorescence (arbitrary units) (*p<0.05, n=3). (O) Representative images of MitoSOX-red from (N). Scale bars show 100 μm. (P) Schematic representation of intrinsic differences in age and sex-stratified fibroblasts. Created with Biorender.com. Values are presented as mean ± SEM. See also Figure S2.
Figure 3.
Figure 3.. Aged male fibroblasts promote maximal invasion and oxidative stress in melanoma cells
(A) Quantification of BrdU incorporation represented as percentage BrdU-positive nuclei (green) in male (WM983b, 1205Lu) and female (WM2664, WM46) melanoma cells subjected to conditioned media from age and sex-stratified fibroblasts for 48 hours. Normal growth media was used as mock control. BrdU was added to the media in the last hour (**p<0.01, *p<0.05, n=3). (B) Quantification of melanoma spheroids subjected to conditioned media from age and sex-stratified fibroblasts for 24 hours (1205Lu) or 72 hours (WM983b). Normal growth media was used as mock control. Invasion represented as percent invasion relative to 0 hours (****p<0.0001, ***p<0.001, **p<0.01, *p<0.05, n=3). (C) Representative brightfield images of melanoma spheroid invasion from (B) with invasive area outlined in black. Images taken at 24 hours (1205Lu) and 72 hours (WM983b) post collagen-embedding. Scale bars show 100 μm. (D) Quantification of CellROX-green in melanoma cell lines 1205Lu and WM983b treated with conditioned media from age and sex-stratified fibroblasts for 48 hours and measured as corrected total cell fluorescence (arbitrary units). Normal growth media was used as mock and data represented as fold change relative to mock (***p<0.001, **p<0.01, *p<0.05, n=3). (E) Representative images of CellROX-green in melanoma cells subjected to conditioned media age and sex-stratified fibroblasts from (D). Scale bars show 100 μm. (F) Quantification of MitoSOX-red in melanoma cell lines 1205Lu and WM983b treated with conditioned media from age and sex-stratified fibroblasts for 48 hours and measured as corrected total cell fluorescence (arbitrary units). Normal growth media was used as mock and data represented as fold change relative to mock (***p<0.001, **p<0.01, *p<0.05, n=3). (G) Representative images of MitoSOX-red in melanoma cells subjected to conditioned media from age and sex-stratified fibroblasts from (F). Scale bars show 100 μm. (H) Quantification of γH2Ax (Ser139) measured as percentage γH2Ax positive nuclei in WM793 melanoma cells subjected to conditioned media from age and sex-stratified fibroblasts for 48 hours. Normal growth media was used as mock (*p<0.05, n=3). (I) Representative images of γH2Ax (Ser139) in WM793 subjected to conditioned media from age and sex-stratified fibroblasts from (H). Scale bars show 10 μm. (J) Immunoblot confirming WNT5A overexpression (OE) in FS13 melanoma line with mCherry OE as control and 48 hours doxycycline (DOX) treatment (1 μg/ml) of FS4 melanoma line transduced with DOX-inducible WNT5A shRNA vector. WNT5A levels (active WNT5a form indicated by black arrow) correlate positively with OXPHOS Complex I (NDUFB8) with no change in Complex III (UQCRC2). HSP90 was used as loading control. (K) Representative images of CellROX-green following modulation of WNT5A expression from (J). Scale bars show 100 μm. (L) Immunoblot analysis of indicated redox proteins following WNT5A modulation from (J). HSP90 was used as loading control. Values are presented as mean ± SEM. See also Figure S3.
Figure 4.
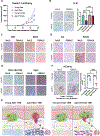
Figure 4.. Age and sex of the host microenvironment regulate melanoma growth and metastasis in vivo
(A) Tumor growth measurement of male murine Yumm1.7-mCherry injected intradermally in immunocompetent C57Bl/6 mice young (8 weeks) and aged (>52 weeks) across both sexes (n=7 mice per group). (B) Histological examination of Ki-67 in Yumm1.7-mCherry primary tumors and quantified as percentage Ki-67 positive nuclei (***p<0.001, n=5 tumors per group). Scale bars show 50 μm. (C) Representative images of Yumm1.7-mCherry primary tumors stained for Mitf and Mertk expression (n=4 tumors per group). Scale bars show 50 μm. (D) Representative images of Yumm1.7-mCherry primary tumors stained for Axl and Wnt5a expression (n=4 tumors per group). Scale bars show 50 μm. (E) Representative images of Yumm1.7-mCherry primary tumors stained for γH2ax (Ser139) and Ape1 expression (n=4 tumors per group). Scale bars show 50 μm. (F) Representative images of lung metastasis stained with mCherry at five weeks post-intradermal injection of Yumm1.7-mCherry cells in young (8 weeks) and aged (>52 weeks) C57Bl/6 mice across both sexes. Black arrow indicates mCherry-positive cells. Scale bars show 50 μm. (G) Diagram summarizing differential effects of host sex and age dermal microenvironment on melanoma cell growth and invasion in vivo. Created with Biorender.com. Values are presented as mean ± SEM. See also Figures S4, S5 and DataS1.
Figure 5.
Figure 5.. Age and sex of the host microenvironment regulate therapy response and resistance
(A) Viability assay on melanoma spheroids treated with age and sex-stratified fibroblast conditioned media in the presence of 3 μM PLX4720 (BRAF inhibitor) and 500 nM PD0325901 (MEK inhibitor) or DMSO (mock) for 48 hours. Viability was assessed by staining with calcein-AM (green) and ethidium homodimer-1 (red/orange), indicating live and dead cells, respectively. Scale bars show 100 μm. (B) Quantification of cell death (total intensity of ethidium homodimer-1) relative to spheroid area (calcein-AM) following BRAFi/MEKi treatment is represented as relative cell death compared to DMSO treatment (****p<0.0001, **p<0.01, *p<0.05, n=3). (C) Tumor growth measurement of Yumm1.7-mCherry injected intradermally in immunocompetent C57Bl/6 mice young (8 weeks) and aged (>52 weeks) across both sexes. Mice were randomized to receive diet containing control chow (control) or BRAFi/MEKi chow (200 mg/kg PLX4720 and 7 mg/kg PD0325901) ad libitum (n=7 mice per control chow group and n=8 mice per BRAFi/MEKi chow group). (D) Kaplan-Meier survival curves for mice treated in (C) indicating the time taken for the tumor to reach a defined size of tumor volume 1500mm3 or death with a Day 50 cut-off, by which all aged mice were euthanized. Values are presented as mean ± SEM. See also Figures S6, S7 and DataS1.
Figure 6.
Figure 6.. BMP2 in the aged male dermal microenvironment promotes melanoma invasion and fibroblast senescence
(A) Proteomics analysis on secreted proteins from healthy non-sun-exposed human dermal fibroblasts from two aged male and two aged female fibroblast lines, each in triplicate. A false discovery rate of less than 5% was considered significant. See also Table S1. (B) Relative gene expression (qRT-PCR) of BMP2 in age and sex-stratified fibroblasts normalized to 18s (n=3). (C) BMP2 ELISA on conditioned media (72 hours) derived from age and sex-stratified fibroblasts, quantified based on the fibroblast cell lysate protein amount (****p<0.0001, **p<0.01, n=3). Immunoblot for recombinant BMP2 (rBMP2) treatment in melanoma lines (D) at indicated concentrations (for 30 minutes) and (E) at indicated time points (at 100 ng/ml). HSP90 or GAPDH was used as loading control. (F) Immunoblot for proliferative (MITF), invasive (AXL, p-MLC2) and mesenchymal (CDH2) markers in melanoma cells treated with rBMP2 (100 ng/ml) at indicated time points. HSP90 was used as loading control. (G) Quantification of BrdU incorporation in melanoma cells treated with rBMP2 (100 ng/ml) or PBS (Mock) for 48 hours. BrdU was added in the last hour (**p<0.01, n=3). (H) Quantification of percent invasion of collagen-embedded melanoma spheroids subjected to rBMP2 treatment (100 ng/ml) or PBS (Mock) for 24 hours (1205Lu) or 72 hours (WM983b) (***p<0.001, **p<0.01, n=3). (I) Representative images from (H) for spheroid invasion following rBMP2 (100 ng/ml) or PBS (Mock) treatment of melanoma cells. Invaded area is outlined in red. Images were taken at 24 hours (1205Lu) and 72 hours (WM983b). Scale bars show 100 μm. (J) Immunoblot of EZH2 and H3K27me3 in age and sex-stratified dermal fibroblasts. HSP90 was used as loading control. (K) Relative gene expression of EZH2 in age and sex-stratified dermal fibroblasts normalized to 18s (n=3). (L) Immunoblot on two young male and female fibroblasts treated with EZH2 inhibitor, GSK126 (5 μM) or DMSO control for four days. HSP90 was used as loading control. (M) Relative gene expression (qRT-PCR) of BMP2 in two young male and female fibroblasts treated with EZH2 inhibitor, GSK126 (5 μM) or DMSO control for four days (n=2). Values are presented as mean ± SEM. See also Figures S8, S9.
Figure 7.
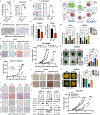
Figure 7.. Modulation of BMP2 levels regulates tumor growth and therapy resistance
(A) ELISA on serum from age-matched (>55 years) healthy male (n=7) and female subjects (n=7) (**p<0.01). (B) ELISA on serum from age-matched (>55 years) healthy male (n=7) and male patients with stage IV melanoma (n=9) (****p<0.001). ELISA ran concurrently with sample from (A). (C) Histological analysis of BMP2 in age-matched stage I/II human melanoma patients (>55 years) stratified by sex. Scale bars show 250 μm. See Figure S7A for corresponding H&E and Table S2. (D) Representative images of Yumm1.7-mCherry and BSC9AJ2-mCherry primary tumors from mice cohorts stained for Bmp2 (n=4 mice per group). Scale bars show 50 μm. (E) Tumor growth measurement of Yumm1.7-mCherry injected intradermally in immunocompetent C57Bl/6 young male (8 weeks) mice and administered with recombinant murine Bmp2 (rmBmp2) (1 μg) or PBS intratumor every alternate day (****p<0.0001, ***p<0.001, n=7 mice per group). (F) Representative images of primary tumors from mice in (E) for Bmp2, Ki-67, Wnt5a, Mitf, Axl, γH2ax (Ser139), activated Smad1/5 (pSmad1/5) and activated Erk1/2 (pErk1/2) (n=5 mice per group). Scale bars show 50 μm. (G) Histological analysis of melanoma metastasis to the lung stained with mCherry (indicated with black arrows) in young male C57Bl/6 mice from (E). Quantification of single melanoma cell metastasis per high power field (HPF) (**p<0.01, n=7 mice per group). Scale bars show 50 μm. (H) Quantification of cell death (total intensity of ethidium homodimer-1) relative to spheroid area (calcein-AM) following PBS or rBMP2 pretreatment (100 ng/ml) prior to BRAFi/MEKi inhibition is represented as relative cell death compared to DMSO treatment (***p<0.001, **p<0.01, n=4). (I) Tumor growth measurement of Yumm1.7-mCherry injected intradermally in immunocompetent C57Bl/6 young male (8 weeks) mice and administered with rmBmp2 (1 μg per mouse) or PBS intratumor every alternate day. Mice were further randomized to receive diet containing control chow (chow) or BRAFi/MEKi chow (BRAFi/MEKi) ad libitum (****p<0.0001, n=5 mice per group). (J) Representative images of Yumm1.7-mCherry primary tumors from mice fed control chow (Naïve) or BRAFi/MEKi chow (Resistant) stained for Bmp2 (n=4 mice per group). Scale bars show 50 μm. (K) Immunoblot analysis of BMP2, ERK1/2 reactivation, invasive signature (AXL, WNT5A (black arrow)) and proliferative signature (MITF) in BRAFi (PLX4720) resistant melanoma cell lines maintained in PLX4720 for over eight weeks in comparison to DMSO control and PLX4720 treatment (48 hours). HSP90 was used as a loading control. (L) Diagram of BMP2-mediated intrinsic resistance in the aged male tumor microenvironment and acquired resistance to targeted therapy in young male tumor microenvironment. Created with Biorender.com. (M) Quantification of BrdU incorporation in melanoma lines subjected to PBS (Mock), rBMP2 (100 ng/ml), recombinant human NOGGIN (rhNOGGIN;1 μg/ml) in normal growth media or conditioned media from aged male fibroblasts alone or in combination with rhNOGGIN for 48 hours (***p<0.001, **p<0.01, *p<0.01, n=3). (N) Representative images for WM983b spheroid invasion following treatment with PBS (Mock), rhNOGGIN (1 μg/ml), rBMP2 (100 ng/ml) in normal growth media, aged male fibroblast-derived conditioned media alone or in combination with rhNOGGIN for 72 hours. Invaded area is outlined in green. Quantification of melanoma spheroids shown as percent invasion relative to 0 hours (****p<0.0001, ***p<0.001, n=4). Scale bars show 100 μm. (O) Viability assay on WM983b melanoma spheroids treated with normal growth media or aged male fibroblast conditioned media in combination with rhNOGGIN or PBS with 3 μM PLX4720 (BRAF inhibitor) and 500 nM PD0325901 (MEK inhibitor) or DMSO (mock) for 48 hours. Viability was assessed by staining with calcein-AM (green) and ethidium homodimer-1 (red/orange), indicating live and dead cells, respectively. Graph representing relative cell death (total intensity of ethidium homodimer-1 to spheroid area) following BRAFi/MEKi treatment compared to DMSO treatment (****p<0.0001, **p<0.01, n=3). Scale bars show 50 μm. (P) Tumor growth measurement of Yumm1.7-mCherry injected intradermally in C57Bl/6 aged male (>52 weeks) mice and administered with rmNoggin (2 μg per mouse) or PBS intratumor every alternate day. Mice were further randomized to receive diet containing control chow (chow) or BRAFi/MEKi chow (BRAFi/MEKi) ad libitum (****p<0.0001, n=5 mice per group). Values are presented as mean ± SEM. See also Figures S10, S11 and DataS1.

References

    1. Balch CM, Soong SJ, Gershenwald JE, Thompson JF, Coit DG, Atkins MB, Ding S, Cochran AJ, Eggermont AM, Flaherty KT, et al. (2013). Age as a prognostic factor in patients with localized melanoma and regional metastases. Ann Surg Oncol 20, 3961–3968. 10.1245/s10434-013-3100-9. - DOI - PMC - PubMed
    1. Cavanaugh-Hussey MW, Mu EW, Kang S, Balch CM, and Wang T. (2015). Older Age is Associated with a Higher Incidence of Melanoma Death but a Lower Incidence of Sentinel Lymph Node Metastasis in the SEER Databases (2003–2011). Ann Surg Oncol 22, 2120–2126. 10.1245/s10434-015-4538-8. - DOI - PubMed
    1. Leiter U, Eigentler T, and Garbe C. (2014). Epidemiology of skin cancer. Adv Exp Med Biol 810, 120–140. 10.1007/978-1-4939-0437-2_7. - DOI - PubMed
    1. Enninga EAL, Moser JC, Weaver AL, Markovic SN, Brewer JD, Leontovich AA, Hieken TJ, Shuster L, Kottschade LA, Olariu A, et al. (2017). Survival of cutaneous melanoma based on sex, age, and stage in the United States, 1992–2011. Cancer Med 6, 2203–2212. 10.1002/cam4.1152. - DOI - PMC - PubMed
    1. Atkins MB, Curiel-Lewandrowski C, Fisher DE, Swetter SM, Tsao H, Aguirre-Ghiso JA, Soengas MS, Weeraratna AT, Flaherty KT, Herlyn M, et al. (2021). The State of Melanoma: Emergent Challenges and Opportunities. Clin Cancer Res 27, 2678–2697. 10.1158/1078-0432.CCR-20-4092. - DOI - PMC - PubMed

MeSH terms

Substances