. 2024 Sep 7;15(1):7827.
doi: 10.1038/s41467-024-52290-w.

Optimal level of human intracranial theta activity for behavioral switching in the subthalamo-medio-prefrontal circuit

Affiliations

Optimal level of human intracranial theta activity for behavioral switching in the subthalamo-medio-prefrontal circuit

Maëva Laquitaine et al. Nat Commun. .

Abstract

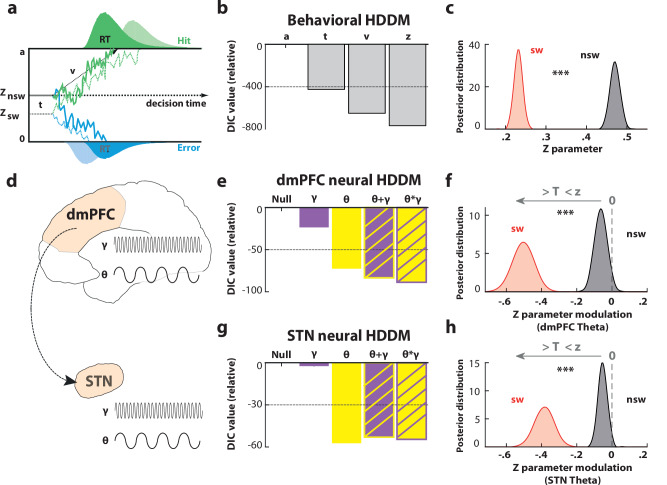
The ability to switch between rules associating stimuli and responses depend on a circuit including the dorsomedial prefrontal cortex (dmPFC) and the subthalamic nucleus (STN). However, the precise neural implementations of switching remain unclear. To address this issue, we recorded local field potentials from the STN and from the dmPFC of neuropsychiatric patients during behavioral switching. Drift-diffusion modeling revealed that switching is associated with a shift in the starting point of evidence accumulation. Theta activity increases in dmPFC and STN during successful switch trials, while temporally delayed and excessive levels of theta lead to premature switch errors. This seemingly opposing impact of increased theta in successful and unsuccessful switching is explained by a negative correlation between theta activity and the starting point. Together, these results shed a new light on the neural mechanisms underlying the rapid reconfiguration of stimulus-response associations, revealing a Goldilocks' effect of theta activity on switching behavior.


Conflict of interest statement

The authors declare no competing interests.

Figures

Fig. 1
Fig. 1. Behavioral task and results.
a Task-switching paradigm. Patients had to indicate on which side the stimulus (STIM) matching the central square color (RULE) was. This response was followed by a feedback cue (FB) indicating whether it was correct and/or whether it fell within the allowed response time window. b Behavioral performances of patients with OCD (upper row; n = 4), epilepsy (EPI: middle row; n = 3) and of healthy controls (HC: bottom row; n = 10). Evolution of hit rates and reaction times averaged according to trial relative position to switch trials (left and central panels) or as a function of trial type (red: switch; black: non-switch) and accuracy (hit or error). Error-bars indicate SEM between patients. Two-tailed paired t-tests showed that patients (OCD and EPI; n = 7) and healthy controls made more errors on switch trials (patients: p = 1.09 × 10−4; HC: p = 5.73 × 10−5), were longer during correct switch trials (p = 9.66 × 10−5; HC: p = 7.61 × 10−5) and their reaction times were also significantly faster during incorrect switch trials relative to incorrect non-switch trials (p = 2.02 × 10−2; HC: 2.29 × 10−2). *p < 0.05. See also Table S3 for statistics across trials of each of the sevent patients. S: switch (sw) trial; S-2 and S + 2: non-switch (nsw) trial occurring two trials before (S-2) or after (S + 2) a switch.
Fig. 2
Fig. 2. dmPFC neural activity during behavioral switching.
a Time-frequency analysis of neural activity time locked on rule (left panels) or on response (right panels) onset across all dmPFC contact-pairs (n = 33). Warm (cold) colors indicate significant increases (decreases) of power (pc< 0.05, FWE cluster-corrected). b Anatomical location of recording sites in the dmPFC plotted on a 3D reference brain. Each colored dot represents a contact-pair displaying a significant modulation in the theta (green) and/or high-gamma (red) during task-switching. c Time course of theta power (5–10 Hz) averaged across correct (red) switch, incorrect switch (orange) or correct non-switch (black) trials (n = 14 dmPFC contact-pairs). Bold traces indicate average activity and shaded areas correspond to SEM across contacts. The black horizontal bar at the bottom indicates time points for which the statistical contrast between incorrect and correct switch trials was significant (pc< 0.05). Orange (red) vertical arrows at the bottom indicate average peak latencies for error (hit) switch trials (averaged across contact-pairs; horizontal lines indicate SEM). Vertical grey shaded rectangles correspond to 95% confidence intervals of RT (left panels) or rule onset (right panels). d Neuro-psychometric curves depicting the relationship between hit rate and averaged theta power (across n = 14 dmPFC contact-pairs) binned into deciles separately during switch and non-switch trials. Error-bars correspond to SEM across contact-pairs. e Time course of high-gamma power (60–200 Hz; n = 8 dmPFC contact-pairs). Bold traces indicate average activity and shaded areas correspond to SEM across contacts. f Neuro-psychometric curves depicting the relationship between hit rate and averaged high-gamma power (across n = 8 dmPFC contact-pairs) binned into deciles separately during switch and non-switch trials. Error-bars correspond to SEM across contact-pairs. dmPFC: dorsomedial prefrontal cortex; Sw: switch; NoSw: non-switch.
Fig. 3
Fig. 3. STN neural activity during behavioral switching.
a Time-frequency analysis of neural activity time locked on rule (left panels) or on response (right panels) onset (contrasts across all STN contact-pairs; n = 24; pc < 0.05 FWE cluster-corrected). b Anatomical location of STN recording locations with higher behavioral switch related theta increase (blue dots) displaying switch-related theta activity. Each contact-pair is plotted on a 3D reconstruction of STN sensorimotor (in green), associative (in purple) and limbic (in brown) territories. c Time course of theta power (5–10 Hz) averaged across correct (red) switch, incorrect switch (orange) or correct non-switch (black) trials (n = 8 STN contact-pairs). Bold traces indicate average activity and shaded areas correspond to SEM across contacts. The black horizontal rectangle at the bottom indicates time points for which the statistical contrast between incorrect and correct switch trials was significant (pc< 0.05). Orange (red) vertical arrows at the bottom indicate average peak latencies for error (hit) switch trials (average across contact-pairs; horizontal lines indicate SEM). Vertical grey shaded rectangles correspond to 95% confidence intervals of RT (left) or rule onset (right). d Neuro-psychometric curves depicting the relationship between hit rate and averaged theta power (across n = 8 STN contact-pairs) binned into deciles separately during switch and non-switch trials. Error-bars correspond to SEM across contact-pairs. e Time course of high-gamma power (60-200 Hz; n = 8 STN contact-pairs). Bold traces indicate average activity and shaded areas correspond to SEM across contacts. f Neuro-psychometric curves depicting the relationship between hit rate and averaged high-gamma power (across n = 8 STN contact-pairs) binned into deciles separately during switch and non-switch trials. Error-bars correspond to SEM across contact-pairs. STN subthalamic nucleus. Sw switch; NoSw: non-switch.
Fig. 4
Fig. 4. Behavioral switching modeling across epileptic and OCD participants.
a Drift diffusion model. Response execution is preceded by an accumulation of evidence increasing sequentially in favor of one of the two options until a boundary is reached. The decision processes start at stimulus onset and at an initial level depending on the subject’s prior beliefs. The initial level turns out to be different per trial type. b Behavioral model comparison. Relative value of the deviance information criterion (DIC) per model when considering the decision threshold model a as a reference. c Behavioral model posteriors. Probability density of the initial level of evidence values for switch and non-switch trials. The initial level of evidence is lower during switch trials in accordance with subjects’ belief of an upcoming non-switch trial. The statistical difference between switch and non-switch posteriors was significant (significance from posterior probabilities: p < 0.001). d Spontaneous trial-by-trial activities included in the neural HDDM (hierarchical drift diffusion model) model space. Neural model comparison for dorsomedial prefrontal cortex (dmPFC; e) and subthalamic nucleus (STN; g). Relative value of the DIC per model with a model based on a normally distributed noise as a reference. Neural model posteriors for dmPFC (f) and STN (h). Probability density for the effect of theta power on the initial level of evidence z. A negative (resp. positive) regression coefficient means z decreases (resp. increases) when theta power increases. Here, the regression coefficient is negative for non-switch trials and strongly negative for switch trials. The statistical difference between switch and non-switch regression coefficient was significant (significance from posterior probabilities: p < 0.001). ***p < 0.001.

References

    1. Monsell, S. Task switching. Trends Cogn. Sci.7, 134–140 (2003). 10.1016/S1364-6613(03)00028-7 - DOI - PubMed
    1. Sakai, K. Task Set and Prefrontal Cortex. Annu. Rev. Neurosci.31, 219–245 (2008). 10.1146/annurev.neuro.31.060407.125642 - DOI - PubMed
    1. Isoda, M. & Hikosaka, O. Switching from automatic to controlled action by monkey medial frontal cortex. Nat. Neurosci.10, 240–248 (2007). 10.1038/nn1830 - DOI - PubMed
    1. Isoda, M. & Hikosaka, O. Role for Subthalamic Nucleus Neurons in Switching from Automatic to Controlled Eye Movement. J. Neurosci.28, 7209–7218 (2008). 10.1523/JNEUROSCI.0487-08.2008 - DOI - PMC - PubMed
    1. Greenhouse, I., Gould, S., Houser, M. & Aron, A. R. Stimulation of contacts in ventral but not dorsal subthalamic nucleus normalizes response switching in Parkinson’s disease. Neuropsychologia51, 1302–1309 (2013). 10.1016/j.neuropsychologia.2013.03.008 - DOI - PMC - PubMed

Publication types

LinkOut - more resources