. 2024 Sep 7;15(1):7832.
doi: 10.1038/s41467-024-51018-0.

Molecular epidemiology and evolutionary characteristics of dengue virus 2 in East Africa

Affiliations

Molecular epidemiology and evolutionary characteristics of dengue virus 2 in East Africa

Sindiso Nyathi et al. Nat Commun. .

Abstract

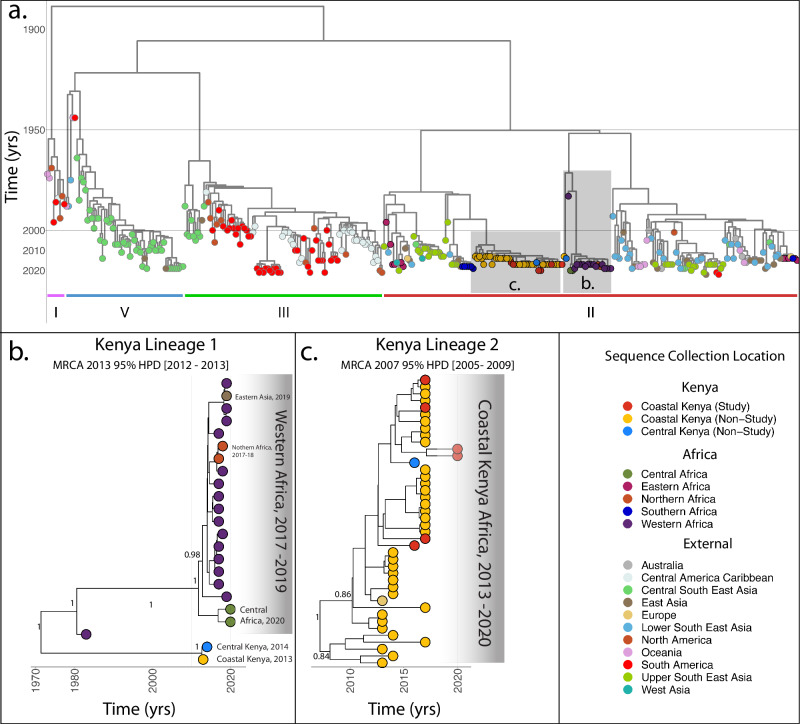
Despite the increasing burden of dengue, the regional emergence of the virus in Kenya has not been examined. This study investigates the genetic structure and regional spread of dengue virus-2 in Kenya. Viral RNA from acutely ill patients in Kenya was enriched and sequenced. Six new dengue-2 genomes were combined with 349 publicly available genomes and phylogenies used to infer gene flow between Kenya and other countries. Analyses indicate two dengue-2 Cosmopolitan genotype lineages circulating in Kenya, linked to recent outbreaks in coastal Kenya and Burkina Faso. Lineages circulating in Western, Southern, and Eastern Africa exhibiting similar evolutionary features are also reported. Phylogeography suggests importation of dengue-2 into Kenya from East and Southeast Asia and bidirectional geneflow. Additional lineages circulating in Africa are also imported from East and Southeast Asia. These findings underscore how intermittent importations from East and Southeast Asia drive dengue-2 circulation in Kenya and Africa more broadly.


Conflict of interest statement

The authors declare no competing interests.

Figures

Fig. 1
Fig. 1. Locations of data collection sites.
Participants were recruited from outpatient clinics in dengue-endemic sites in Kenya: Chulaimbo, a rural inland site; Kisumu, an urban inland site; Msambweni, a rural coastal site; and Ukunda, an urban coastal site, as part of two arbovirus surveillance studies in Kenya. Data collection was conducted in all four sites from 2014 to 2018, and additional data collection was conducted in Kisumu and Ukunda from 2019 to 2022.
Fig. 2
Fig. 2. Maximum-likelihood phylogenetic tree of DENV-2 constructed using six study sequences as well as 37 publicly available sequences from other sites in Kenya and 312 sequences from elsewhere, downloaded from Genbank.
a Maximum likelihood phylogenetic trees were constructed using six partial to complete DENV-2 genomes from the study (>80% coverage) as well as 349 partial to complete genomes (>60% coverage) genomes from publicly available sequences on Genbank, using RAxML-NG with the default convergence bootstrap cut-off of 0.03. Clades containing DENV-2 sequences isolated from Kenya (including study sequences) are highlighted and shown as insets b (Lineage 1) and c (Lineage 2). Sequences collected from study sites are starred. Tip colors indicate sequences collected from regions within Africa, as shown in the legend. As the focus of this analysis, Kenya is separated from other regions in Eastern Africa. DENV-2 genotypes (I–V) are shown as colored bars. Bootstrap support values are shown for nodes of interest.
Fig. 3
Fig. 3. Bayesian timed phylogenetic tree generated from phylogeographic analysis using six study sequences as well as publicly available sequences retrieved from Genbank.
a Timed phylogenetic trees were generated from six partial DENV-2 genomes from this study (>60% coverage) as well as 349 partial genomes (>60% coverage) from publicly available sequences on Genbank. Bayesian phylogeographic analyses were conducted on BEAST1.10.4 to determine tMRCAs as well as reconstruct ancestral sequence locations, with a general time reversible nucleotide substitution model with a Gamma distributed rate and a proportion of invariant sites (GTR + G4 + I) as determined by ModelTest-NG. Tips are colored by location and the legend shows the color corresponding to the specific region of collection of each sequence. Clades containing DENV-2 sequences isolated from Kenya (including study sequences) are highlighted and shown as insets b (Lineage 1), c (Lineage 2) with posterior node probabilities of key nodes shown. DENV-2 genotypes (I–V) are shown as colored bars.
Fig. 4
Fig. 4. Global geographic history of DENV-2 lineage 1 detected in Kenya.
Bayesian maximum clade credibility trees from phylogeographic analyses of 355 sequences were used to reconstruct the geographic history of DENV-2 lineage 1 circulating in Kenya detected in this study. Geolocation data from sequences was grouped into one of 16 study categories (Supplementary Table 3) to improve analytic tractability. a Each arrow in the map corresponds to a node on the MCC tree ancestral to the detected Kenyan lineage indicated in the plot, where a geographic transition between two locations occurred. Lines are annotated with inferred MRCA node date and 95% high posterior density (HPD) intervals. b Markov jump history between locations was recorded for inferred trees and is summarized in the bottom plot. The plot shows the inferred timing of Markov jumps representing transmission between two locations for the geographic history shown in the top plot. Vertical lines represent a geographic transition between two locations, while horizontal lines indicate times during which the ‘lineage’ remains in the same location, i.e. the reward times. Greater density of lines indicates greater certainty of inferred transmission events around a given date, while sparsity of lines indicates lower certainty.
Fig. 5
Fig. 5. Global geographic history of DENV-2 lineage 2 detected in Kenya.
Bayesian maximum clade credibility trees from phylogeographic analyses of 355 sequences were used to reconstruct the geographic history of DENV-2 lineage 1 circulating in Kenya detected in this study. Geolocation data from sequences was grouped into one of 16 study categories (Supplementary Table 3) to improve analytic tractability. a Each arrow in the map corresponds to a node on the MCC tree ancestral to the detected Kenyan lineage indicated in the plot, where a geographic transition between two locations occurred. Lines are annotated with inferred MRCA node date and 95% high posterior density (HPD) intervals. b Markov jump history between locations was recorded for inferred trees and is summarized in the bottom plot. The plot shows the inferred timing of Markov jumps representing transmission between two locations for the geographic history shown in the top plot. Vertical lines represent a geographic transition between two locations, while horizontal lines indicate times during which the ‘lineage’ remains in the same location, i.e. the reward times. Greater density of lines indicates greater certainty of inferred transmission events around a given date, while sparsity of lines indicates lower certainty.
Fig. 6
Fig. 6. Bayesian timed phylogenetic tree showing DENV-2 lineages causing major recent outbreaks in West Africa (Burkina Faso, Senegal—2016−2019), Eastern Africa, and Southern Africa (Angola—2017−2019).
a Timed phylogenetic trees generated in BEAST1.10.4 from 355 DENV-2 genomes showing circulating genetic diversity of DENV-2 in Eastern (b), West (c), and Southern Africa (d).
Fig. 7
Fig. 7. Geographic history of DENV-2 lineages causing major recent outbreaks in West Africa (Burkina Faso, Senegal—2016−2019), Eastern Africa and Southern Africa (Angola—2017−2019).
Bayesian maximum clade credibility trees from phylogeographic analyses of 355 DENV-2 sequences were used to reconstruct the geographic history of the additional lineages causing recent outbreaks in a. Eastern, b Western and c Southern Africa. Each arrow in the map corresponds to a node on the MCC tree ancestral to the detected outbreak-causing lineage indicated in the plot, where a geographic transition between two locations occurred. Lines are annotated with inferred MRCA node date and 95% High Posterior Density (HPD) intervals. (i) indicates the transition from Western to Northern Africa occurring in 2016 95% HPD [2015−2017], and (ii) indicates the transition from Western to Central Africa occurring in 2012 [2010–2014]. Markov jump history between locations was recorded for inferred trees and is summarized in the plots on the right. The plot shows the inferred timing of Markov jumps representing transmission between two locations for the geographic history shown in left plot. Vertical lines represent a geographic transition between two locations, while horizontal lines indicate times during which the ‘lineage’ remains in the same location. Greater density of lines indicates greater certainty of inferred transmission events around a given date, while sparsity of lines indicates lower certainty.

References

    1. Benelli, G. & Mehlhorn, H. Declining malaria, rising of dengue and Zika virus: insights for mosquito vector control. Parasitol. Res.115, 1747–1754 (2016). 10.1007/s00436-016-4971-z - DOI - PubMed
    1. Bhatt, S. et al. The global distribution and burden of dengue. Nature496, 504–507 (2013). 10.1038/nature12060 - DOI - PMC - PubMed
    1. Paixão, E. S., Teixeira, M. G. & Rodrigues, L. C. Zika, chikungunya and dengue: the causes and threats of new and reemerging arboviral diseases. BMJ Glob. Health3, e000530 (2018). 10.1136/bmjgh-2017-000530 - DOI - PMC - PubMed
    1. Patterson, J., Sammon, M. & Garg, M. Dengue, zika and chikungunya: emerging arboviruses in the new world. West. J. Emerg. Med.17, 671–679 (2016). 10.5811/westjem.2016.9.30904 - DOI - PMC - PubMed
    1. Sukhralia, S. et al. From dengue to Zika: the wide spread of mosquito-borne arboviruses. Eur. J. Clin. Microbiol. Infect. Dis.38, 3–14 (2019). 10.1007/s10096-018-3375-7 - DOI - PubMed

Publication types

Associated data

LinkOut - more resources