. 2024 Sep 7;8(1):193.
doi: 10.1038/s41698-024-00666-y.

Multicenter radio-multiomic analysis for predicting breast cancer outcome and unravelling imaging-biological connection

Affiliations

Multicenter radio-multiomic analysis for predicting breast cancer outcome and unravelling imaging-biological connection

Chao You et al. NPJ Precis Oncol. .

Abstract

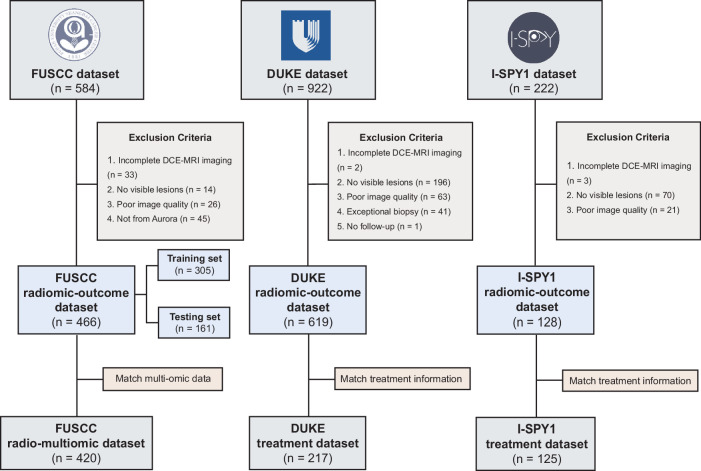
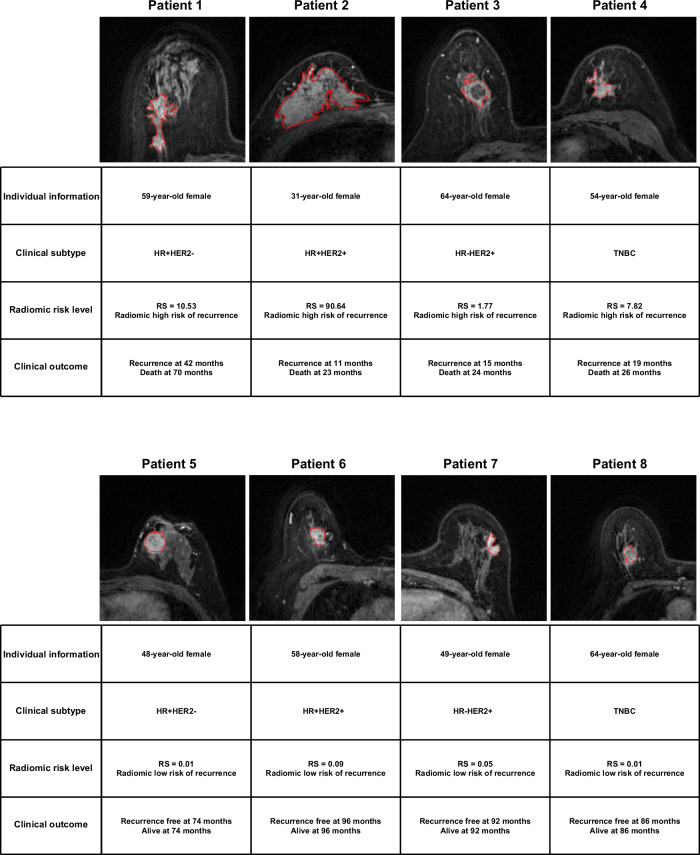
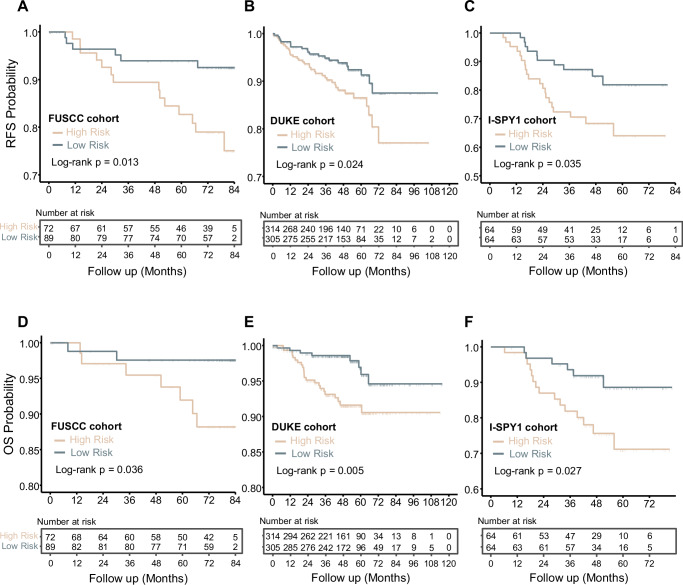
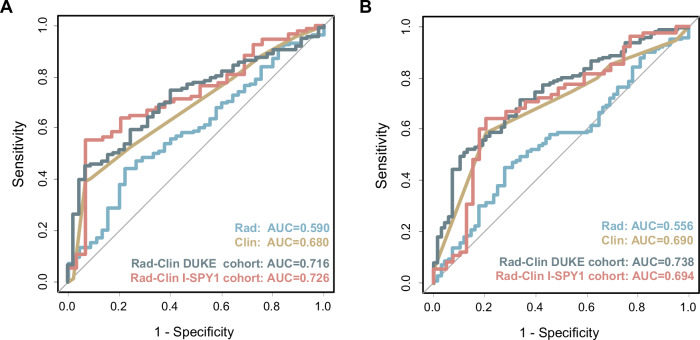
Radiomics offers a noninvasive avenue for predicting clinicopathological factors. However, thorough investigations into a robust breast cancer outcome-predicting model and its biological significance remain limited. This study develops a robust radiomic model for prognosis prediction, and further excavates its biological foundation and transferring prediction performance. We retrospectively collected preoperative dynamic contrast-enhanced MRI data from three distinct breast cancer patient cohorts. In FUSCC cohort (n = 466), Lasso was used to select features correlated with patient prognosis and multivariate Cox regression was utilized to integrate these features and build the radiomic risk model, while multiomic analysis was conducted to investigate the model's biological implications. DUKE cohort (n = 619) and I-SPY1 cohort (n = 128) were used to test the performance of the radiomic signature in outcome prediction. A thirteen-feature radiomic signature was identified in the FUSCC cohort training set and validated in the FUSCC cohort testing set, DUKE cohort and I-SPY1 cohort for predicting relapse-free survival (RFS) and overall survival (OS) (RFS: p = 0.013, p = 0.024 and p = 0.035; OS: p = 0.036, p = 0.005 and p = 0.027 in the three cohorts). Multiomic analysis uncovered metabolic dysregulation underlying the radiomic signature (ATP metabolic process: NES = 1.84, p-adjust = 0.02; cholesterol biosynthesis: NES = 1.79, p-adjust = 0.01). Regarding the therapeutic implications, the radiomic signature exhibited value when combining clinical factors for predicting the pathological complete response to neoadjuvant chemotherapy (DUKE cohort, AUC = 0.72; I-SPY1 cohort, AUC = 0.73). In conclusion, our study identified a breast cancer outcome-predicting radiomic signature in a multicenter radio-multiomic study, along with its correlations with multiomic features in prognostic risk assessment, laying the groundwork for future prospective clinical trials in personalized risk stratification and precision therapy.


Conflict of interest statement

The authors declare no competing interests.

Figures

Fig. 1
Fig. 1. Data curation flowchart.
This study includes three cohort, FUSCC cohort, Duke cohort and I-SPY1 cohort Exclusion criteria were presented in this illustration. Samples with radiomic and clinical follow-up data were incorporated in the radiomic-outcome dataset, in which samples with multiomic data and treatment information comprised the radiomic-multiomic dataset and radiomic-treatment dataset, respectively. DCE-MRI dynamic contrast-enhanced magnetic resonance imaging.
Fig. 2
Fig. 2. Overview of the study.
In the first phase, we extracted radiomic features from three ROIs (i.e., tumor, peri-tumor and tumor-peritumor). In the second phase, we selected candidate features to construct prognosis prediction radiomic signatures and differentiated breast cancer patients into high and low radiomic risk groups. Specifically, Lasso-Cox was applied to select significant radiomic features most related to patient prognosis and then those features were incorporated into a multivariable Cox proportion hazards regression to build the outcome prediction model for breast cancer patients. The radiomic risk score was obtained by a linear weighted sum obtained in the model training process. Patients were allocated into high- and low-risk group according to the median risk score in the training set as threshold. In the third phase, we delved into the biological characteristics of distinct radiomic risk groups. In the fourth phase, we investigated the therapy response prediction value of our radiomic risk signature based on the concept of transfer learning. ROI region of interest.
Fig. 3
Fig. 3. Representative images of eight female patients with high- and low-radiomic-risk breast cancer.
Patient 1 to 4 are assessed as high recurrence risk and patients 5 to 8 as low recurrence risk by our radiomic risk model. The tumors in patients with high radiomic-risk appeared irregular and “aggressive” while the tumors in patients with low radiomic-risk risk appeared regular and “inert” exhibited on DCE-MRI. The tumor contour was delineated. TNBC triple-negative breast cancer, RS risk score.
Fig. 4
Fig. 4. Multi-cohort validation of the performance of the radiomic prognosis prediction signature.
AF Kaplan-Meier (KM) plot in internal and external validation cohort. KM plot of recurrence-free survival (RFS) in the FUSCC testing cohort A, DUKE cohort B and I-SPY1 cohort C and overall survival (OS) in the FUSCC cohort testing cohort D, DUKE cohort E and I-SPY1 cohort F. Patients are stratified according to recurrence risk level based on radiomic prediction model built in the FUSCC cohort training set.
Fig. 5
Fig. 5. Biological characteristics of tumors from high and low recurrence risk predicted by radiomic signature.
A Schema of the radio-multiomic analysis. B, C Transcriptomic analysis reveals top 20 upregulated pathways in tumors from high B and low C radiomic risk group. D Differential abundance score from metabolomic analysis reveals the overall alterations in tumor metabolic pathways between high and low radiomic risk groups.
Fig. 6
Fig. 6. Performance of transfer model from prognosis prediction to treatment response prediction.
A, B Receiver operating characteristic (ROC) curve of the response to neoadjuvant chemotherapy. ROC curve of predictive model using radiomic risk signature, clinical features and combined signature for pCR A and response prediction B. Rad radiomic model, Clin clinical model, Rad-Clin radiomic-clinical model.

References

    1. Sung, H. et al. Global Cancer Statistics 2020: GLOBOCAN estimates of incidence and mortality Worldwide for 36 cancers in 185 countries. CA: A Cancer J. Clin.71, 209–249 (2021). - PubMed
    1. Siegel, R. L., Miller, K. D., Wagle, N. S. & Jemal, A. Cancer statistics, 2023. CA Cancer J. Clin.73, 17–48 (2023). 10.3322/caac.21763 - DOI - PubMed
    1. Waks, A. G. & Winer, E. P. Breast cancer treatment: a review. JAMA321, 288 (2019). 10.1001/jama.2018.19323 - DOI - PubMed
    1. Cancer Genome Atlas Network. Comprehensive molecular portraits of human breast tumours. Nature490, 61–70 (2012). - PMC - PubMed
    1. Jiang, X. et al. An MRI deep learning model predicts outcome in rectal cancer. Radiology307, e222223 (2023). 10.1148/radiol.222223 - DOI - PubMed

LinkOut - more resources