. 2024 Sep 7;15(1):7831.
doi: 10.1038/s41467-024-52262-0.

Integrated landscape of plasma metabolism and proteome of patients with post-traumatic deep vein thrombosis

Affiliations

Integrated landscape of plasma metabolism and proteome of patients with post-traumatic deep vein thrombosis

Kun Zhang et al. Nat Commun. .

Abstract

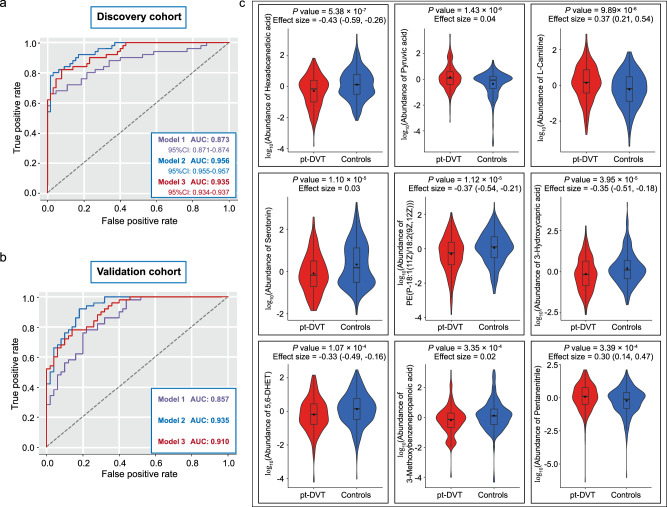
Deep vein thrombosis (DVT) is a leading cause of morbidity and mortality after trauma. Here, we integrate plasma metabolomics and proteomics to evaluate the metabolic alterations and their function in up to 680 individuals with and without DVT after trauma (pt-DVT). We identify 28 metabolites and 2 clinical parameter clusters associated with pt-DVT. Then, we develop a panel of 9 metabolites (hexadecanedioic acid, pyruvic acid, L-Carnitine, serotonin, PE(P-18:1(11Z)/18:2(9Z,12Z)), 3-Hydroxycapric acid, 5,6-DHET, 3-Methoxybenzenepropanoic acid and pentanenitrile) that can predict pt-DVT with high performance, which can be verified in an independent cohort. Furthermore, the integration analysis of metabolomics and proteomics data indicates that the upregulation of glycolysis/gluconeogenesis-TCA cycle may promote thrombosis by regulating ROS levels in red blood cells, suggesting that interfering with this process might be potential therapeutic strategies for pt-DVT. Together, our study comprehensively delineates the metabolic and hematological dysregulations for pt-DVT, and provides potential biomarkers for early detection.


Conflict of interest statement

The authors declare no competing interests.

Figures

Fig. 1
Fig. 1. The design and analyses workflow of study.
a The design of the current study. b The analysis workflow of the current study. OPLS-DA, orthogonal partial least squares discriminant analysis; DSPC, debiased sparse partial correlation; ROC, receiver operating characteristic.
Fig. 2
Fig. 2. Metabolic profiles discriminating pt-DVT patients and controls.
a Metabolite distribution over pathway-based classes. b Volcano plot of differential metabolites. The Benjamin-Hochberg false discovery rate (FDR) method was used to address multiple comparisons. Metabolites with a fold change of < 3/4 or > 4/3 and adjusted P value of two-tailed unpaired Student’s t test/Mann-Whitney U-test less than 0.05 (FDR < 0.05) are considered significantly decreased (blue) or increased (pink). Changes in other metabolites are not significant. The top 10 increased and decreased metabolites are labeled. c Plot of orthogonal partial least squares discriminant analysis (OPLS-DA) score. d Variable importance in projection (VIP) score of OPLS-DA model. Red dots represent the metabolites that significantly (based on fold change and two-tailed unpaired Student’s t test/Mann-Whitney U-test) altered in pt-DVT patients. e Heatmap of 28 differential metabolites throughout individuals. Red indicates metabolites that are increased, and blue indicates metabolites that are decreased in pt-DVT patients compared to controls. Source data are provided as a Source Data file.
Fig. 3
Fig. 3. Dysregulation of multiple metabolic pathways related to pt-DVT.
a Debiased sparse partial correlation (DSPC) network of 28 significantly altered metabolites. Here, each node represents a metabolite, and each edge represents the strength of partial correlation between two metabolites. Edge weights represent the partial correlation coefficient. b Metabolic pathway undergoing significant changes in pt-DVT patients. The Benjamin-Hochberg false discovery rate (FDR) method was used to address multiple comparisons. Red dots mean pt-DVT related pathways with an adjusted P value of two-tailed Global test less than 0.05 (FDR < 0.05). c A pathway-based analysis of metabolic changes for pt-DVT. The differential abundance (DA) score captures the average gross change for all metabolite measures in a pathway. A score of 1 indicates that all annotated metabolites in the pathway increase in pt-DVT patients compared to controls, and a score of − 1 indicates that all annotated metabolites in the pathway decrease. The size of the dot represents the number of annotated metabolites in the pathway. Source data are provided as a Source Data file.
Fig. 4
Fig. 4. Differential clinical parameters for pt-DVT and related metabolic dysregulation.
a Volcano plot of differential clinical parameters (CPs). The Benjamin-Hochberg false discovery rate (FDR) method was used to address multiple comparisons. CPs with a fold change of < 3/4 or > 4/3 and adjusted P value of two-tailed unpaired Student’s t test/Mann-Whitney U-test less than 0.05 (FDR < 0.05) are considered significantly decreased (blue) or increased (pink). Changes in other CPs are not significant. All significant increased and decreased CPs are labeled. b Correlation matrix colored by the two-tailed Pearson correlation coefficient of each pair of pt-DVT-related CPs across samples. The Benjamin-Hochberg false discovery rate (FDR) method was used to address multiple comparisons. The asterisk (*) represents that each pair is significantly correlated (FDR < 0.05), and the P value < 0.0001 are marked in white. c, d Associations between pt-DVT related metabolites and PLT cluster (c) and RBC cluster (d) using linear regression model in 580 participants from the discovery cohort. The Benjamin-Hochberg false discovery rate (FDR) method was used to address multiple comparisons. Metabolites with adjusted two-tailed P value less than 0.05 (FDR < 0.05) are considered significant. Data are presented as coefficients ± SE. e, f Metabolic dysregulation associated with PLT cluster (e) and RBC cluster (f). Diamond represents the metabolite that was significantly (FDR < 0.05) associated with CP clusters, while ellipse is the pathway associated with the metabolites. Ellipse size represents the enrichment ratio of the pathway. Each edge represents that the metabolites can be annotated in the pathway, and the dotted edge suggests a close relationship between the pathways. Source data are provided as a Source Data file.
Fig. 5
Fig. 5. Machine learning identified features to discriminate pt-DVT.
a Area under the receiver operating characteristic curve (AUROC) of model 1 (CPs only), model 2 (metabolites only), and model 3 (CPs and metabolites) in the discovery cohort. b AUROC of model 1, model 2, and model 3 in the validation cohort. c Box and violin plot shows the relative abundance of 9 features in model 2 across 580 samples in the discovery cohort. Statistical analyses were performed by two-tailed unpaired Student’s t test/Mann-Whitney U-test, and data were presented as mean ± SD. The effect size of t test was presented as Cohen’s D value and 95% confidence interval (CI). Box-plot, center line, median; box limits, upper and lower quartiles; whiskers, 1.5x interquartile range. Source data are provided as a Source Data file.
Fig. 6
Fig. 6. Metabolomics and proteomics analyses reveal potential therapeutic strategies for pt-DVT.
a Volcano plot of differential proteins. The Benjamin-Hochberg false discovery rate (FDR) method was used to address multiple comparisons. Proteins with a fold change of < 3/4 or > 4/3 and adjusted P value of two-tailed unpaired Student’s t test/Mann-Whitney U-test less than 0.05 (FDR < 0.05) are considered significantly decreased or increased. Changes in other proteins are not significant. The top 40 changed proteins are labeled. b KEGG pathway enrichment of differential proteins identified 15 significant pathways associated with pt-DVT. The Benjamin-Hochberg false discovery rate (FDR) method was used to address multiple comparisons. Pathways with an adjusted P value of one-tailed Fisher Exact test less than 0.05 (FDR < 0.05) are considered significant enrichment. c Schema of metabolic pathways (glycolysis/gluconeogenesis and TCA cycles) with select metabolites and proteins. Metabolites and proteins with upregulated, downregulated, and unchanged were colored in red, blue, and black, respectively. Gray nodes represent proteins that were not detected. Statistical analyses were performed by two-tailed unpaired Student’s t test/Mann-Whitney U-test, and data were presented as mean ± SD. The effect size of t test was presented as Cohen’s D value and 95% confidence interval (CI). Box-plot, center line, median; box limits, upper and lower quartiles; whiskers, 1.5x interquartile range. Source data are provided as a Source Data file.

References

    1. Wolberg, A. S., et al. Venous thrombosis. Nat. Rev. Dis. Primers1, 15006 (2015). - PubMed
    1. Kafeza, M. et al. A systematic review of clinical prediction scores for deep vein thrombosis. Phlebology32, 516–531 (2017). 10.1177/0268355516678729 - DOI - PubMed
    1. Beckman, M. G., Hooper, W. C., Critchley, S. E. & Ortel, T. L. Venous thromboembolism a public health concern. Am. J. Prev. Med.38, S495–S501 (2010). 10.1016/j.amepre.2009.12.017 - DOI - PubMed
    1. Strandvik, G., El-Menyar, A., Asim, M., Galwankar, S. & Al-Thani, H. Clinical characteristics, management practices, and in-hospital outcomes among trauma patients with venous thromboembolism. J. Emerg. Trauma Shock13, 124–130 (2020). 10.4103/JETS.JETS_83_19 - DOI - PMC - PubMed
    1. Geerts, W. H., Code, K. I., Jay, R. M., Chen, E. L. & Szalai, J. P. A prospective-study of venous thromboembolism after major trauma. N. Engl. J. Med.331, 1601–1606 (1994). 10.1056/NEJM199412153312401 - DOI - PubMed

Publication types

LinkOut - more resources