. 2024 Sep 7;12(1):168.
doi: 10.1186/s40168-024-01881-2.

Highly accurate and sensitive absolute quantification of bacterial strains in human fecal samples

Affiliations

Highly accurate and sensitive absolute quantification of bacterial strains in human fecal samples

Fuyong Li et al. Microbiome. .

Abstract

Background: Next-generation sequencing (NGS) approaches have revolutionized gut microbiome research and can provide strain-level resolution, but these techniques have limitations in that they are only semi-quantitative, suffer from high detection limits, and generate data that is compositional. The present study aimed to systematically compare quantitative PCR (qPCR) and droplet digital PCR (ddPCR) for the absolute quantification of Limosilactobacillus reuteri strains in human fecal samples and to develop an optimized protocol for the absolute quantification of bacterial strains in fecal samples.

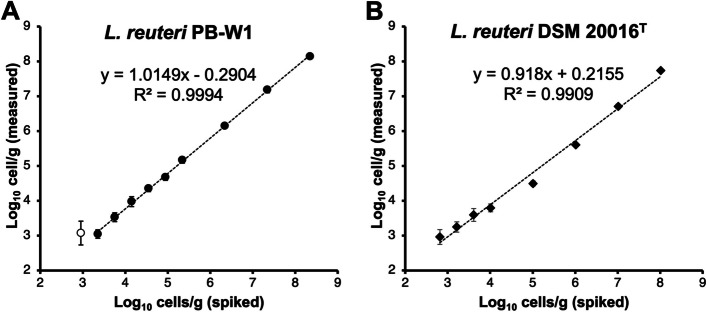
Results: Using strain-specific PCR primers for L. reuteri 17938, ddPCR showed slightly better reproducibility, but qPCR was almost as reproducible and showed comparable sensitivity (limit of detection [LOD] around 104 cells/g feces) and linearity (R2 > 0.98) when kit-based DNA isolation methods were used. qPCR further had a wider dynamic range and is cheaper and faster. Based on these findings, we conclude that qPCR has advantages over ddPCR for the absolute quantification of bacterial strains in fecal samples. We provide an optimized and easy-to-follow step-by-step protocol for the design of strain-specific qPCR assays, starting from primer design from genome sequences to the calibration of the PCR system. Validation of this protocol to design PCR assays for two L. reuteri strains, PB-W1 and DSM 20016 T, resulted in a highly accurate qPCR with a detection limit in spiked fecal samples of around 103 cells/g feces. Applying our strain-specific qPCR assays to fecal samples collected from human subjects who received live L. reuteri PB-W1 or DSM 20016 T during a human trial demonstrated a highly accurate quantification and sensitive detection of these two strains, with a much lower LOD and a broader dynamic range compared to NGS approaches (16S rRNA gene sequencing and whole metagenome sequencing).

Conclusions: Based on our analyses, we consider qPCR with kit-based DNA extraction approaches the best approach to accurately quantify gut bacteria at the strain level in fecal samples. The provided step-by-step protocol will allow scientists to design highly sensitive strain-specific PCR systems for the accurate quantification of bacterial strains of not only L. reuteri but also other bacterial taxa in a broad range of applications and sample types. Video Abstract.

Keywords: Lactobacillus; Limosilactobacillus reuteri; DNA extraction; Strain-specific primers; ddPCR; qPCR.


Conflict of interest statement

The authors declare no competing interests.

Figures

Fig. 1
Fig. 1
A flow chart of main steps for designing and validating strain-specific primers
Fig. 2
Fig. 2
Relationships between actual spiked cells/g of L. reuteri DSM 17938 and measured cells/g from qPCR and ddPCR assays, based on three different DNA extraction methods. Phenol–chloroform-based method (PC) combined with qPCR (A) and ddPCR (B). QIAamp fast stool DNA kit-based method (QK) combined with qPCR (C) and ddPCR (D). Protocol Q-based method combined with qPCR (E) and ddPCR (F). Spiked cells/g of L. reuteri DSM 17938 was estimated from quantitative culture on the MRS plate. Each bacterial concentration was conducted in biological triplicates
Fig. 3
Fig. 3
The accuracy (represented by the recovery rate) of qPCR and ddPCR. DNA extracted from fecal samples (biological triplicates) spiked with L. reuteri DSM 17938 using QK (A) and PQ (B) were analyzed by qPCR and ddPCR. The recovery rate is defined as the ratio between the cell numbers per gram feces measured and the actual cell numbers spiked, as suggested previously [43]. Results were compared with 100% recovery which is indicated by the dotted line. QK, QIAamp Fast Stool DNA Kit-based method and PQ, protocol Q-based method
Fig. 4
Fig. 4
Linearity between the number of L. reuteri cells spiked to stool samples and the cell number measured using our designed qPCR assays for PB-W1 (A) and DSM 20016 T (B). The regression line was created between the spiking of 3.35 and 8.34 Log10 cells/g feces for PB-W1 and between 2.81 and 8.01 Log10 cells/g feces for DSM 20016 T, respectively, within which detection was reliable. As amplification products were still detectable but lacked reproducibility and linearity with an input of PB-W1 (2.96 Log10 cells/g feces), it was shown in open round to highlight the difference. Each error bar displays the standard deviation (SD) from three replicates
Fig. 5
Fig. 5
A Quantification of L. reuteri in human fecal samples collected at baseline (BL; prior to L. reuteri administration) and after treatment (4 days after receiving a single dose of L. reuteri PB-W1 or DSM 20016 T). Quantification was performed using strain-specific qPCR, selective culture, 16S rRNA gene sequencing, and whole metagenome sequencing (WMS). The horizontal dotted lines denote the detection limits of qPCR and selective culture, at around three and two Log10 cells/g feces, respectively. Values below the detection limit were plotted with a numerical value of one. B Parity plot comparing viable cell counts of L. reuteri matching the respective inocula in individuals receiving PB-W1 (open symbols) or DSM 20016 T (black symbols) to the absolute abundance of the two strains as determined by qPCR (circles) or to relative abundance of L. reuteri determined by 16S rRNA gene sequencing (squares). The diagonal line denotes unity, while the horizontal line denotes the detection limit of qPCR at around three Log10 cells/g and the vertical line denotes the detection limit of selective culture at two Log10 cells/g feces. The detection limit of 16S rRNA gene sequencing is not shown, as it differs from sample to sample depending on the total cell count and the number of reads per sample. The symbols represent samples obtained from 19 individuals who received either L. reuteri PB-W1 (n = 8) or DSM 20016T (n = 11)

References

    1. Forster SC, Kumar N, Anonye BO, Almeida A, Viciani E, Stares MD, et al. A human gut bacterial genome and culture collection for improved metagenomic analyses. Nat Biotechnol. 2019;37:186–92. 10.1038/s41587-018-0009-7 - DOI - PMC - PubMed
    1. Yatsunenko T, Rey FE, Manary MJ, Trehan I, Dominguez-Bello MG, Contreras M, et al. Human gut microbiome viewed across age and geography. Nature. 2012;486:222–7. 10.1038/nature11053 - DOI - PMC - PubMed
    1. Geva-Zatorsky N, Sefik E, Kua L, Pasman L, Tan TG, Ortiz-Lopez A, et al. Mining the human gut microbiota for immunomodulatory organisms. Cell. 2017;168:928–943.e911. 10.1016/j.cell.2017.01.022 - DOI - PMC - PubMed
    1. Buffie CG, Bucci V, Stein RR, McKenney PT, Ling L, Gobourne A, et al. Precision microbiome reconstitution restores bile acid mediated resistance to Clostridium difficile. Nature. 2015;517:205–8. 10.1038/nature13828 - DOI - PMC - PubMed
    1. Conlon MA, Bird AR. The impact of diet and lifestyle on gut microbiota and human health. Nutrients. 2014;7:17–44. 10.3390/nu7010017 - DOI - PMC - PubMed

MeSH terms

LinkOut - more resources