. 2024 Nov 6;32(11):3932-3954.
doi: 10.1016/j.ymthe.2024.09.011. Epub 2024 Sep 7.

Prevention of prostate cancer metastasis by a CRISPR-delivering nanoplatform for interleukin-30 genome editing

Affiliations

Prevention of prostate cancer metastasis by a CRISPR-delivering nanoplatform for interleukin-30 genome editing

Cristiano Fieni et al. Mol Ther. .

Abstract

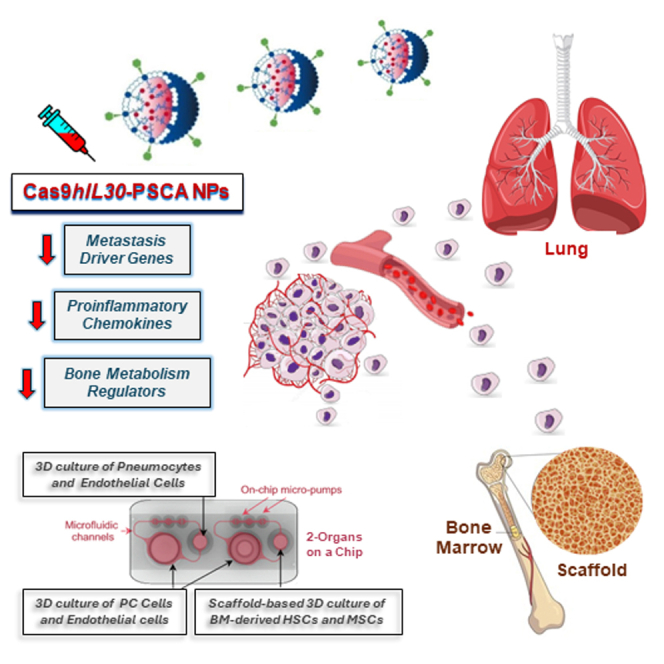
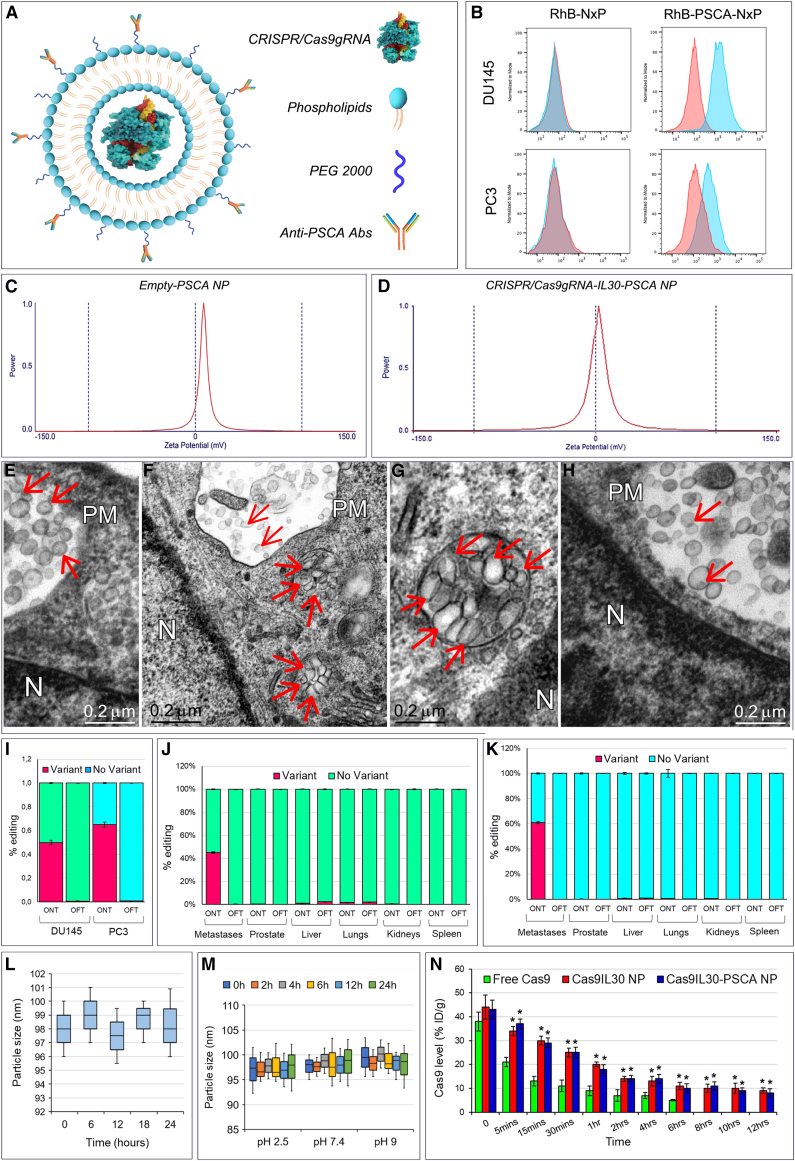
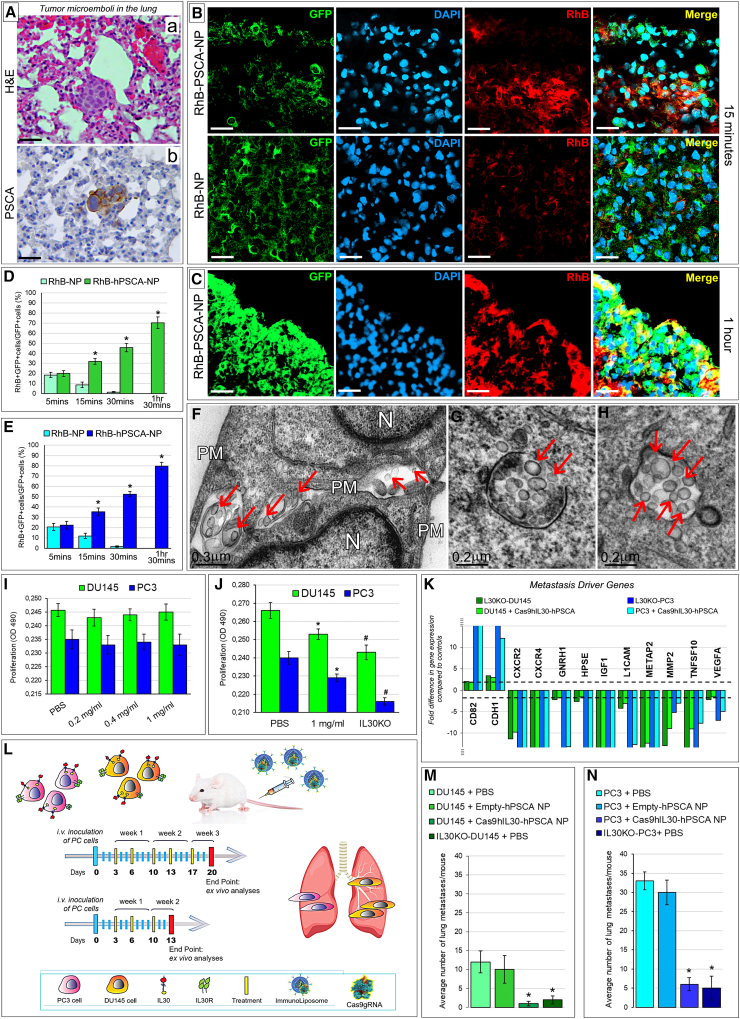
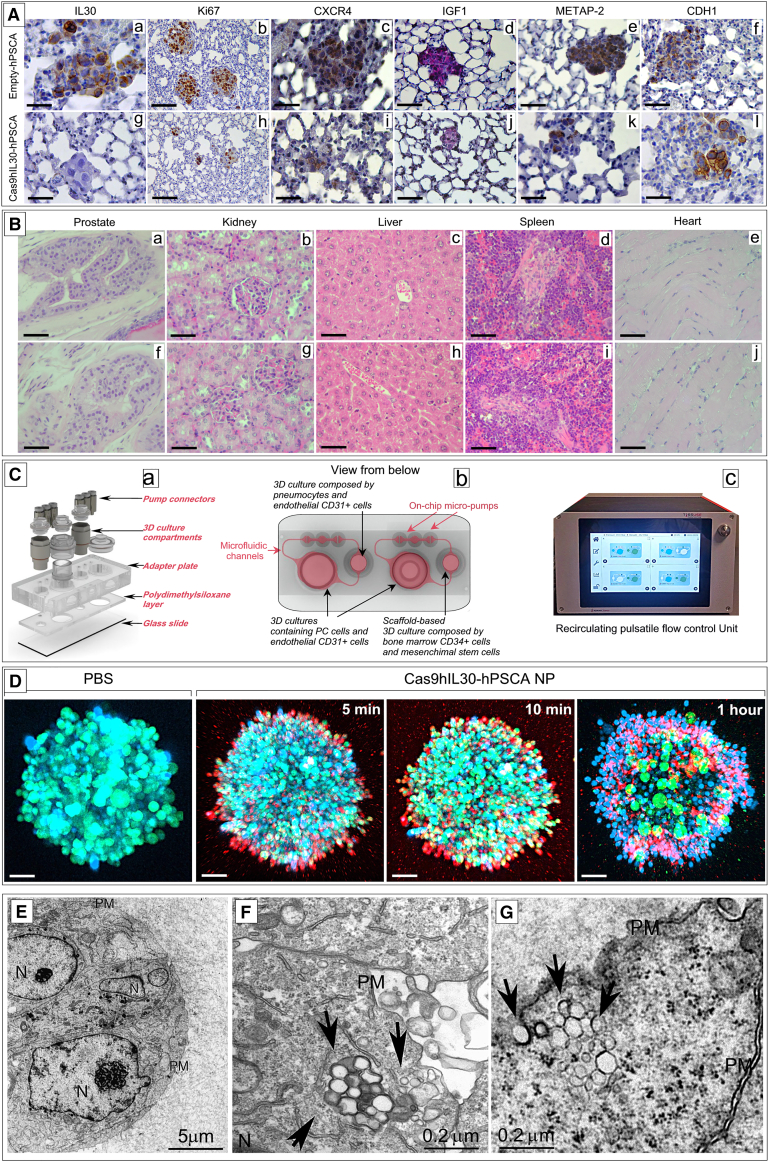
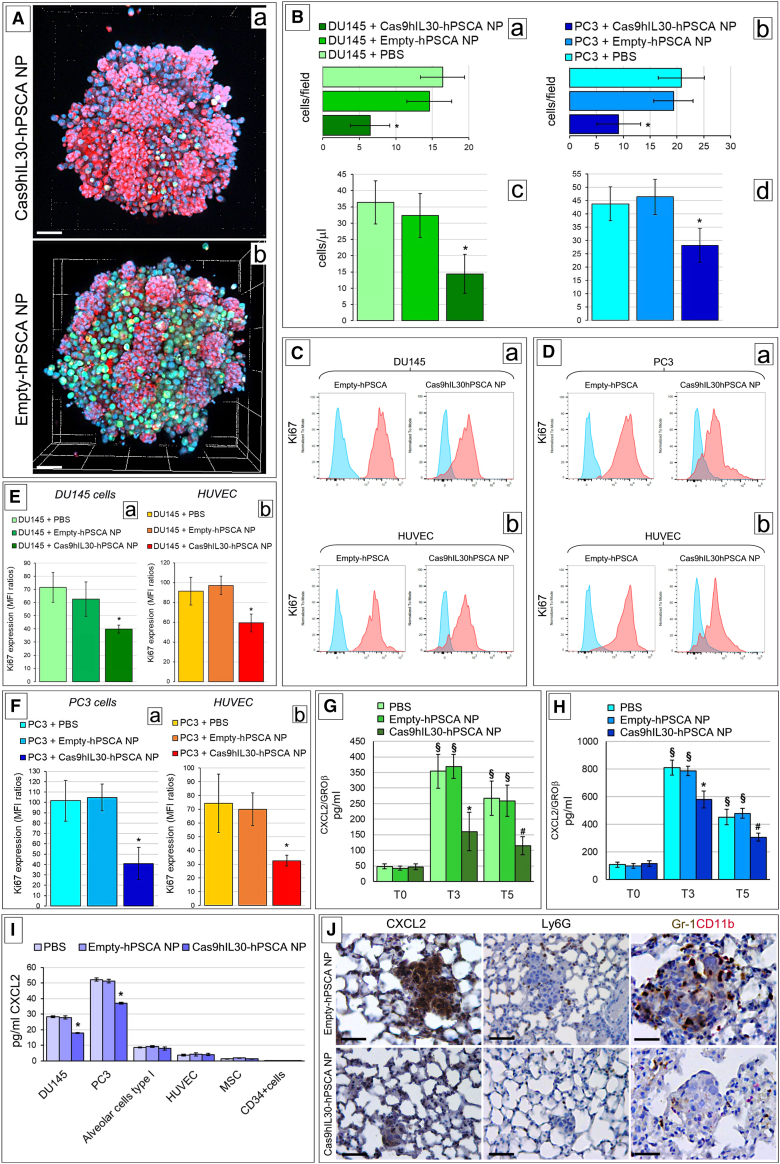
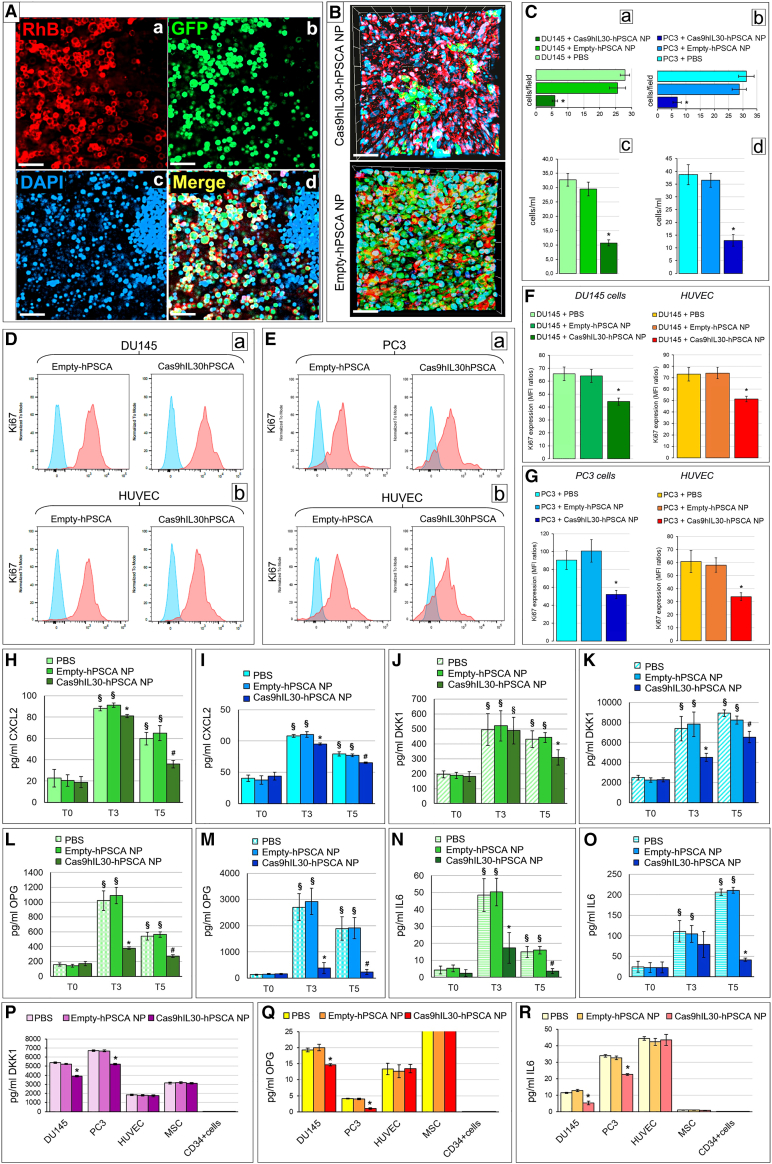
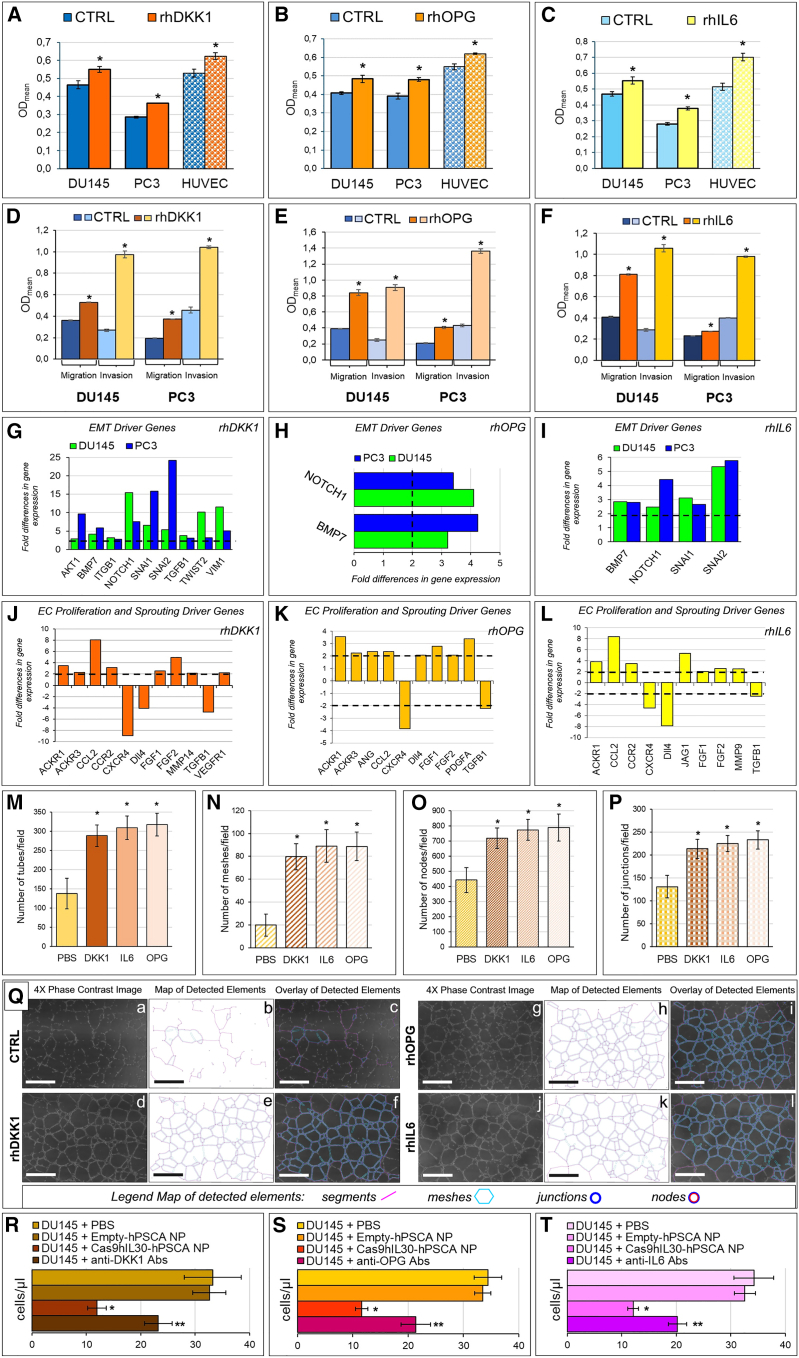
Prostate cancer (PC) is a leading cause of cancer-related deaths in men worldwide. Interleukin-30 (IL-30) is a PC progression driver, and its suppression would be strategic for fighting metastatic disease. Biocompatible lipid nanoparticles (NPs) were loaded with CRISPR-Cas9gRNA to delete the human IL30 (hIL30) gene and functionalized with anti-PSCA-Abs (Cas9hIL30-PSCA NPs). Efficiency of the NPs in targeting IL-30 and the metastatic potential of PC cells was examined in vivo in xenograft models of lung metastasis, and in vitro by using two organ-on-chip (2-OC)-containing 3D spheroids of IL30+ PC-endothelial cell co-cultures in circuit with either lung-mimicking spheroids or bone marrow (BM)-niche-mimicking scaffolds. Cas9hIL30-PSCA NPs demonstrated circulation stability, genome editing efficiency, without off-target effects and organ toxicity. Intravenous injection of three doses/13 days, or five doses/20 days, of NPs in mice bearing circulating PC cells and tumor microemboli substantially hindered lung metastasization. Cas9hIL30-PSCA NPs inhibited PC cell proliferation and expression of IL-30 and metastasis drivers, such as CXCR2, CXCR4, IGF1, L1CAM, METAP2, MMP2, and TNFSF10, whereas CDH1 was upregulated. PC-Lung and PC-BM 2-OCs revealed that Cas9hIL30-PSCA NPs suppressed PC cell release of CXCL2/GROβ, which was associated with intra-metastatic myeloid cell infiltrates, and of DKK1, OPG, and IL-6, which boosted endothelial network formation and cancer cell migration. Development of a patient-tailored nanoplatform for selective CRISPR-mediated IL-30 gene deletion is a clinically valuable tool against PC progression.

Keywords: CRISPR-Cas9; immunoliposomes; interleukins; metastasis; nanotechnology; prostate cancer.


Conflict of interest statement

Declaration of interests The authors declare no competing interests.

Figures

None
Graphical abstract
Figure 1
Figure 1
Physical characterization of immunoliposomes, binding to and taken up by prostate cancer cells (A) Therapeutic nanoplatform consisting of spherical immunoliposomes of less than 1 μm in diameter, loaded with CRISPR-Cas9gRNA targeting the human IL30 gene, and functionalized, via an aldehyde-maleimide reaction that links the Fc domain of the anti-PSCA Abs on the PEG derivatives present on the external bilayer of the nanoparticles. (B) Flow cytometric assessment of the specific binding of anti-hPSCA-conjugated/rhodamine-labeled nanoliposomes (RhB-hPSCA-NPs) to the surface of DU145 (top right) and PC3 (bottom right) cells, compared with unconjugated/rhodamine-labeled nanoliposomes (RhB-NPs) (top left and bottom left). Blue areas, anti-hPSCA conjugated or unconjugated NPs; red areas, isotype controls. Experiments were performed in triplicate. (C and D) Dynamic laser light scattering analysis of the zeta potential of empty-PSCA NP (20.41 ± 3.16 mV) (C) and of the zeta potential of Cas9hIL30-PSCA NP (5.05 ± 1.60 mV) (D). (E–H) Transmission electron microscopy (TEM) images show that NPs consist of spherical vesicles homogeneous in size and shape (E), which are quickly taken up and endocytosed by PC (DU145) cells when conjugated with anti-PSCA Abs (Cas9hIL30-PSCA NPs) (F). (G) A magnification of endocytosed NPs compared with unconjugated NPs (Cas9hIL30 NPs). (H) Nanoparticles are indicated by arrows. N, nuclei; PM, plasma membrane. Ultrastructural images of NP-treated PC3 cells are comparable with those of NP-treated DU145 cells. (I) On-target and off-target characterization of CRISPR-Cas9gRNA-mediated hIL30 editing, delivered by immunoliposomes in vitro. Average frequency of CRISPR-Cas9-induced variants in the IL30 gene (editing efficiency or on-target effects [ONTs]) and in off-target sites (Off-target effects [OFTs]) in DU145 and PC3 cell lines treated with Cas9hIL30-PSCA NPs. The frequency of variants (ONTs and OFTs) in cells treated with PBS or empty-hPSCA NPs (controls) was <0.1%. Experiments were performed in triplicate. (J and K) On-target and off-target characterization of CRISPR-Cas9gRNA-mediated hIL30 editing delivered by immunoliposomes in vivo. Average frequency of CRISPR-Cas9-induced variants in the IL30 gene (editing efficiency or ONTs) and in OFTs in the indicated organs of DU145 (J) and PC3 (K) metastases-bearing NSG mice treated with Cas9hIL30-PSCA NPs. The frequency of variants (ONTs and OFTs) in organs of mice treated with PBS or empty-hPSCA NPs (controls) was <0.1%. (L and M) Serum (L) and pH (M) stability of the Cas9hIL30-PSCA NPs measured at different time points over a 24h period. Experiments were performed in triplicate. (N) Pharmacokinetics of free Cas9 and Cas9hIL30 NPs, conjugated or unconjugated with anti-hPSCA Abs in DU145 metastasis-bearing NSG mice. % ID/g, percentage of total injected dose per weight. ANOVA, p < 0.001. ∗p < 0.01, Tukey HSD test versus free Cas9.
Figure 2
Figure 2
Treatment of lung PC microemboli with immunoliposomes carrying Cas9gRNA-hIL30 (A) Hematoxylin and eosin (H&E) (a) and immunohistochemical staining for PSCA (b) of DU145 tumor cell clusters observed in the lung of NSG mice 3 days after cancer cell inoculation into the dorsal tail vein (intravenously [i.v.]). Similar images were obtained from PC3 tumor cell clusters. Magnification: ×400. Scale bars, 40 μm. (B and C) Confocal microscopy images of lungs from NSG mice bearing GFP-labeled DU145 tumor microemboli (developed 3 days after i.v. cancer cell injection), after 15 min (B, top pictures) and 1 h (C) from i.v. inoculation of (red-labeled) RhB-hPSCA-NPs. The signal intensity starts to decline 10 min after inoculation in the case of unconjugated RhB-NPs (B, bottom). Similar results were obtained from NSG mice, bearing GFP-labeled PC3 tumor microemboli inoculated with RhB-hPSCA-NPs or RhB-NPs. DAPI, DNA-stained nuclei. Magnification: ×400. Scale bars, 40 μm. (D and E) Quantification, by LSC, of the NP uptake in DU145 (D, green bars) and PC3 (E, blue bars) tumor microemboli developed in NSG mice. The uptake by tumor cell clusters of the RhB-NPs (light green or blue) and RhB-hPSCA-NPs (dark green or blue) was expressed as the mean percentage ± SD of RhB+GFP+ cells/total number of GFP+cells. ∗p < 0.01, Student’s t-test versus RhB-NPs at the same time point. (F–H) TEM images of tumor cell (DU145) clusters within the lung revealed that the NP penetration and internalization in metastatic PC cells is negligible for unconjugated NPs (F), which were frequently found among cancer cells (arrows), and very efficient for anti-PSCA Ab-conjugated NPs (G and H, endocytosed NPs are indicated by arrows). Ultrastructural images of lung clusters of PC3 cells, after NPs administration, were comparable with those of DU145 cell clusters. N, nuclei; PM, plasma membrane. (I) Viability of DU145 (green bars) and PC3 (blue bars) cells after 48 h incubation with different concentrations (0.2, 0.4, 1 mg/mL) of empty-hPSCA NPs versus PBS-treated cells. ANOVA, p > 0.05. Results obtained from untreated cells were comparable with those from PBS-treated cells. Experiments were performed in triplicate. (J) Viability of DU145 (green bars) and PC3 (blue bars) cells after 72 h incubation with 1 mg/mL of Cas9hIL30-PSCA NPs versus PBS-treated and IL30KO cells. ANOVA: p < 0.001. ∗p < 0.01, Tukey HSD test versus PBS-treated cells. #p < 0.01, Tukey HSD test versus 1 mg/mL-treated, and PBS-treated cells. Results from PBS-treated cells were comparable with those obtained from empty-hPSCA NP-treated and untreated cells. Experiments were performed in triplicate. (K) Human metastasis PCR array. Fold differences of the mRNAs of metastasis-related genes between IL30KO-DU145 and control NTgRNA-treated DU145 cells (light green bars) or PC3 cells (light blue bars), and between Cas9hIL30-PSCA NP-treated DU145 cells and control empty-hPSCA NP-treated DU145 cells (dark green bars) or PC3 cells (dark blue bars). A significant threshold of a 2-fold change in gene expression corresponded to p < 0.001. Only genes with a fold change >2 are shown. Experiments were performed in duplicate. The dashed lines represent the 2-fold change cutoff. (L) Schedules of five (top gray arrow) or three (bottom gray arrow) treatments with Cas9gRNA-hIL30-loaded immunoliposomes administered to NSG mice bearing single or small clusters of PC3 (fuchsia stained) or DU145 (orange stained) cells (which constitutively express membrane-anchored IL-30) in the lung circulation. The mice were treated with a biweekly dose of immunoliposomes (250 μL dose, with 50 μg/mL of Cas9 and 20 mg/mL of lipids concentration), starting from the third day after the intravenous administration of 3 × 105 cancer cells. Treatment administration was stopped 20 (5 treatments) or 13 (3 treatments) days later. (M) Mean number of lung metastasis developed in NSG mice, after i.v. injection of IL30KO or wild-type DU145 cells, and 5 treatments with PBS, empty-hPSCA NPs, or Cas9hIL30-PSCA NPs. ANOVA: p < 0.01. ∗p < 0.01, Tukey HSD test compared with DU145 tumor microemboli treated with PBS or empty-hPSCA NPs. (N) Mean number of lung metastases developed in NSG mice after i.v. injection of IL30KO or wild-type PC3 cells, and 5 treatments with PBS, or empty-hPSCA NPs, or Cas9hIL30-PSCA NPs. ANOVA: p < 0.0001. ∗p < 0.01, Tukey HSD test compared with PC3 tumor microemboli treated with PBS or empty-hPSCA NPs.
Figure 3
Figure 3
Immunopathology of lung metastases treated with immunoliposomes and assessment of the treatment in biomimetic PC-lung or PC-BM 2-OCs (A) Lung metastasis, developed after i.v. inoculation of DU145 cells, from empty-hPSCA NP-treated mice express IL-30 (a) show a robust proliferation (b), strong expression of CXCR4 (c), IGF1 (d), METAP-2 (e), and weak CDH1 expression (f). By contrast, the few metastases developed in Cas9hIL30-PSCA NP-treated animals lack IL-30 expression (g) and show a low cancer cell proliferation (h) and a weak expression of CXCR4 (i), IGF1 (j), and METAP-2 (k), while the expression of CDH1 was strengthened (l). Immunopathological features of lungs from mice injected with wild-type DU145 cells and treated with PBS were comparable with those of lungs from empty-hPSCA-treated mice. Results from mice bearing lung metastasis developed after i.v. inoculation of PC3 cells were comparable with those obtained from mice bearing lung metastasis developed after i.v. inoculation of DU145 cells. Magnification: ×400. Scale bars, 40 μm. (B) The prostate, liver, kidneys, spleen, and heart of NSG mice bearing DU145 tumor microemboli in their lungs, and then treated with Cas9hIL30-PSCA NPs (a–e), are free of signs of tissue or cell damage, and their histologic features are fully comparable with that of organs of NSG mice treated with empty-hPSCA NPs (f–j). Similar results were obtained from the histopathological analyses of the organs of PBS-treated mice. Histologic features of the organs of immunoliposome-treated and control NSG mice bearing PC3 lung tumor microemboli were comparable with those of treated and control mice bearing DU145 tumor microemboli. Magnification: ×400. Scale bars, 40 μm. (C) Microfluidic bioreactor, HUMIMIC Chip2 (a), which housed in one compartment the spheroid co-culture of PC and endothelial cells, (b) interconnected, via microfluidic channels, to a second compartment containing 3D spheroid co-culture of pneumocytes and endothelial cells, to mimic the lung, or a ceramic scaffold, comprising BM-derived MSCs and CD34+ MSCs, to mimic the BM niche. Micropumps, generating a pulsatile flow, adjusted by a control unit (c), ensured the dynamic circulation, between the two compartments of the culture medium. (D) Confocal microscopy of 3D PC-EC spheroids containing GFP-labeled DU145 cells treated with PBS or with RhB-labeled Cas9hIL30-PSCA NPs, showing the progressive uptake of red-labeled NPs by green-labeled PC cells. DAPI, DNA-stained nuclei. Magnification: ×200. Scale bars, 60 μm. (E–G) Ultrastructural images of 3D (DU145 cell containing) spheroids from the 2-OC platform untreated (E) or treated with Cas9hIL30-PSCA NPs (F and G), demonstrating that immunoliposomes (arrows) are efficiently taken up and internalized by DU145 (F) or PC3 (G) cells. N, nuclei; PM, plasma membrane.
Figure 4
Figure 4
Confocal microscopy and cytofluorimetric analyses of PC spheroids and PC cell migration into lung spheroids from the 2-OC, after immunoliposome treatments (A) Confocal microscopy images of 3D lung spheroids containing red-labeled (LuminiCell Tracker 670) pneumocytes and metastasizing green-labeled (LuminiCell Tracker 540) PC cells (DU145), taken from the PC lung on a chip platform, show a consistent reduction in the number of PC cells colonizing the lung spheroids after treatment with 5 doses of immunoliposomes (a) compared with controls (b). Magnification: ×200. Scale bars, 60 μm. (B) Histograms representing the quantization of DU145 (a and c) and PC3 (b and d) cells colonizing the lung spheroids in the 2-OC platform after 5 doses of immunoliposome treatment, as assessed by LSC microscopy images (a and b) and by flow cytometry analyses (c and d). The automated quantization of the number of DU145 (a) or PC3 (b) cells (visualized with the LSM 800 confocal microscope, Zeiss, Oberkochen, Germany; RRID: SCR_015963) that colonized the lung spheroids were performed using Zen software (Zeiss). Four to six high-power fields were analyzed for each well and two optical sections per well were evaluated. Results are expressed as mean ± SD of GFP-labeled cells per field. (a) DU145 cells, ANOVA: p < 0.0022. ∗p < 0.01, Tukey HSD test versus spheroids treated with PBS or empty-hPSCA NPs. (b) PC3 cells, ANOVA: p = 0.0051. ∗p < 0.05, Tukey HSD test versus spheroids treated with PBS or empty-hPSCA NPs. (c) Flow cytometry assessment of DU145 cells colonizing lung spheroids. ANOVA: p = 0.0022. ∗p < 0.01, Tukey HSD test versus treatment with PBS or empty-hPSCA NPs. (d) Flow cytometry assessment of PC3 cells colonizing lung spheroids. ANOVA: p = 0.0064. ∗p < 0.05, Tukey HSD test versus treatment with PBS or empty-hPSCA NPs. (C) Cytofluorimetric images of Ki67+ DU145 cells (a) and Ki67+ HUVECs (b) forming tumor spheroids in the PC lung on a chip after the treatment with five doses of immunoliposomes. Blue areas, isotype controls; red areas, specific Abs. The image is representative of a triplicate experiment. (D) Cytofluorimetric images of Ki67+ PC3 cells (a) and Ki67+ HUVECs (b) forming tumor spheroids in the PC lung on a chip after treatment with five doses of immunoliposomes. Blue areas, isotype controls; red areas, specific Abs. The image is representative of a triplicate experiment. (E) Flow cytometric analyses of Ki67+ DU145 cells (a) and Ki67+ HUVECs (b) isolated from PC spheroids of PC lung on a chip treated with five doses of immunoliposomes. MFI ratios were calculated by dividing the MFI of Ki67+ cell population by the MFI of the negative/isotype control. (a) DU145 cells, ANOVA: p = 0.0044. ∗p < 0.05, Tukey HSD test versus spheroids treated with PBS or empty-hPSCA NPs. (b) HUVECs, ANOVA: p = 0.0018. ∗p < 0.01, Tukey HSD test versus spheroids treated with PBS or empty-hPSCA NPs. (F) Flow cytometric analyses of Ki67+ PC3 cells (a) and Ki67+ HUVECs (b) isolated from PC spheroids of PC lung on a chip treated with five doses of immunoliposomes. MFI ratios were calculated by dividing the MFI of the Ki67+ cell population by the MFI of the negative/isotype control. (a) PC3 cells, ANOVA: p = 0.0005. ∗p < 0.01, Tukey HSD test versus spheroids treated with PBS or empty-hPSCA NPs. (b) HUVECs, ANOVA: p = 0.0046. ∗p < 0.05, Tukey HSD test versus spheroids treated with PBS or empty-hPSCA NPs. (G and H) Quantification of CXCL2/GRO-β in the supernatant collected from the PC spheroid lung on a chip containing DU145 (G) or PC3 (H) cells using LEGENDplex flow cytometry-based immunoassay. ANOVA: p < 0.0001. ∗p < 0.01, Tukey HSD test compared with PBS and empty-hPSCA-NP. #p < 0.01, Tukey HSD test compared with PBS and empty-hPSCA-NP. §p < 0.01, Tukey HSD test compared with T0. T0, the beginning of the experiment. T3, day 10 of the experiment, i.e., after the third treatment with NPs. T5, day 20 and final day of the experiment, i.e., after the fifth treatment with NPs. (I) ELISA assay of GRO-β release by DU145 and PC3 cells, alveolar cell type I cells, HUVECs, MSCs, and CD34+ cells, after treatment with PBS, empty-hPSCA, or Cas9hIL30-PSCA. ANOVA: p < 0.001. ∗p < 0.01, Tukey HSD test compared with PBS and empty-hPSCA. Experiments were performed in triplicate. (J) Immunohistochemical features of DU145 lung metastasis after the treatment with the five-dose schedule of immunoliposomes showing a distinct downmodulation of CXCL2 expression and reduction of Ly6G+ granulocyte and Gr-1+/CD11b+ myeloid cell infiltrates when compared with metastasis from control mice. Magnification: ×400. Scale bars, 40 μm.
Figure 5
Figure 5
Confocal microscopy and cytofluorimetric analyses of PC spheroids and PC cell colonization of the BM scaffolds in the 2-OC after immunoliposome treatment (A) Confocal microscopy image of the penetration of Cas9hIL30-PSCA RhB-labeled immunoliposomes (a) into GFP-labeled DU145 cells (b) forming the spheroid taken from the PC-BM 2-OC platform. Similar images were obtained from confocal analysis of spheroids containing PC3 cells and treated with immunoliposomes. (c) DAPI, DNA-stained nuclei. (d) Merge images showing, in yellow, the NP uptake by PC cells. Magnification: ×400. Scale bars, 40 μm. (B) Confocal microscopy image of the BM scaffold coated with red-stained MSCs, and colonized by green-stained DU145 cells, migrated from the spheroids contained in the 2-OC, and treated with Cas9hIL30-hPSCA NPs or Empty-PSCA NPs. Similar images were obtained from confocal analysis of spheroids containing PC3 cells and treated with immunoliposomes. DAPI, DNA-stained nuclei. Magnification: ×400. Scale bars, 40 μm. (C) Histograms representing the quantization of DU145 (a and c) and PC3 (b and d) cells, which colonized the BM scaffolds in the 2-OC platform after 5 treatments with immunoliposomes, as assessed by LSC microscopy images (a and b) and by flow cytometry analyses (c and d). The automated quantization of the number of DU145 (a) or PC3 (b) cells (visualized with the LSM 800 confocal microscope, Zeiss, Oberkochen, Germany; RRID: SCR_015963) that colonized BM scaffolds were performed using Zen software (Zeiss). Four to six high-power fields were analyzed for each well and two optical sections per well were evaluated. Results are expressed as mean ± SD of GFP-labeled cells per field. (a) DU145 cells, ANOVA: p < 0.001. ∗p < 0.01, Tukey HSD test versus spheroids treated with PBS or empty-hPSCA NPs. (b) PC3 cells, ANOVA: p < 0.001. ∗p < 0.01, Tukey HSD test versus spheroids treated with PBS or empty-hPSCA NPs. (c) Flow cytometry assessment of DU145 cells colonizing the BM scaffold. ANOVA: p < 0.001. ∗p < 0.01, Tukey HSD test versus treatment with PBS or empty-hPSCA NPs. (d) Flow cytometry assessment of PC3 cells colonizing the BM scaffold. ANOVA: p = 0.001. ∗p < 0.01, Tukey HSD test versus treatment with PBS or empty-hPSCA NPs. (D) Cytofluorimetric images of Ki67+ DU145 cells (a) and Ki67+ HUVECs (b) forming tumor spheroids in the PC-BM on a chip, after the treatment with five doses of immunoliposomes. Blue areas, isotype controls; red areas, specific Abs. The image is representative of a triplicate experiment. (E) Cytofluorimetric images of Ki67+ PC3 cells (a) and Ki67+ HUVECs (b) forming tumor spheroids in the PC-BM on a chip, after the treatment with five doses of immunoliposomes. Blue areas, isotype controls; red areas, specific Abs. The image is representative of a triplicate experiment. (F) Flow cytometric analyses of Ki67+ DU145 cells and Ki67+ HUVECs isolated from PC spheroids of PC-BM on a chip treated with the five doses of immunoliposomes. MFI ratios were calculated by dividing the MFI of Ki67+ cell population by the MFI of the negative/isotype control. DU145 cells, ANOVA: p = 0.0044. ∗p < 0.05, Tukey HSD test versus spheroids treated with PBS or empty-hPSCA NPs. HUVECs, ANOVA: p = 0.0018. ∗p < 0.01, Tukey HSD test versus spheroids treated with PBS or empty-hPSCA NPs. (G) Flow cytometric analyses of Ki67+ PC3 cells and Ki67+ HUVECs , isolated from PC spheroids of PC-BM on a chip, treated with five doses of immunoliposomes. MFI ratios were calculated by dividing the MFI of the Ki67+ cell population by the MFI of the negative/isotype control. PC3 cells, ANOVA: p = 0.0005. ∗p < 0.01, Tukey HSD test versus spheroids treated with PBS or empty-hPSCA NPs. HUVECs, ANOVA: p = 0.0046. ∗p < 0.05, Tukey HSD test versus spheroids treated with PBS or empty-hPSCA NPs. (H and I) Quantification of CXCL2/GROβ, in the supernatant collected from PC-BM 2-OC, containing DU145 (H) or PC3 (I) cells, using LEGENDplex flow cytometry-based immunoassay. (H) ANOVA: p < 0.001. ∗p < 0.01, Tukey HSD test compared with PBS and empty-hPSCA. #p < 0.01, Tukey HSD test compared with PBS and empty-hPSCA. §p < 0.01, Tukey HSD test compared with T0. (I) ANOVA: p < 0.001. ∗p < 0.01, Tukey HSD test compared with PBS and empty-hPSCA. #p < 0.01, Tukey HSD test compared with PBS and empty-hPSCA. §p < 0.01, Tukey HSD test compared with T0. (J and K) Quantification of DKK1 in the supernatant collected from PC-BM 2-OC, containing DU145 (J) or PC3 (K) cells, using LEGENDplex flow cytometry-based immunoassay. (J) ANOVA: p < 0.01. ∗p < 0.01, Tukey HSD test compared with PBS and empty-hPSCA-NPs. §p < 0.01, Tukey HSD test compared with T0. (K) ANOVA: p < 0.0001. ∗p < 0.01, Tukey HSD test compared with PBS and empty-hPSCA-NPs. #p < 0.01, Tukey HSD test compared with PBS and empty-hPSCA-NPs. §p < 0.01, Tukey HSD test compared with T0. (L and M) Quantification of OPG, in the supernatant collected from PC-BM 2-OC, containing DU145 (L) or PC3 (M) cells using LEGENDplex flow cytometry-based immunoassay. (L) ANOVA: p < 0.0001. ∗p < 0.01, Tukey HSD test compared with PBS and empty-hPSCA-NPs. #p < 0.01, Tukey HSD test compared with PBS and empty-hPSCA-NPs. §p < 0.01, Tukey HSD test compared with T0. (M) ANOVA: p < 0.0001. ∗p < 0.01, Tukey HSD test compared with PBS and empty-hPSCA-NPs. #p < 0.01, Tukey HSD test compared with PBS and empty-hPSCA-NPs. §p < 0.01, Tukey HSD test compared with T0. (N and O) Quantification of IL-6, in the supernatant collected from PC-BM 2-OC, containing DU145 (N) or PC3 (O) cells, using LEGENDplex flow cytometry-based immunoassay. (N) ANOVA: p < 0.0001. ∗p < 0.01, Tukey HSD test compared with PBS and empty-hPSCA-NPs. #p < 0.01, Tukey HSD test compared with PBS and empty-hPSCA-NPs. §p < 0.01, Tukey HSD test compared with T0. (O) ANOVA: p < 0.01. ∗p < 0.01, Tukey HSD test compared with PBS and empty-hPSCA-NPs. §p < 0.01, Tukey HSD test compared with T0. (P) ELISA assay of DKK1 release by DU145 and PC3 cells, HUVECs, MSCs, and CD34+ cells, after treatment with PBS, empty-hPSCA or Cas9hIL30-PSCA. ANOVA: p < 0.001. ∗p < 0.01, Tukey HSD test compared with PBS and empty-hPSCA. Experiments were performed in triplicate. (Q) ELISA assay of OPG release by DU145 and PC3 cells, HUVECs, MSCs, and CD34+ cells after treatment with PBS, empty-hPSCA, or Cas9hIL30-PSCA. ANOVA: p < 0.001. ∗p < 0.01, Tukey HSD test compared with PBS and empty-hPSCA. The columns corresponding to OPG production by MSCs were truncated at 25 pg/mL to improve readability. Experiments were performed in triplicate. (R) ELISA assay of IL-6 release by DU145 and PC3 cells, HUVECs, MSCs, and CD34+ cells after treatment with PBS, empty-hPSCA, or Cas9hIL30-PSCA. ANOVA: p < 0.001. ∗p < 0.01, Tukey HSD test compared with PBS and empty-hPSCA. Experiments were performed in triplicate.
Figure 6
Figure 6
Effects of the second-level mediators suppressed in PC cells by IL-30 targeting with immunoliposomes on the viability and phenotype of PC and endothelial cells (A–C) MTT assay of DU145, or PC3, and ECs (HUVECs) treated with (50 ng/mL – 48 h) rhDKK1 (A), rhOPG (B), rhIL6 (C). ∗p < 0.05, Student’s t test versus untreated control (CTRL) cells. (D–F) Migration and invasion assays of DU145 and PC3 cells in response to stimulation with (50 ng/mL – 48 h) of rDKK1 (D), rOPG (E), or rIL6 (F). ∗p < 0.05, Student’s t-test versus untreated control (CTRL) cells. (G–I) Fold differences of the mRNAs of epithelial-to-mesenchymal transition-related genes between DU145 (blue bars), or PC3 (green bars), cells untreated or treated with (50 ng/mL) rhDKK1(G), rhOPG (H), or rhIL6 (I). A significant threshold of a 2-fold change in gene expression corresponded to p < 0.001. Only genes with a fold change >2 are shown. Experiments were performed in duplicate. (J–L) Fold differences of the mRNAs of regulatory genes of EC activation, proliferation, and sprouting between ECs untreated or treated with (50 ng/mL) rDKK1 (J), rOPG (K), or rIL6 (L). A significant threshold of a 2-fold change in gene expression corresponded to p < 0.001. Only genes with a fold change >2 are shown. Experiments were performed in duplicate. (M) Mean number of endothelial tubes formed by HUVECs cultured on Matrigel-coated slides and stimulated with rhDKK1, rhIL6, rhOPG, or left untreated (PBS). Results are expressed as mean ± SD of tubes/field (4×). ANOVA: p < 0.0001. ∗p < 0.01, Tukey HSD test compared with untreated cells (PBS). Experiments were performed in triplicate. (N) Mean number of capillary meshes formed by HUVECs, cultured on Matrigel-coated slides, and stimulated with rhDKK1, rhIL6, rhOPG, or left untreated (PBS). Results are expressed as mean ± SD of meshes/field (4×). ANOVA: p < 0.0001. ∗p < 0.01, Tukey HSD test compared with untreated cells (PBS). Experiments were performed in triplicate. (O) Mean number of vascular nodes formed by HUVECs, cultured on Matrigel-coated slides, and stimulated with rhDKK1, rhIL6, rhOPG, or left untreated (PBS). Results are expressed as mean ± SD of nodes/field (4×). ANOVA: p < 0.0001. ∗p < 0.01, Tukey HSD test compared with untreated cells (PBS). Experiments were performed in triplicate. (P) Mean number of tube junctions formed by HUVECs cultured on Matrigel-coated slides and stimulated with rhDKK1, rhIL6, rhOPG, or left untreated (PBS). Results are expressed as mean ± SD of junctions/field (4×). ANOVA: p < 0.0001. ∗p < 0.01, Tukey HSD test compared with untreated cells (PBS). Experiments were performed in triplicate. (Q) Analyses of the tube-forming capabilities of HUVECs untreated (a–c) and treated with rDKK1 (d–f), rOPG (g–i), and rIL6 (j–l) was performed using the Angiogenesis analyzer plug-in of the ImageJ software, as described in the materials and methods. Magnification: ×4. Scale bars, 100 μm. (R) Flow cytometry assessment of DU145 cells colonizing the bone marrow scaffold after treatment of spheroids contained in the PC-BM 2-OC platform with anti-DKK1-neutralizing Abs. ANOVA: p = 0.001. ∗p < 0.01, Tukey HSD test versus spheroids treated with PBS or empty-hPSCA NPs. ∗∗p < 0.01, Tukey HSD test versus spheroids treated with PBS, empty-hPSCA NPs, or Cas9hIL30-PSCA-NPs. (S) Flow cytometry assessment of DU145 cells colonizing the bone marrow scaffold after treatment of spheroids contained in the PC-BM 2-OC platform with anti-OPG-neutralizing Abs, ANOVA: p = 0.001. ∗p < 0.01, Tukey HSD test versus spheroids treated with PBS or empty-hPSCA NPs. ∗∗p < 0.01, Tukey HSD test versus spheroids treated with PBS, empty-hPSCA NPs, or Cas9hIL30-PSCA-NPs. (T) Flow cytometry assessment of DU145 cells colonizing the bone marrow scaffold after treatment of spheroids contained in the PC-BM 2-OC platform with anti-IL-6-neutralizing Abs. ANOVA: p = 0.001. ∗p < 0.01, Tukey HSD test versus spheroids treated with PBS or empty-hPSCA NPs. ∗∗p < 0.01, Tukey HSD test versus spheroids treated with PBS, empty-hPSCA NPs, or Cas9hIL30-PSCA-NPs.

References

    1. Sung H., Ferlay J., Siegel R.L., Laversanne M., Soerjomataram I., Jemal A., Bray F. Global Cancer Statistics 2020: GLOBOCAN Estimates of Incidence and Mortality Worldwide for 36 Cancers in 185 Countries. CA. Cancer J. Clin. 2021;71:209–249. - PubMed
    1. Belkahla S., Nahvi I., Biswas S., Nahvi I., Ben Amor N. Advances and development of prostate cancer, treatment, and strategies: A systemic review. Front. Cell Dev. Biol. 2022;10 - PMC - PubMed
    1. Al-Mansour Z., Pang L., Bathini V. Novel Cancer Therapeutics in Geriatrics: What is Unique to the Aging Patient? Drugs Aging. 2019;36:1–11. - PubMed
    1. Gerstberger S., Jiang Q., Ganesh K. Metastasis. Cell. 2023;186:1564–1579. - PMC - PubMed
    1. Hapach L.A., Mosier J.A., Wang W., Reinhart-King C.A. Engineered models to parse apart the metastatic cascade. NPJ Precis. Oncol. 2019;3:20. - PMC - PubMed

MeSH terms

LinkOut - more resources