. 2024 Oct:76:103330.
doi: 10.1016/j.redox.2024.103330. Epub 2024 Aug 28.

Intermittent ozone inhalation during house dust mite-induced sensitization primes for adverse asthma phenotype

Affiliations

Intermittent ozone inhalation during house dust mite-induced sensitization primes for adverse asthma phenotype

Salik Hussain et al. Redox Biol. 2024 Oct.

Abstract

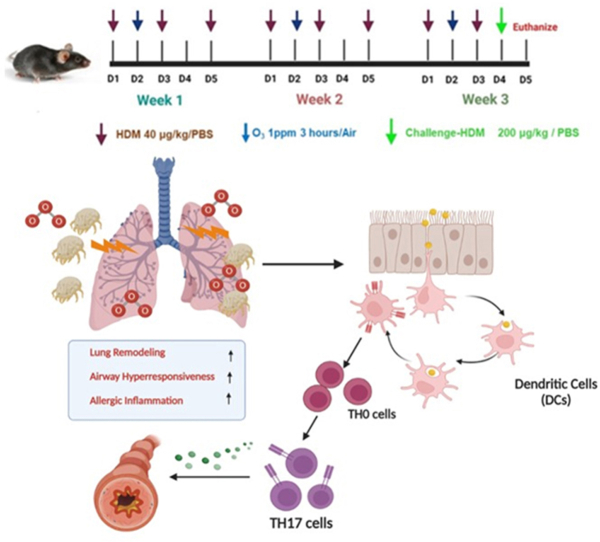
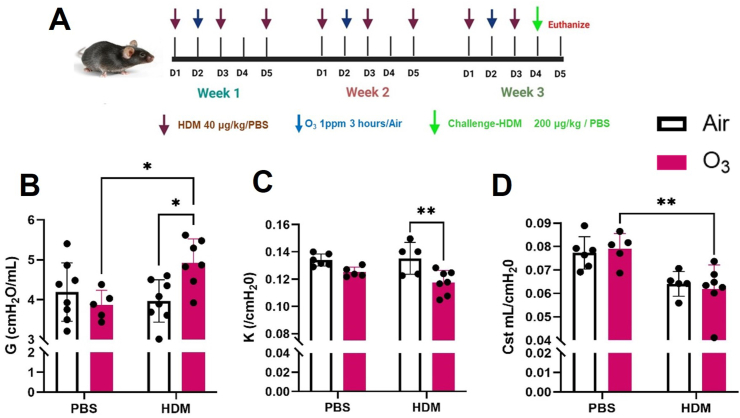
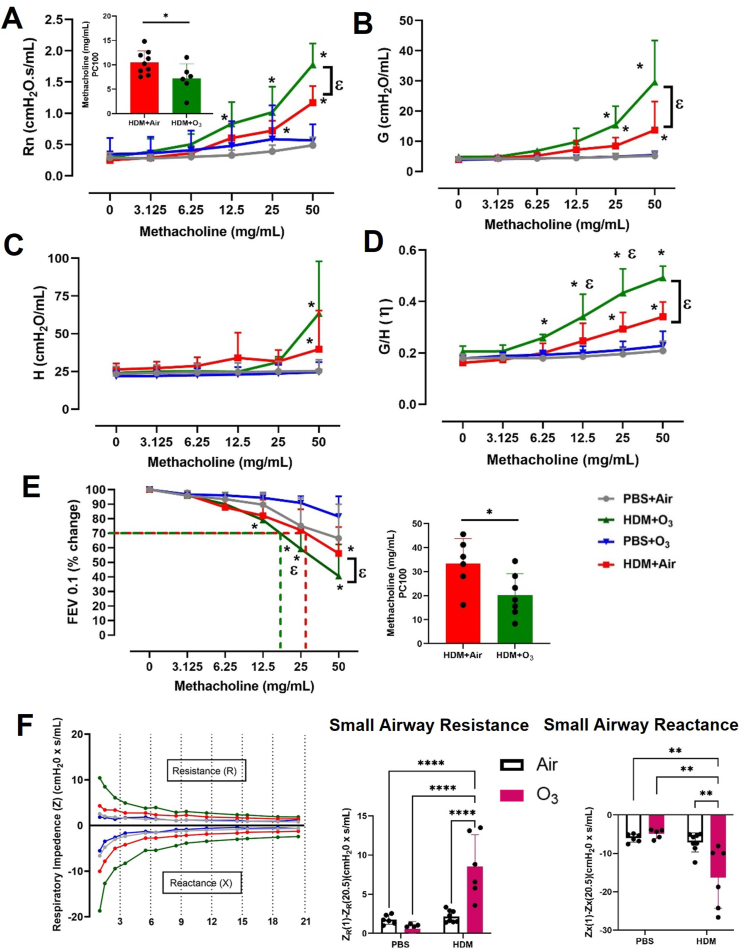
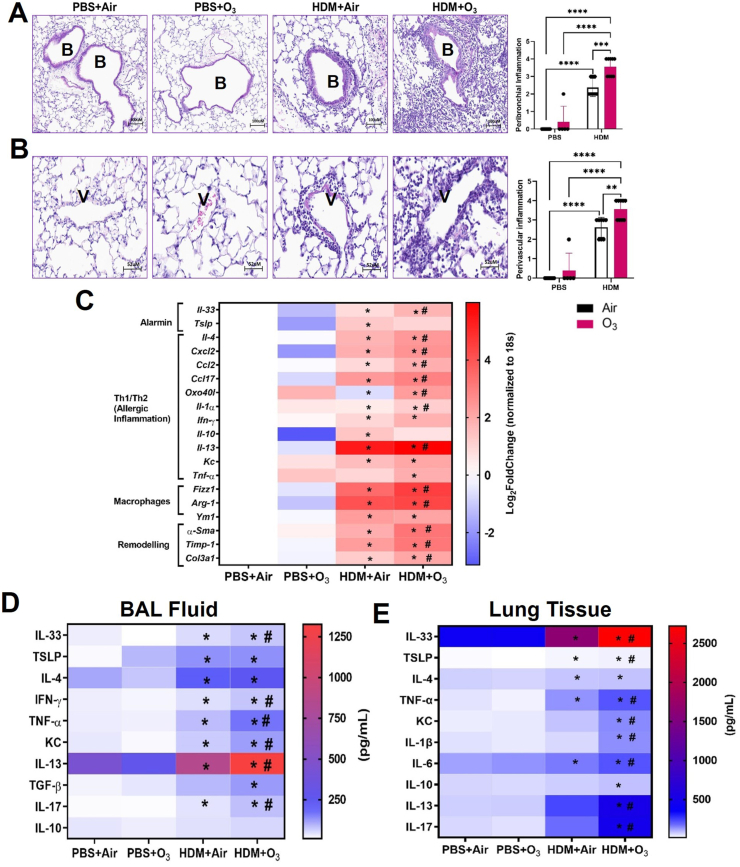
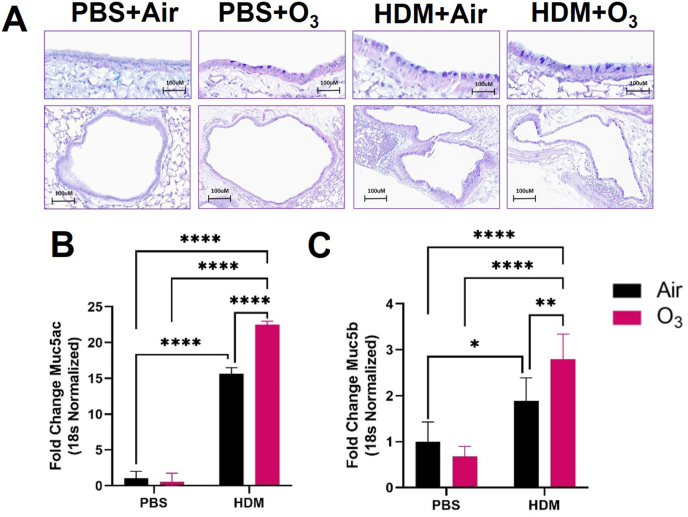
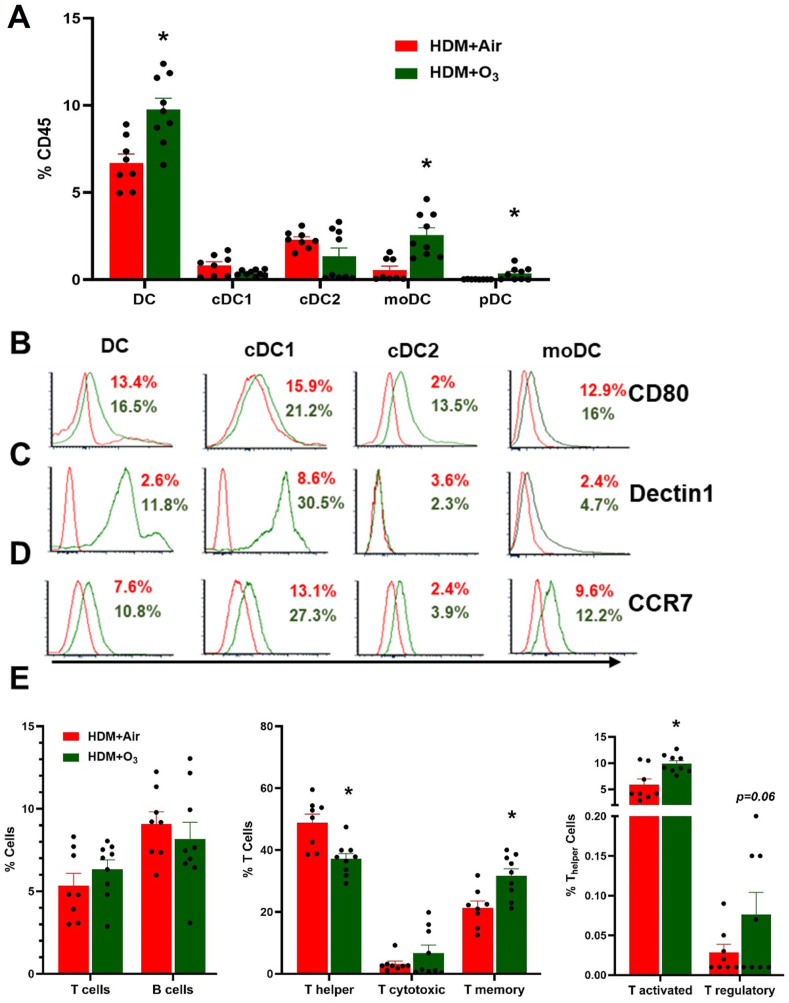
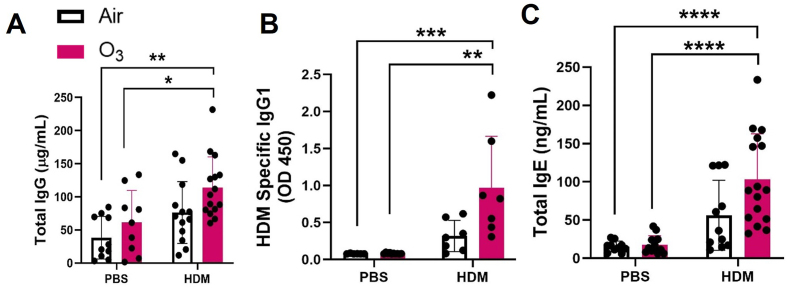
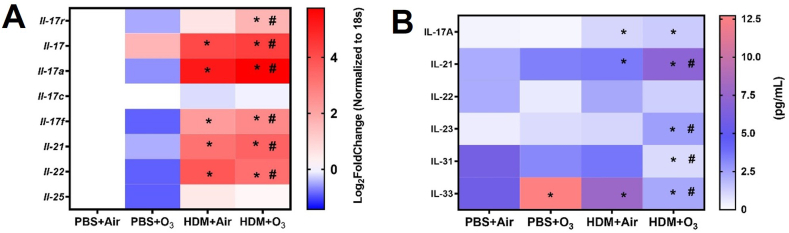
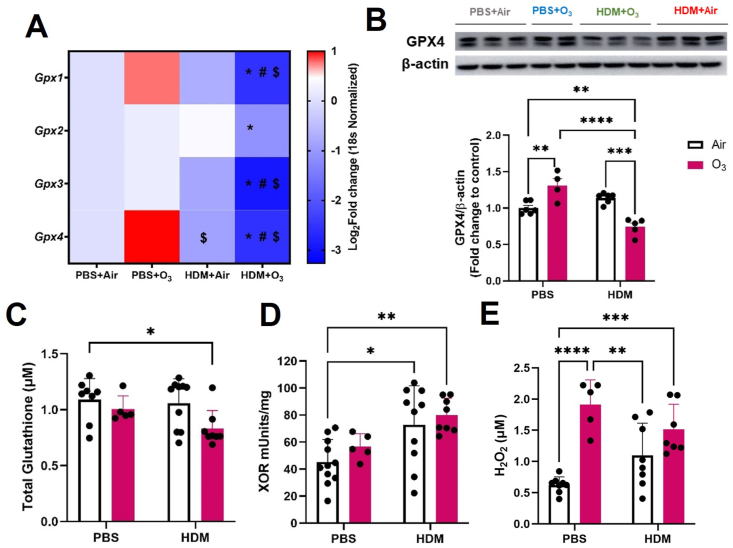
The ability of air pollution to induce acute exacerbation of asthma is well documented. However, the ability of ozone (O3), the most reactive gaseous component of air pollution, to function as a modulator during sensitization is not well established. C57BL/6 J male mice were intranasally sensitized to house dust mite (HDM) (40 μg/kg) for 3 weeks on alternate days in parallel with once-a-week O3 exposure (1 ppm). Mice were euthanized 24 h following the last HDM challenge. Lung lavage, histology, lung function (both forced oscillation and forced expiration-based), immune cell profiling, inflammation (pulmonary and systemic), and immunoglobulin production were assessed. Compared to HDM alone, HDM + O3 leads to a significant increase in peribronchial inflammation (p < 0.01), perivascular inflammation (p < 0.001) and methacholine-provoked large airway hyperreactivity (p < 0.05). Serum total IgG and IgE and HDM-specific IgG1 were 3-5 times greater in HDM + O3 co-exposure compared to PBS and O3-exposed groups. An increase in activated/mature lung total and monocyte-derived dendritic cells (p < 0.05) as well as T-activated, and T memory lymphocyte subset numbers (p < 0.05) were noted in the HDM + O3 group compared to HDM alone group. Concurrent O3 inhalation and HDM sensitization also caused significantly greater (p < 0.05) lung tissue interleukin-17 pathway gene expression and mediator levels in the serum. Redox imbalance was manifested by impaired lung antioxidant defense and increased oxidants. O3 inhalation during allergic sensitization coalesces in generating a significantly worse TH17 asthmatic phenotype.

Keywords: Airway hyperresponsiveness; Inflammation; Lung; Lung function; Ozone; T(H)17.


Conflict of interest statement

Declaration of competing interest The authors declare that they have no known competing financial interests or personal relationships that could have appeared to influence the work reported in this paper.

Figures

Image 1
Graphical abstract
Fig. 1
Fig. 1
House dust mite and ozone co-exposure induce lung function changes at baseline. A) Experimental design. Baseline measurements of B) tissue damping (G), C) form of the deflating loop of the PV-Loop (K), and D) static compliance (Cst). Data are presented as mean ± SD of n = 5–8 mice per group and analyzed by Kruskal–Wallis test followed by Dunn's multiple comparison post hoc test. *P ≤ 0.05, **P ≤ 0.01.
Fig. 2
Fig. 2
House dust mite and ozone co-exposure induce airway hyperresponsiveness. A) Methacholine dose response of Newtonian resistance (Rn) and provocative concentration 100 (PC100) calculation for HDM and HDM + O3 groups (inset) B) Methacholine dose response of tissue damping (G) C) Methacholine dose response of tissue elastance (E). D). tissue Hysteresivity (η) calculated as G/H E) % change in Forced Expiratory Flow at 0.1s (FEV0.1) after exposure to increasing methacholine doses and inset is provocative concentration 30 (PC30) calculation for FEV0.1. F) Impedance plots at 50 μg/mL methacholine with specific small airway resistance and reactance plotted as bar graphs. Respiratory impedance was measured using the forced oscillation technique with pseudo-random oscillations over a range of 1–20.5 Hz depicting the real (i.e., resistance) and imaginary (i.e., reactance) part of the impedance. Mice were exposed to PBS + Air, PBS + ozone (1 ppm; 3 h), HDM + air, HDM + ozone (1 ppm; 3 h). Data are presented as mean ± SD of n = 5–9 mice per group and analyzed by two-way analysis of variance (ANOVA) followed by Tukey's post hoc test or students t-test. *P ≤ 0.05 vs PBS + Air, ε P ≤ 0.05 between HDM + Air and HDM + O3 that methacholine concentration. For Impedance measurements *P ≤ 0.05, **P ≤ 0.01, ***P ≤ 0.001, ****P ≤ 0.0001.
Fig. 3
Fig. 3
House dust mite and ozone co-exposure induce lung inflammation A) Peribronchial Inflammation B) Perivascular Inflammation. n = 5–9 mice per group and analyzed by Kruskal–Wallis test followed by Dunn's multiple comparison post hoc test. *P ≤ 0.05, **P ≤ 0.01, ***P ≤ 0.001, ****P ≤ 0.0001C). Lung tissue real-time PCR analyses for mRNA expression D) BAL fluid ELISA E) Lung homogenate ELISA. n = 4–7 mice per group and analyzed by two-way analysis of variance (ANOVA) followed by Tukey's post hoc test. PCR values are presented as Log 2-fold change values. * Represents significantly different from PBS + Air while # represents significantly different between HDM + Air and HDM + O3.
Fig. 4
Fig. 4
House dust mite and ozone co-exposure induce mucous cell metaplasia and mucin gene expression. A) histopathological evaluation of mucous cell metaplasia by AB/PAS staining B) Real-time PCR analyses for Muc5ac and C) Muc5b gene expression in lung tissue. Data are presented as the mean ± deviation (SD) and analyzed by two-way analysis of variance (ANOVA) followed by Turkey's post hoc test. n = 4–6 animals per group. *P ≤ 0.05, **P ≤ 0.01, ****P ≤ 0.0001.
Fig. 5
Fig. 5
Flow cytometry analyses of lung immune cells. A) Lung dendritic cells (total DC, moDC, cDC1, cDC2 and pDC) are presented as % of CD45 (+) cells in HDM and HDM + O3 groups. Activation of DC populations. B) CD80 C) Dectin 1 and D) CCR7 expression on lung dendritic cells. after HDM or HDM + O3 exposure. E) Alterations in lung lymphocyte subpopulations. n = 8–9 mice per group. Data are presented as mean ± SEM, Mann-Whitney test was performed. * denotes the significance between HDM and HDM + O3 at P ≤ 0.05.
Fig. 6
Fig. 6
HDM and O3co-exposure induces the production of serum IgG and IgE. A) Total IgG in mouse serum (1:50,000 dilution) B) HDM specific serum IgG1 (1:2000) C) Total IgE in mouse serum (1:50). Data are presented as mean ± SEM. n = 9–10 mice per group. Kruskal–Wallis test followed by Dunn's multiple comparison post hoc test. * represents significantly different (P ≤ 0.05) from PBS + Air, # presents significantly different (P ≤ 0.05) between HDM + Air and HDM + O3.
Fig. 7
Fig. 7
T-helper 17 induced signaling pathway A) Lung tissue real-time PCR mRNA expression. B) Serum ELISA for TH-17 pathway mediators. PCR values are presented as Log 2-fold change values. Data are presented as mean ± SD of n = 4–6 mice per group and analyzed by Two-way analysis of variance (ANOVA) followed by Tukey's post hoc test. * represents significantly different (P ≤ 0.05) from PBS + Air while # presents significantly (P ≤ 0.05) different between HDM + Air and HDM + O3.
Fig. 8
Fig. 8
Ozone and house dust mite-induced redox imbalance A) Lung tissue real-time PCR analyses (mRNA expression), B) Western Blot analysis of GPX4 expression in lung homogenate. C) Glutathione concentration in lung tissue homogenate. D) Xanthine oxidoreductase activity in lung tissue homogenate. E) H2O2 levels in BAL fluid. PCR values are presented as Log 2-fold change values. Data are presented as mean ± SD n = 4–10 mice per group and analyzed by Two-way analysis of variance (ANOVA) followed by Tukey's post hoc test. *P ≤ 0.05, **P ≤ 0.01, P ≤ 0.001, ****P ≤ 0.0001.

References

    1. Buteau S., Doucet M., Tetreault L.F., Gamache P., Fournier M., Brand A., Kosatsky T., Smargiassi A. A population-based birth cohort study of the association between childhood-onset asthma and exposure to industrial air pollutant emissions. Environ. Int. 2018;121(Pt 1):23–30. doi: 10.1016/j.envint.2018.08.040. - DOI - PubMed
    1. Tuazon J.A., Kilburg-Basnyat B., Oldfield L.M., Wiscovitch-Russo R., Dunigan-Russell K., Fedulov A.V., Oestreich K.J., Gowdy K.M. Emerging insights into the impact of air pollution on immune-mediated asthma pathogenesis. Curr. Allergy Asthma Rep. 2022;22(7):77–92. doi: 10.1007/s11882-022-01034-1. - DOI - PMC - PubMed
    1. McConnell R., Berhane K., Yao L., Jerrett M., Lurmann F., Gilliland F., Kunzli N., Gauderman J., Avol E., Thomas D., Peters J. Traffic, susceptibility, and childhood asthma. Environ. Health Perspect. 2006;114(5):766–772. doi: 10.1289/ehp.8594. - DOI - PMC - PubMed
    1. Liu Y., Pan J., Zhang H., Shi C., Li G., Peng Z., Ma J., Zhou Y., Zhang L. Short-term exposure to ambient air pollution and asthma mortality. Am. J. Respir. Crit. Care Med. 2019;200(1):24–32. doi: 10.1164/rccm.201810-1823OC. - DOI - PubMed
    1. Rosenquist N.A., Metcalf W.J., Ryu S.Y., Rutledge A., Coppes M.J., Grzymski J.J., Strickland M.J., Darrow L.A. Acute associations between PM2.5 and ozone concentrations and asthma exacerbations among patients with and without allergic comorbidities. J. Expo. Sci. Environ. Epidemiol. 2020;30(5):795–804. doi: 10.1038/s41370-020-0213-7. - DOI - PubMed

Publication types