. 2025 Feb;18(1):39-52.
doi: 10.1016/j.mucimm.2024.09.001. Epub 2024 Sep 7.

MicroRNA-142 regulates gut associated lymphoid tissues and group 3 innate lymphoid cells

Affiliations

MicroRNA-142 regulates gut associated lymphoid tissues and group 3 innate lymphoid cells

Luke B Roberts et al. Mucosal Immunol. 2025 Feb.

Abstract

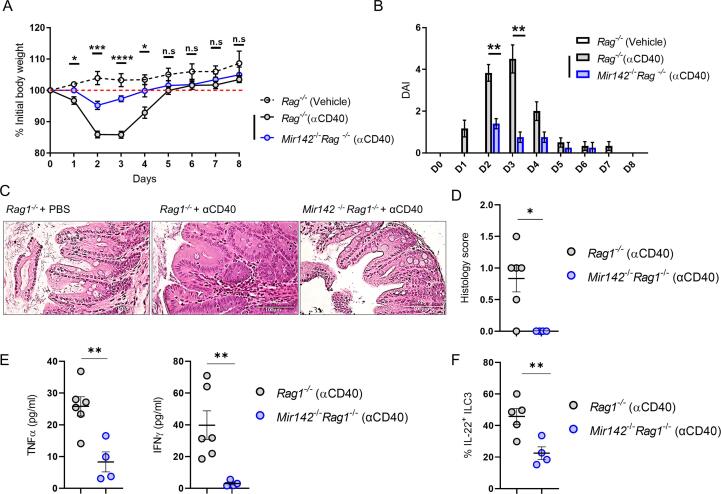
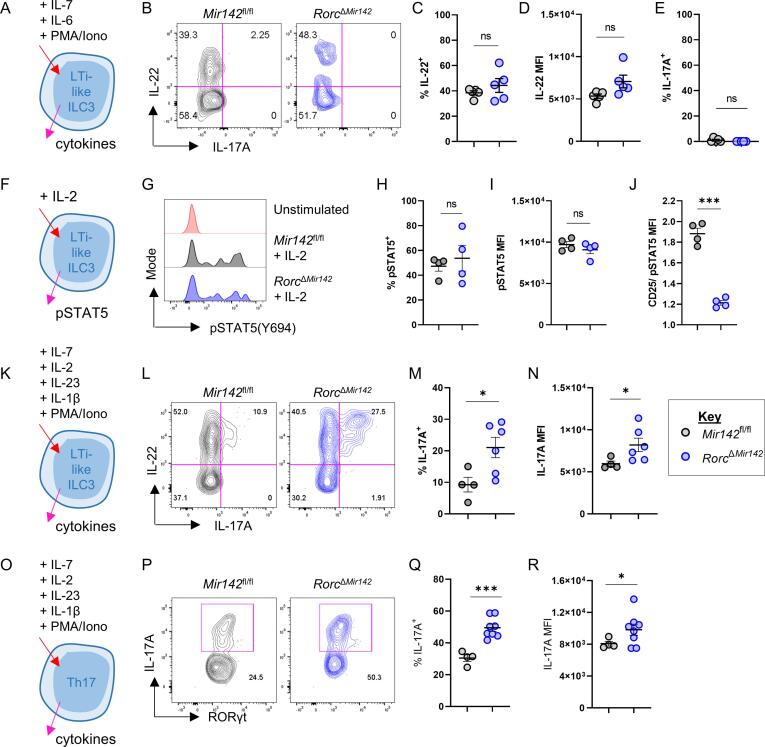
The transcriptomic signatures that shape responses of innate lymphoid cells (ILCs) have been well characterised, however post-transcriptional mechanisms which regulate their development and activity remain poorly understood. We demonstrate that ILC groups of the intestinal lamina propria express mature forms of microRNA-142 (miR-142), an evolutionarily conserved microRNA family with several non-redundant regulatory roles within the immune system. Germline Mir142 deletion alters intestinal ILC compositions, resulting in the absence of T-bet+ populations and significant defects in the cellularity and phenotypes of ILC3 subsets including CCR6+ LTi-like ILC3s. These effects were associated with decreased pathology in an innate-immune cell driven model of colitis. Furthermore, Mir142-/- mice demonstrate defective development of gut-associated lymphoid tissues, including a complete absence of mature Peyer's patches. Conditional deletion of Mir142 in ILC3s (RorcΔMir142) supported cell-intrinsic roles for these microRNAs in establishing or maintaining cellularity and functions of LTi-like ILC3s in intestinal associated tissues. RNAseq analysis revealed several target genes and biological pathways potentially regulated by miR-142 microRNAs in these cells. Finally, lack of Mir142 in ILC3 led to elevated IL-17A production. These data broaden our understanding of immune system roles of miR-142 microRNAs, identifying these molecules as critical post-transcriptional regulators of ILC3s and intestinal mucosal immunity.

Keywords: ILC3; Innate lymphoid cells; Intestine; Peyer’s Patches; miR-142.


Conflict of interest statement

Declaration of Competing Interest The authors declare that they have no known competing financial interests or personal relationships that could have appeared to influence the work reported in this paper.

Figures

None
Graphical abstract
Fig. 1
Fig. 1
Intestinal ILC populations are differentially dependent on miR-142 expression. A. Relative expressions (to U6 snRNA) of miR-142-3p and miR-142-5p for ILC1s, ILC2s, NCR ILC3s and NCR+ ILC3s isolated from the small intestine of RorceGFP mice. B. Representative flow cytometry plots of small intestinal ILC1s in Mir142/ mice and C57BL/6J wild type (B6) controls. Numbers on plots = frequency of parent population (CD45+LinEomesCD127+Klrg1RORγt ILCs). C. Representative flow cytometry plots of small intestinal NCR and NCR+ ILC3s in Mir142/ mice and C57BL/6J wild type (B6) controls. Numbers on plots = frequency of parent population (CD45+LinEomesCD127+ RORγt+ ILCs). D. Proportional composition of indicated ILC subsets among CD45+LineageCD127+ total ILCs of the small intestinal lamina propria (siLP) of Mir142/ mice and B6 controls. Unassigned = remaining CD127+ ILCs not gated into defined subsets. E. Number of cells of each indicated subset in the siLP of Mir142/ mice and B6 controls. F. As for (D) but for Mir142/Rag1/ mice and Rag1/ controls. G. As for (E) but for Mir142/Rag1/ mice and Rag1/ controls. H. As for (D) but for CD4ΔMir142 mice and B6 controls. I. As for (E) but for CD4ΔMir142 mice and B6 controls. J. as for (D) but for ERT2CreΔMir142 mice and Mir142fl/fl littermate controls 4 weeks post treatment with tamoxifen. K. As for (E) but for ERT2CreΔMir142 mice and Mir142fl/fl littermate controls 4 weeks post treatment with tamoxifen. Charts in D, F, H, J represent average % values of parental CD45+LineageCD127+ ILCs of n = 3–5 mice per experimental group. Data points represent individual biological replicates. Welch’s t-test, *p < 0.05, **p < 0.01, ***p < 0.001, ns = non-significant difference.
Fig. 2
Fig. 2
Absence of Mir142 protects against anti-CD40 mediated innate immune-driven colitis. A. Percentage of initial body weight (Day 0 = 100 %) of Mir142/Rag1/ mice and Rag1/ controls calculated each day after treatment with anti-CD40, or vehicle control (PBS). B. As for (A) but for Daily Disease Activity Index (DAI) scores. C. Representative micrographs of H&E stained distal colon at D8 of treatment of Mir142/Rag1/ mice and Rag1/ treated with anti-CD40, or vehicle control (PBS). D. Blinded histology scoring of micrographs as in (C). E. Concentrations of TNFα and IFNγ from media of colonic explant culture of Mir142/Rag1/mice and Rag1/ treated with anti-CD40 at D8 post-treatment, as determined by ELISA. F. Proportion of ILC3s producing IL-22 following ex vivo PMA/ionomycin re-stimulation, from Mir142/Rag1/ mice and Rag1/ treated with anti-CD40 at D8 post-treatment. Welch’s t-test, *p < 0.05, **p < 0.01, ***p < 0.001, ****p < 0.0001, ns = non-significant difference. n = 4–6 mice per experimental group. Data points represent individual biological replicates.
Fig. 3
Fig. 3
LTi-like ILC3s and gastrointestinal-associated lymphoid tissues are defective in the Mir142/mice. A. Quantification of LTi-like ILC3 in mLNs and small intestinal lamina propria (siLP) of C57BL/6J (B6) control and Mir142/ mice. B. Representative histograms of LTi-like ILC3s in mLN and siLP of the indicated mouse strains, showing staining for LTα1β2. Values on plots indicate proportion of the parent population positive for LTα1β2. C. Quantification of proportion of LTi-like cells of the mLNs and siLP expressing LTα1β2, for the indicated strains. D. Representative photographs of small intestines of Mir142/ and B6 control mice, arrows indicate visible Peyer’s patches. Scale bars represent 1 cm. E. Quantification of number of Peyer’s patches of Mir142/ and B6 control mice. F. αB220 whole mount immunostaining of small intestines of Mir142/ and B6 control mice. Solid arrows indicate mature Peyer’s patch structures, empty arrows indicate immature structures. G. Merged immunofluorescence images for DAPI (Blue), αB220 (green) and αCD3 (magenta) of B6 and Mir142/ small intestine cryosections. Dashed lines indicate isolated lymphoid follicle structures. Scale bars, 100 µm. H. Total and CD45+ cellularity of mLNs of Mir142/ and B6 control mice. I. Small intestinal luminal IgA concentration of Mir142/ and B6 control mice. J. Representative histogram overlays for expression of Nrp1, c-Kit, and RORγt by small intestinal LTi-like ILC3s of B6 and Mir142/ mice. K. Mean fluorescence intensity (MFI) values for the indicated markers by small intestinal LTi-like ILC3s of B6 and Mir142/ mice, normalised to the average of B6 values (set to 1). L. Representative flow cytometry plots of LTi-like ILC3s (from mLN) indicating CD4+/CD4 subsets. Values on plots = frequencies of parent LTi-like population (CD45+LineageCD127+Rorgt+ CCR6+c-KIT+Nrp-1+). M. Quantification of proportions of LTi-like ILC3s of the mLNs expressing CD4, from Mir142/ and B6 controls. N. Representative flow cytometry plots of MHC-II expression by siLP ILC3s of B6 and Mir142/ mice. Values on plots indicate frequency of parent population (total LTi-like ILC3s). O. Quantification of frequencies for MHC-II expression in the indicated gated populations, for samples as described in (N). O. Data points represent individual biological replicates. Welch’s t-test, *p < 0.05, **p < 0.01, ***p < 0.001, ****p < 0.0001, ns = non-significant difference. (For interpretation of the references to colour in this figure legend, the reader is referred to the web version of this article.)
Fig. 4
Fig. 4
ILC3-conditional deletion of Mir142 identifies miR-142 as a regulator of LTi cellularity. A. Number of Peyer’s patches (PPs) from the small intestines of RorcΔMir142 and Mir142fl/fl co-housed littermate controls. B. Representative photographs of small intestines of Mir142fl/fl and RorcΔMir142 littermate mice, arrows indicate visible PPs. Scale bars represent 1 cm. C. Representative immunofluorescence images of cryptopatches within small intestinal lamina propria of RorcΔMir142 and Mir142fl/fl co-housed littermate controls. Scale bar = 50 µm. D. Representative flow cytometry plots for proportion of total gated ILCs (CD45+LineageCD127+ cells) expressing RORγt (ILC3s) in PP of RorcΔMir142 and Mir142fl/fl mice. Numbers on plots indicate proportion of parent for the gated population. E. Quantification of ILC1s/ILC2s/ILC3s in the mesenteric lymph nodes (mLNs) of RorcΔMir142 and Mir142fl/fl mice. F. Quantification of ILC1s/ILC2s/ILC3s in PPs of RorcΔMir142 and Mir142fl/fl mice. Cell number is normalised to number of PP isolated per mouse, expressed as #cells/PP. G. Quantification of RORγt+ ILC3 subsets (DN=double negative (CCR6NKp46), NCR+ = NKp46+, LTi-like = CCR6+) per mLN of RorcΔMir142 and Mir142fl/fl mice. H. as for (G) but per PP of RorcΔMir142 and Mir142fl/fl mice. I. Mean fluorescence intensity (MFI) values for the indicated markers by LTi-like ILC3s in PPs of RorcΔMir142 and Mir142fl/fl mice, normalised to the average of B6 values (set to 1). J. Quantification of proportion of LTi-like cells of the mLNs and PPs expressing LTα1β2, for the indicated strains. K. Representative flow cytometry plots of LTi-like ILC3s (from PPs), indicating CD4+/CD4 subsets. Values on plots = frequencies of parent LTi-like population (CD45+ Lineage CD127+ Rorgt+ CCR6+ c-Kit+ Nrp-1+). L. Quantification of proportions of LTi-like ILC3s of the mLNs and PPs expressing CD4, from RorcΔMir142 and Mir142fl/fl mice. M. As for (L) but for MFI of CD4 expression by CD4+ LTi-like ILC3s. N. Proportion of total B cells displaying a GC phenotype in PP of RorcΔMir142 and Mir142fl/fl mice. O. Proportion of total B cells class-switched for IgA expression (IgA+IgD) in PP of RorcΔMir142 and Mir142fl/fl mice. Welch’s t-test, *p < 0.05, **p < 0.01, ***p < 0.001, ****p < 0.0001, ns = non-significant difference. n = 4–6 mice per experimental group. Data points represent individual biological replicates.
Fig. 5
Fig. 5
Mir142 regulates several predicted transcript targets and core biological pathways in LTi-like ILC3s. A. Heatmap of upregulated differentially expressed genes (DEGs) in RorcΔMir142 relative to Mir142fl/fl LTi-like ILC3s, identified as predicted miR-142-3p, miR-142-5p or miR-142-3p + miR-142-5p targets based on information from the miRDB microRNA target prediction database. B. Bubble plot depicting the top 15 significantly altered Gene Ontology (GO) Biological Process (BP) pathways in RorcΔMir142 relative to Mir142fl/fl LTi-like ILC3s C. Heatmap of DEGs contributing to significant alteration of Gene Ontology (GO) Biological Process (BP) term pathway ‘’Homeostasis of number of cells’’ in RorcΔMir142 relative to Mir142fl/fl LTi-like ILC3s D. Representative histogram overlay of Bcl-2 staining in LTi-like ILC3 from mesenteric lymph nodes (mLN) of Mir142fl/fl and RorcΔMir142 mice. Empty histogram = Bcl-2 fluorescence minus one (FMO). E. Quantification of Bcl-2 staining mean fluorescence intensity (MFI) for LTi-like ILC3s of the mLNs and PPs in RorcΔMir142 and Mir142fl/fl mice F. Heatmap of DEGs contributing to significant alteration of KEGG pathway ‘’Th17 cell differentiation’’ in RorcΔMir142 relative to Mir142fl/fl LTi-like ILC3s G. Representative histogram overlay of CD25 staining on LTi-like ILC3 from mesenteric lymph nodes (mLN) of Mir142fl/fl and RorcΔMir142 mice. H. Quantification of CD25 staining MFI for LTi-like ILC3s of the mLNs and PPs in RorcΔMir142 and Mir142fl/fl mice. I. Representative flow cytometry plots of GP130 staining on LTi-like ILC3 from mesenteric lymph nodes (mLN) of Mir142fl/fl and RorcΔMir142 mice. J. Quantification of proportions of LTi-like ILC3s of the mLNs and PPs expressing GP130, in RorcΔMir142 and Mir142fl/fl mice. Welch’s t-test, *p < 0.05, ***p < 0.001, ****p < 0.0001, ns = non-significant difference. n = 4–5 mice per experimental group. Data points represent individual biological replicates.
Fig. 6
Fig. 6
Mir142 regulates IL-17A production by LTi-like ILC3s via tuning of responsiveness to type 3 activating cytokines. A. Schematic depicting treatment and analysis of cultures containing LTi-like ILC3s relating to panels (B-E). B. Representative flow cytometry plots for intracellular staining of IL-22 and IL-17A production by LTi-like ILC3s of the Peyer’s Patches of RorcΔMir142 and Mir142fl/fl mice, following ex vivo stimulation with recombinant murine IL-6 + PMA+Ionomycin. C. Quantification of total proportion of LTi-like ILC3s expressing IL-22, as depicted in (B). D. Quantification of Mean Fluorescence Intensity (MFI) of IL-22 staining for total IL-22+ cells as depicted in (B). E. Quantification of total proportion of LTi-like ILC3s expressing IL-17A, as depicted in (B). F. Schematic depicting treatment and analysis of cultures containing LTi-like ILC3s relating to panels (G-J). G. Representative histograms for pSTAT5(Y694) staining of LTi-like ILC3s (CD45LowLineageCD90hiCCR6+) from Peyer’s Patches of RorcΔMir142 and Mir142fl/fl mice, stimulated with exogenous recombinant murine IL-2 (10 ng/ml) for 30 min ex vivo (or unstimulated pooled control). H. Quantification of total proportion of LTi-like ILC3s expressing pSTAT5(Y694), as detailed in (G). I. Quantification of MFI of pSTAT5(Y694) expressed by pSTAT5+ LTi-like ILC3s, as detailed in (H). J. Sample normalised ratio of CD25 to pSTAT5(Y694) MFI values for LTi-like ILC3s from Peyer’s Patches of RorcΔMir142 and Mir142fl/fl mice. K. Schematic depicting treatment and analysis of cultures containing LTi-like ILC3s relating to panels (L-N). L. Representative flow cytometry plots for intracellular staining of IL-22 and IL-17A production by LTi-like ILC3s of the Peyer’s Patches of RorcΔMir142 and Mir142fl/fl mice, following ex vivo stimulation as detailed in (K). M. Quantification of total proportion of LTi-like ILC3s expressing IL-17A, as depicted in (L). N. Quantification of Mean Fluorescence Intensity (MFI) of IL-17A staining for total IL-17A+ cells as depicted in (L). O. Schematic depicting treatment and analysis of cultures containing CD4+ Th17 relating to panels (P-R). P. Representative flow cytometry plots for intracellular staining of IL-17A production by Th17 cells of the Peyer’s Patches of RorcΔMir142 and Mir142fl/fl mice, as detailed in (O). Q. Quantification of total proportion of CD3+CD4+ T cells expressing IL-17A, as depicted in (P). R. Quantification of Mean Fluorescence Intensity (MFI) of IL-17A staining for total IL-17A+ cells as depicted in (P). Values on plots indicate frequencies of parental populations. *p = 0.05, **p = 0.01, ***p = 0.001, ****p = 0.0001, ns = non-significant difference. Data representative of 2 independent experiments performed with 4–7 age and sex matched mice per genotype. Data points represent individual biological replicates.

References

    1. Sonnenberg G.F. Regulation of intestinal health and disease by innate lymphoid cells. Int Immunol. 2014;26:501–507. - PMC - PubMed
    1. Vivier E., et al. Innate Lymphoid Cells: 10 Years On. Cell. 2018;174:1054–1066. - PubMed
    1. Wang W., et al. The Interaction between Lymphoid Tissue Inducer-Like Cells and T Cells in the Mesenteric Lymph Node Restrains Intestinal Humoral Immunity. Cell Rep. 2020;32 - PubMed
    1. Melo-Gonzalez F., et al. Antigen-presenting ILC3 regulate T cell-dependent IgA responses to colonic mucosal bacteria. J Exp Med. 2019;216:728–742. - PMC - PubMed
    1. Hepworth M.R., et al. Group 3 innate lymphoid cells mediate intestinal selection of commensal bacteria–specific CD4 + T cells. Science. 2015;1979(348):1031–1035. - PMC - PubMed

Substances

LinkOut - more resources