. 2024 Oct;29(7):100182.
doi: 10.1016/j.slasd.2024.100182. Epub 2024 Sep 6.

Development of an automated 3D high content cell screening platform for organoid phenotyping

Affiliations

Development of an automated 3D high content cell screening platform for organoid phenotyping

Suleyman B Bozal et al. SLAS Discov. 2024 Oct.

Abstract

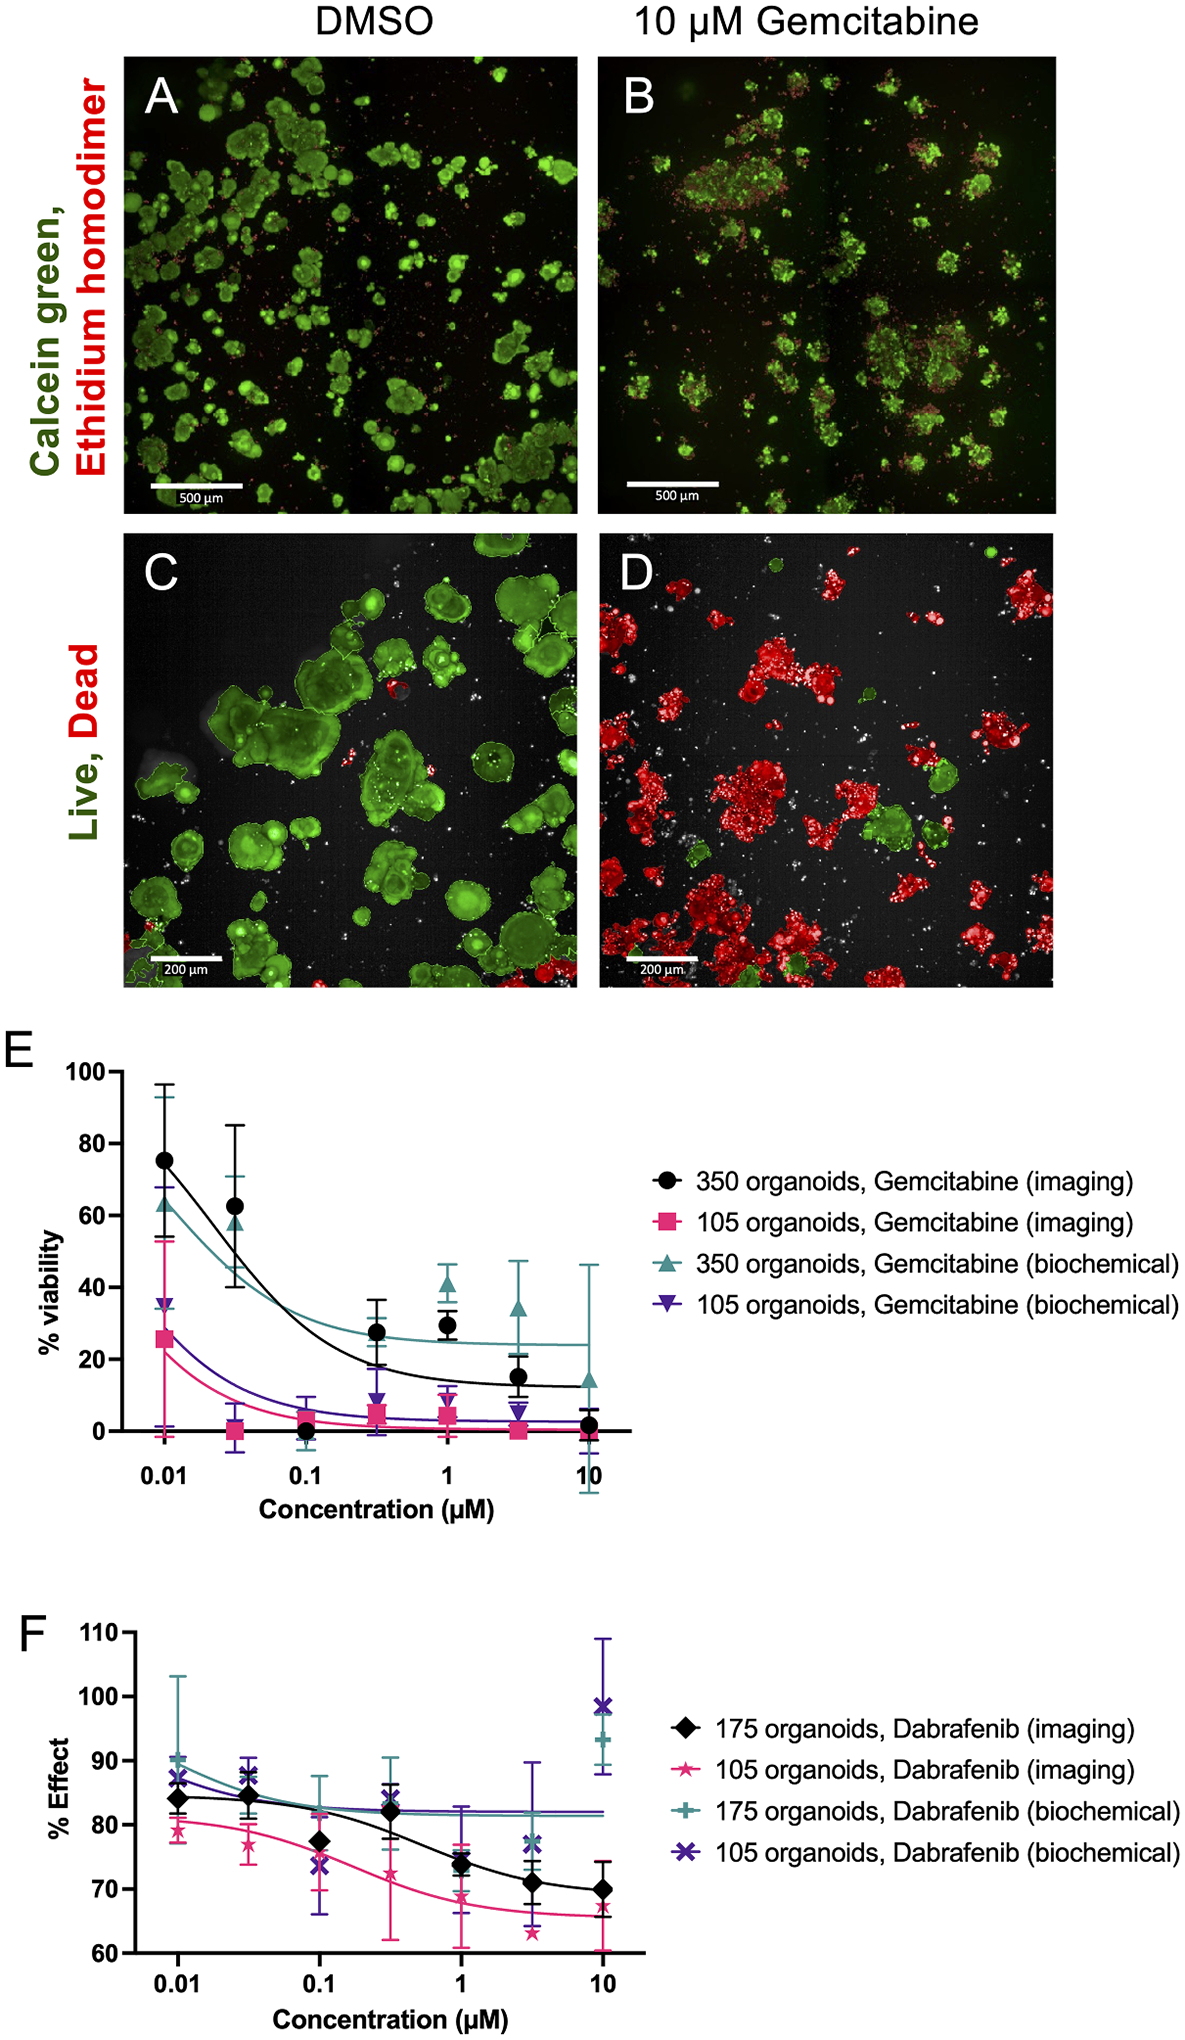
The use of organoid models in biomedical research has grown substantially since their inception. As they gain popularity among scientists seeking more complex and biologically relevant systems, there is a direct need to expand and clarify potential uses of such systems in diverse experimental contexts. Herein we outline a high-content screening (HCS) platform that allows researchers to screen drugs or other compounds against three-dimensional (3D) cell culture systems in a multi-well format (384-well). Furthermore, we compare the quality of robotic liquid handling with manual pipetting and characterize and contrast the phenotypic effects detected by confocal imaging and biochemical assays in response to drug treatment. We show that robotic liquid handling is more consistent and amendable to high throughput experimental designs when compared to manual pipetting due to improved precision and automated randomization capabilities. We also show that image-based techniques are more sensitive to detecting phenotypic changes within organoid cultures than traditional biochemical assays that evaluate cell viability, supporting their integration into organoid screening workflows. Finally, we highlight the enhanced capabilities of confocal imaging in this organoid screening platform as they relate to discerning organoid drug responses in single-well co-cultures of organoids derived from primary human biopsies and patient-derived xenograft (PDX) models. Altogether, this platform enables automated, imaging-based HCS of 3D cellular models in a non-destructive manner, opening the path to complementary analysis through integrated downstream methods.

Keywords: 3D tissue culture; Automation; High-content imaging; High-content screening; Image-based phenotyping; Organoid co-culture.


Conflict of interest statement

Declaration of competing interest The authors declare that they have no known competing financial interests or personal relationships that could have appeared to influence the work reported in this paper.

Figures

Fig. 1.
Fig. 1.
Compound transfer, dilution, and randomization is integrated between system components. (1) Compounds are transferred from stocks and (2) serially diluted before being (3) randomized on a 384-well compound reservoir plate. Compounds are then (4) pipetted into the assay plates with a 96-well head. The assay plates are then (5) transferred into an automation-compatible incubator.
Fig. 2.
Fig. 2.
Various factors contribute to the dependability of the automated experimental workflow and must be optimized prior to beginning experiments. (A) A heatmap of organoid position along the Z axis from the bottom of the assay plate to the top of the culture shows significant differences in organoid position depending on % of the culture comprised of Matrigel. (B) Organoid growth is affected by culture conditions, including the % Matrigel that they are plated with. 100 % Matrigel is more successful than 50 % Matrigel in growing organoids, irrespective of the number of organoids initially plated. (C) Different consumables (24-section plate, open trough plate) were tested to optimize organoid dispensing and compared to manual dispensing. Residuals were calculated by taking the absolute value of (target organoid number – organoid count in the well). Target organoid number was ~200 for these experiments with an n = 384 wells * denote p-value < 0.05 with an n = 384 wells. Scale bars = 500 μm in panel A.
Fig. 3.
Fig. 3.
Organoid segmentation and live/dead staining are used to assess viability and drug effects using Harmony software. Calcein green is used to stain live cells while ethidium homodimer (red) is used to stain dead cells. Representative images show calcein green and ethidium homodimer (red) staining in a CRC-PDXO treated with 0.5 % DMSO (A) and 10 μM gemcitabine (B). Pseudo-colored images show live (green) and dead (red) segmented CRC-PDXO in DMSO-treated (C) and 10 μM gemcitabine-treated cultures (D). (E) depicts cell viability curves gathered from imaging and biochemical analyses of the colorectal tumor organoids when 105 organoids are originally plated or when 350 organoids are originally plated (n = 4 technical replicates for each condition). (F) highlights the differences between biochemical-based and imaging-based analyses when the organoids are treated with dabrafenib (n = 4 technical replicates for each condition). (A) and (B) scale bars = 500 μm. (C) and (D) scale bars = 200 μm.
Fig. 4.
Fig. 4.
Viability curves with biochemical or imaging assays reveal differences in response to doxorubicin between bladder organoid cultures derived from two different patients (BO-1 & BO-2) and to different treatments. (A) shows BO-2′s differential responses to doxorubicin (DOC–HCl), Doxil, a proprietary liposome formulation of doxorubicin (Formulation 1), blank liposomes (Blank), and a histidine buffer control using imaging analysis (n = 4 technical replicates for each condition). (B) shows an area under the curve analyses for panel (A), highlighting significant differences between all treatments except between blank liposomes and histidine buffer. (C) shows difference in response to doxorubicin between two different bladder organoid lines, BO-1 and BO-2 using biochemical analysis (n = 4 technical replicates for each condition).
Fig. 5.
Fig. 5.
Organoids in single-cultures or co-cultures are classified into mCherry positive or mCherry negative and then classified into live (green) or dead (red). (A) Organoids that are highlighted either green or red have been classified as expressing mCherry. Green-highlighted organoids have also been classified as living while red-highlighted organoids have been classified as dead. (B) Organoids that are highlighted either green or red in this panel have been classified as mCherry (−) organoids. The green-highlighted ones are therefore mCherry (−) live organoids while the red-highlighted ones are mCherry (−) dead organoids. (C) and (D) depict a co-culture of mCherry (+) and mCherry (−) organoids plated in equal proportions. Organoids highlighted green or red in (C) show mCherry (+) organoids that are either classified live or dead, respectively. Organoids highlighted green or red in (D) show mCherry (−) organoids that are either classified live or dead, respectively. (E) and (F) show CO-2 organoids treated with 0.003 μM gemcitabine and 10 μM gemcitabine, respectively. (G) and (H) show CO-1 organoids treated with 0.003 μM gemcitabine and 10 μM gemcitabine, respectively. (I) and (J) show mCherry (+) organoids in a CO-1+CO-2 co-culture treated with 0.003 μM gemcitabine and 10 μM gemcitabine, respectively. (K) and (L) show mCherry (−) organoids in a CO-1+CO-2 co-culture treated with 0.003 μM gemcitabine and 10 μM gemcitabine, respectively. Green in all panels indicates organoids that were classified as living whereas red indicates organoids that were classified as dead. Images shown in A-D were gathered on Day 1 of the assay, ~24 hr after initial plating of the organoids. Images shown in E-L were gathered on Day 6 of the assay. Scale bar = 200 μm.
Fig. 6.
Fig. 6.
GR curves are generated using imaging and biochemical readouts after treatment with gemcitabine, combination dabrafenib/trametinib or DMSO control. Panel (A) compares GR curves generated by either biochemical or imaging modalities. (B) depicts GR curves from the same experiment overlayed on the same graph for easier comparison. n = 3 technical replicates for each condition depicted.

References

    1. Fitzgerald KA, et al. Life in 3D is never flat: 3D models to optimise drug delivery. Journal of Controlled Release 2015;215:39–54. - PubMed
    1. Jensen C, Teng Y. Is It Time to Start Transitioning From 2D to 3D Cell Culture? Front Mol Biosci 2020;7. - PMC - PubMed
    1. Kapałczyńska M, et al. 2D and 3D cell cultures - a comparison of different types of cancer cell cultures. Arch Med Sci 2018;14(4):910–9. - PMC - PubMed
    1. Wang Y, Jeon H. 3D cell cultures toward quantitative high-throughput drug screening. Trends Pharmacol Sci 2022;43(7):569–81. - PubMed
    1. Pleguezuelos-Manzano C, et al. Establishment and Culture of Human Intestinal Organoids Derived from Adult Stem Cells. Curr Protoc Immunol 2020;130(1):e106. - PMC - PubMed

Publication types

LinkOut - more resources