Clinical Trial
. 2024 Sep 8;15(1):7843.
doi: 10.1038/s41467-024-52143-6.

Non-invasive optoacoustic imaging of glycogen-storage and muscle degeneration in late-onset Pompe disease

Affiliations
Clinical Trial

Non-invasive optoacoustic imaging of glycogen-storage and muscle degeneration in late-onset Pompe disease

Lina Tan et al. Nat Commun. .

Abstract

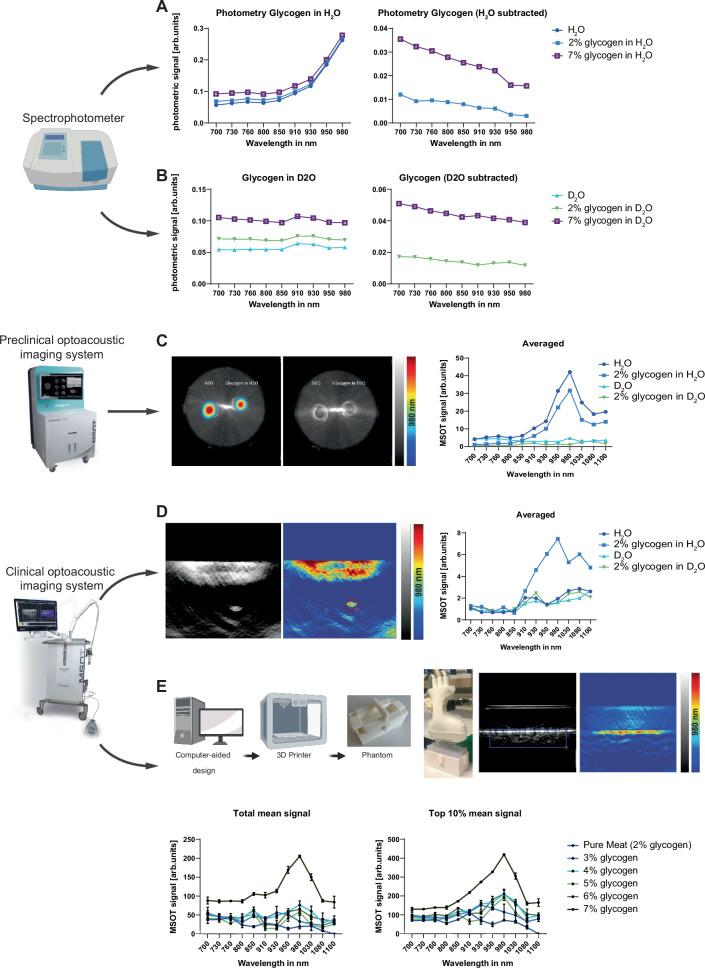
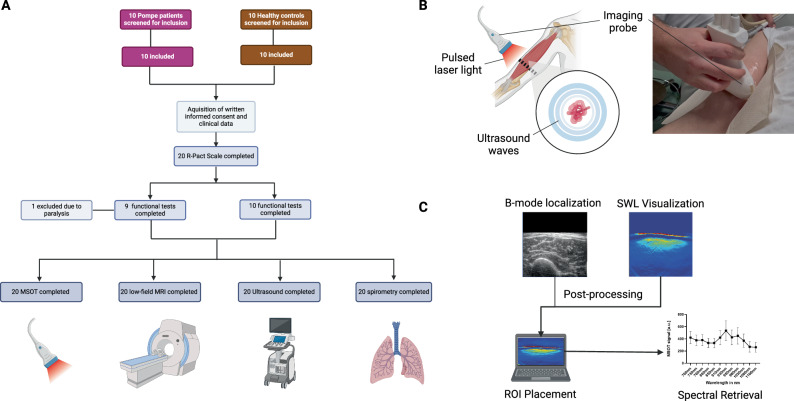
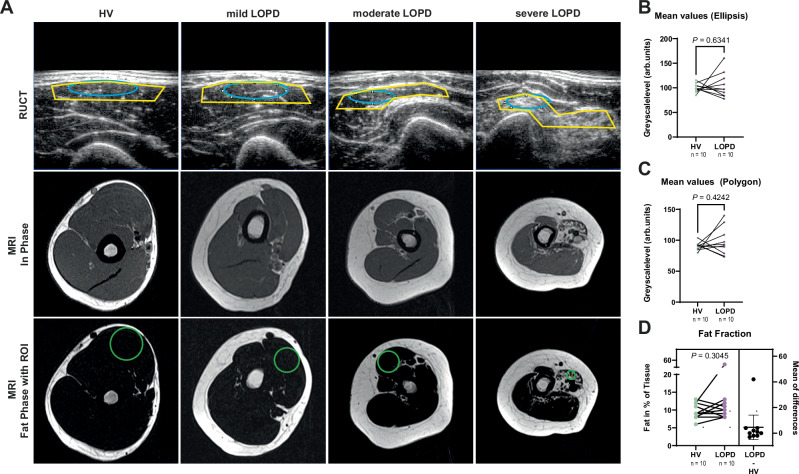
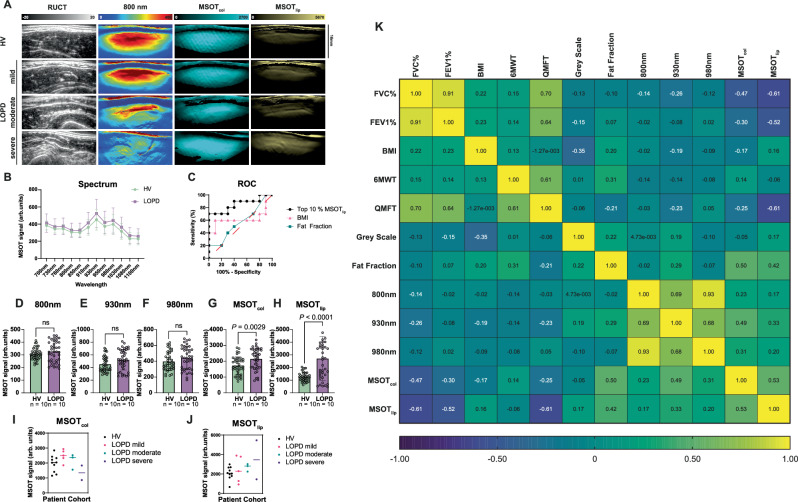
Pompe disease (PD) is a rare autosomal recessive glycogen storage disorder that causes proximal muscle weakness and loss of respiratory function. While enzyme replacement therapy (ERT) is the only effective treatment, biomarkers for disease monitoring are scarce. Following ex vivo biomarker validation in phantom studies, we apply multispectral optoacoustic tomography (MSOT), a laser- and ultrasound-based non-invasive imaging approach, in a clinical trial (NCT05083806) to image the biceps muscles of 10 late-onset PD (LOPD) patients and 10 matched healthy controls. MSOT is compared with muscle magnetic resonance imaging (MRI), ultrasound, spirometry, muscle testing and quality of life scores. Next, results are validated in an independent LOPD patient cohort from a second clinical site. Our study demonstrates that MSOT enables imaging of subcellular disease pathology with increases in glycogen/water, collagen and lipid signals, providing higher sensitivity in detecting muscle degeneration than current methods. This translational approach suggests implementation in the complex care of these rare disease patients.


Conflict of interest statement

A.P.R. and F.K. are co-inventors together with iThera Medical GmbH, Germany, on an EU patent application (EP 19 163 304.9) relating to a device and a method for analyzing optoacoustic data, an optoacoustic system and a computer program. F.K. is a member of the advisory board of iThera Medical GmbH, Munich, Germany. A.P.R. and F.K. received travel support from iThera Medical GmbH, Germany. A.P.R., A.L.W., and F.K. report travel support from Sanofi Aventis, Germany. A.P.R. and F.K. report lecture fees from Sanofi Genzyme. F.K. reports lecture fees from Siemens Healthcare GmbH. The other authors declare no competing interests.

Figures

Fig. 1
Fig. 1. Multimodal derivation of spectral information for glycogen reveals specific signatures for clinical imaging.
A Photometric absorption spectra between 700 and 980 nm for pure H2O, and H2O with 2% and 7% glycogen, respectively (left). Photometric absorption spectra with subtracted H2O background (right). B Photometric absorption spectra between 700 and 980 nm for pure D2O, and D2O with 2% and 7% glycogen, respectively (left). Photometric absorption spectra with subtracted D2O background (right). C Averaged optoacoustic signal in the preclinical imaging system from 700 to 1100 nm for pure H2O, pure D2O, and 2% glycogen in H2O and D2O, respectively. D Averaged optoacoustic signal in the clinical imaging system from 700 to 1100 nm for pure H2O, pure D2O, and 2% glycogen in H2O and D2O, respectively. E Averaged optoacoustic signal in the clinical imaging system from 700 to 1100 nm for pure minced meat and minced meat of the same origin with increasing glycogen concentrations. Values are given as mean values of scan data with negative signal intensities set to 0 or given as mean values of the top 10% of signal intensities per scan. The data represent one of two independent experiments with similar results. This figure was created with BioRender.com released under a Creative Commons Attribution-NonCommercial-NoDerivs 4.0 International license.
Fig. 2
Fig. 2. Study flowchart imaging approach and quantification of scan results.
A Consort flowchart diagram of the study. B Schematic and photographic representation of MSOT imaging approach. The imaging probe emitting pulsed laser light was held onto the distal third of the upper arm, scanning the biceps muscle. C Localization of appropriate scan was performed on ultrasound B-mode images. These were used to post-process optoacoustic spectral information. MSOT multispectral optoacoustic tomography, MRI magnetic resonance imaging, ROI region of interest, R-Pact Rasch-built Pompe-specific activity score. This figure was created with BioRender.com released under a Creative Commons Attribution-NonCommercial-NoDerivs 4.0 International license.
Fig. 3
Fig. 3. Standard muscle imaging by ultrasound and magnetic resonance imaging does not show discernable differences in biceps muscles of LOPD patients.
A Ultrasound images (top row) and In-Phase (middle row) and Fat-Phase (bottom-row) MRI of the biceps muscle. From left to right, HV, mildly, moderately and severely affected LOPD patients. Elliptic (blue) and polygonal (yellow) ROI used in RUCT images and circular ROI used in Fat-Phase MRI for quantification. B Mean GSL values of matched HV vs. LOPD patients using an elliptic ROI. C Mean GSL values of matched HV vs. LOPD patients using a polygonal ROI. Each independent muscle region was scanned twice. Results represent 80 datasets from n = 40 independent biceps muscle regions (n = 20 HV/n = 20 LOPD) in n = 20 biologically independent subjects (n = 10 HV and n = 10 patients with LOPD). Each filled dot represents one MSOT signal per mean biceps muscle region (4 datasets from n = 2 independent independent muscle regions from one biologically independent subject). HV are represented with green and LOPD patients with violet dots. D ROIs in MRI images were manually placed in transversal slices of the right biceps brachii muscle corresponding to the position of MSOT evaluation. Results represent 20 datasets from n = 20 independent biceps muscle regions (n = 10 HV/n = 10 LOPD) in n = 20 biologically independent subjects (n = 10 HV and n = 10 patients with LOPD). Each filled circle represents the fat fraction in percent per tissue signal per mean right biceps muscle (1 dataset from n = 1 independent muscle region from one biologically independent subject). HV are represented with green and LOPD patients with violet dots. To display differences in fat fractions, mean values from HV were subtracted from LOPD patients. One black dot represents one calculated ratio. Confidence intervals represent 95% CI ranging from −4.957 to 14.16, effect size (R2) 0.1164, mean of differences (LOPD – HV) 4.6, SD of differences 13.36, SEM of differences 4.225. Two-tailed dependent samples t-tests (matched for age and sex) were used for statistical analysis. If the assumption of normal distribution was violated, a Wilcoxon signed-rank was used. P ≤ 0.05 was considered statistically significant. HV healthy volunteer, LOPD late-onset Pompe disease patient, ROI region of interest, RUCT reflected ultrasound computed tomography, MRI magnetic resonance imaging.
Fig. 4
Fig. 4. MSOT quantification in human biceps muscles.
A From left to right: representative MSOT imaging quantification representing anatomic information (RUCT), unspecific tissue/muscle signal (SWL 800 nm), MSOTcol and MSOTlip. Disease severity of HV vs. LOPD (mildly, moderately and severely) is increasing from top to bottom cases. B Comparison of MSOT spectral signal values of HV and LOPD patients from 700 to 1100 nm. Each dot represents the mean of a whole proband group (HV = green, LOPD = violet), bars represent 95% CI. Results represent 80 datasets from n = 40 independent biceps muscle regions (n = 20 HV/n = 20 LOPD) in n = 20 biologically independent subjects (n = 10 HV and n = 10 patients with LOPD). C ROC Curve of Top 10% signals MSOTlip, BMI values and MRI fat fraction values to distinguish HV and LOPD muscles. n = 40 independent muscle regions (n = 20 HV/n = 20 LOPD) in n = 20 biologically independent subjects (n = 10 HV and n = 10 LOPD). Comparison of Top 10% of signal intensity for SWL 800 nm (D), 930 nm (E), 980 nm (F), MSOTcol (G), MSOTlip (H) between HV and LOPD patients with individual scans as individual data points. Results represent 80 datasets from n = 40 independent biceps muscle regions (n = 20 HV/n = 20 LOPD) in n = 20 biologically independent subjects (n = 10 HV and n = 10 patients with LOPD). Each bar displays the mean of top 10% MSOT signal of the biceps muscle of a whole proband group with the error bars indicating SD (green bar/dots = HV and violet bar/dots = LOPD). MSOT signal comparison for different LOPD severity (HV = black, mild = pink, green = moderate, severe = purple) for MSOTcol (I) and MSOTlip (J). Results represent 80 datasets from n = 40 independent biceps muscle regions (n = 20 HV/n = 20 LOPD) in n = 20 biologically independent subjects (n = 10 HV and n = 10 patients with LOPD). Each filled dot shows the mean of top 10% signal of the biceps muscle of different severity groups and HV (black dots = HV = QMFT = 64, pink dot = mild LOPD = QMFT 64–49, green dot = moderate LOPD = 48–33, purple dot = severe PD = 32–0). Statistical difference was tested with Welch’s t-test. K Correlation matrix for maximum MSOT signal intensity of SWL 800 nm, 930 nm, 980 nm and MSOTcol and MSOTlip correlated to reference clinical parameters including FVC%, FEV1%, BMI, 6MWT, QFMT, ultrasound greyscale levels, fat fraction. Correlations are indicated in the color range from highly negative (blue) to low negative/positive (green) to highly positive (yellow). Correlations are given by Spearman correlation coefficient (rs), two-tailed test. P ≤ 0.05 was considered statistically significant. n = 20 biologically independent subjects (n = 10 HV/n = Confidence interval was 95% 10 patients with LOPD). HV healthy volunteer, LOPD late-onset Pompe disease patient, MSOT multispectral optoacoustic tomography, RUCT reflected ultrasound computed tomography, ROC receiver operating characteristic curve, FVC functional vital capacity, FEV1 forced expiratory volume, BMI body mass index, 6MWT 6-min walking test, QMFT quick motor function test.
Fig. 5
Fig. 5. Multicenter patient cohort comparison proves the applicability and validity of MSOT approach.
A Interrater analysis comparison of MSOT mean signals for two independent investigators (investigator 1, investigator 2) of two clinical centers (LOPD center 1, LOPD center 2) independently analyzed the same MSOT biceps muscle scans (10 datasets from n = 6 independent biceps muscle regions (n = 3 LOPD) in n = 3 biologically independent subjects). Data collected by center 2. B Interrater analysis comparison of MSOT top 10% signals for two independent investigators (investigator 1, investigator 2) of two clinical centers (LOPD center 1, LOPD center 2) independently analyzed the same MSOT biceps muscle scans (10 datasets from n = 6 independent biceps muscle regions (n = 3 LOPD) in n = 3 biologically independent subject). Data collected by center 2. Dual center comparison (center 1: n = 10 vs. center 2: n = 3) of mean (C) and top 10% (D) MSOT signals. Each filled blue circle displays the mean (C) and top 10% (D) of LOPD patients of center 1, each filled yellow circle displays the mean (C) and top 10% (D) of LOPD patients of center 2. Results of center 1 represent 80 datasets from n = 40 independent biceps muscle regions (n = 20 HV/n = 20 LOPD) in n = 20 biologically independent subjects (n = 10 HV and n = 10 patients with LOPD). Results of center 2 represent 10 datasets from n = 6 independent biceps muscle regions (n = 3 LOPD) in n = 3 biologically independent subjects. Comparison of mean MSOTcol (E), top 10% MSOTcol (F), mean MSOTlip (G), and top 10% MSOTlip (H) between HV and LOPD patients of both centers. Green bar representing HV consists of 40 datasets from n = 20 independent biceps muscle regions of n = 10 biologically independent subjects. Blue bar representing LOPD Center 1 of 40 datasets from n = 20 independent biceps muscle regions of n = 10 biologically independent subjects, yellow bar representing center 2 consists of 10 datasets from n = 6 independent biceps muscle regions (n = 3 LOPD) of n = 3 biologically independent subjects. Ordinary one-way ANOVA was used for statistical analysis. If the assumption of normal distribution was violated, a Kruskal–Wallis test was used. Box plots are defined with a minimum at the 25th percentile, a maximum at the 75th percentile, center at the median value and whiskers at the minimal and maximal data points of each subgroup. MSOT multispectral optoacoustic tomography, HV healthy volunteer, LOPD late-onset Pompe disease patient.

References

    1. Kishnani, P. S. et al. Pompe disease diagnosis and management guideline. Genet. Med.8, 267–288 (2006). 10.1097/01.gim.0000218152.87434.f3 - DOI - PMC - PubMed
    1. Kroos, M. et al. Update of the Pompe disease mutation database with 107 sequence variants and a format for severity rating. Hum. Mutat.29, E13–E26 (2008). 10.1002/humu.20745 - DOI - PubMed
    1. Kohler, L., Puertollano, R. & Raben, N. Pompe disease: from basic science to therapy. Neurotherapeutics15, 928–942 (2018). 10.1007/s13311-018-0655-y - DOI - PMC - PubMed
    1. Pompe, J. C. Over idiopathische hypertrophie van het hart. Ned. Tijdschr. Geneeskd.76, 304–311 (1932).
    1. Hers, H. G. α-Glucosidase deficiency in generalized glycogen-storage disease (Pompe’s disease). Biochem. J.86, 11–16 (1963). 10.1042/bj0860011 - DOI - PMC - PubMed

Publication types

Associated data