. 2024 Sep 8;21(1):219.
doi: 10.1186/s12974-024-03213-5.

Microglial morphological/inflammatory phenotypes and endocannabinoid signaling in a preclinical model of periodontitis and depression

Affiliations

Microglial morphological/inflammatory phenotypes and endocannabinoid signaling in a preclinical model of periodontitis and depression

Javier Robledo-Montaña et al. J Neuroinflammation. .

Abstract

Background: Depression is a chronic psychiatric disease of multifactorial etiology, and its pathophysiology is not fully understood. Stress and other chronic inflammatory pathologies are shared risk factors for psychiatric diseases, and comorbidities are features of major depression. Epidemiological evidence suggests that periodontitis, as a source of low-grade chronic systemic inflammation, may be associated with depression, but the underlying mechanisms are not well understood.

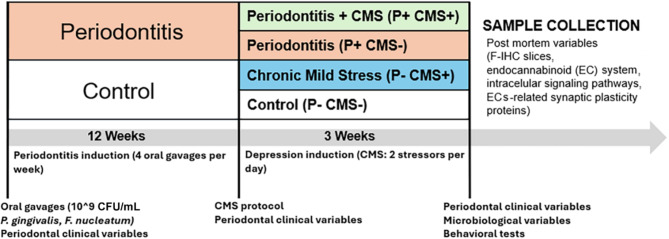
Methods: Periodontitis (P) was induced in Wistar: Han rats through oral gavage with the pathogenic bacteria Porphyromonas gingivalis and Fusobacterium nucleatum for 12 weeks, followed by 3 weeks of chronic mild stress (CMS) to induce depressive-like behavior. The following four groups were established (n = 12 rats/group): periodontitis and CMS (P + CMS+), periodontitis without CMS, CMS without periodontitis, and control. The morphology and inflammatory phenotype of microglia in the frontal cortex (FC) were studied using immunofluorescence and bioinformatics tools. The endocannabinoid (EC) signaling and proteins related to synaptic plasticity were analyzed in FC samples using biochemical and immunohistochemical techniques.

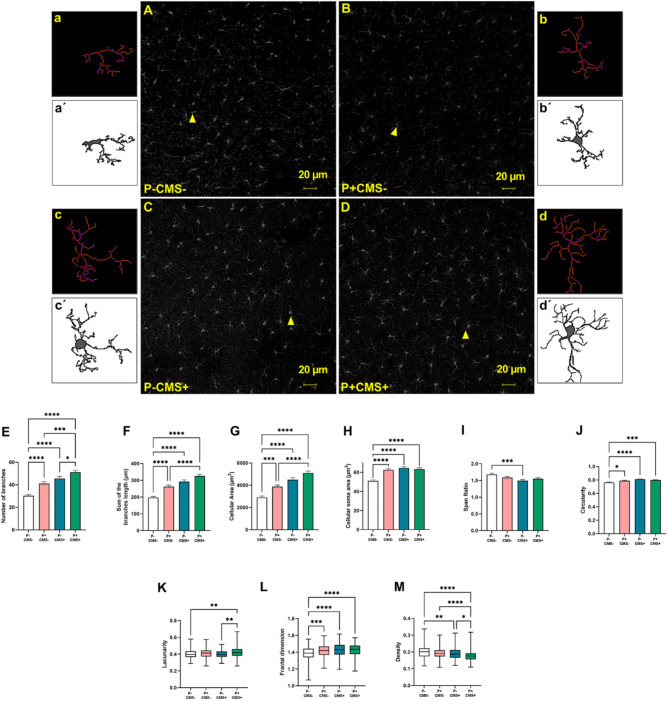
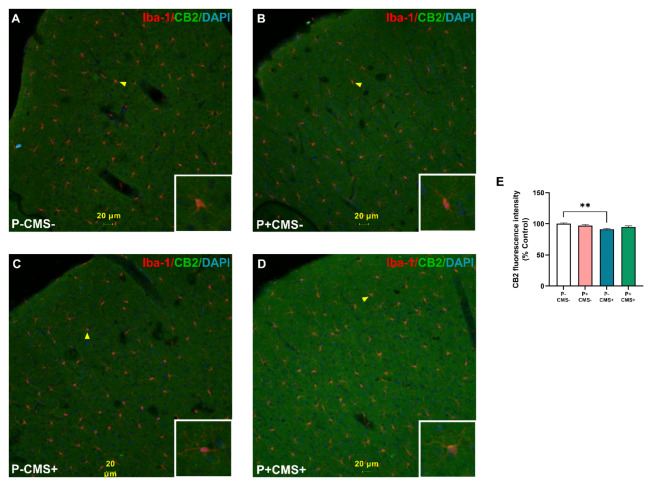
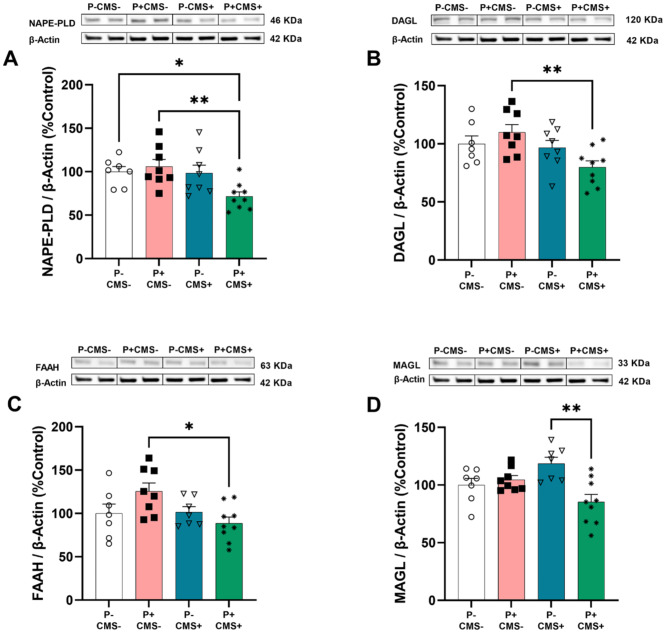
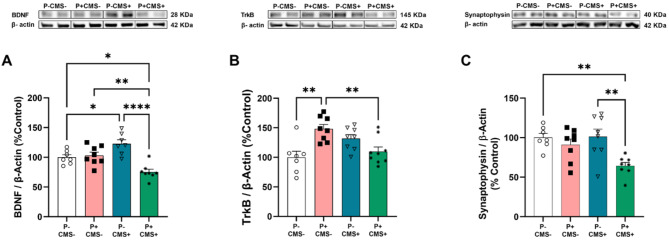
Results: Ultrastructural and fractal analyses of FC revealed a significant increase in the complexity and heterogeneity of Iba1 + parenchymal microglia in the combined experimental model (P + CMS+) and increased expression of the proinflammatory marker inducible nitric oxide synthase (iNOS), while there were no changes in the expression of cannabinoid receptor 2 (CB2). In the FC protein extracts of the P + CMS + animals, there was a decrease in the levels of the EC metabolic enzymes N-acyl phosphatidylethanolamine-specific phospholipase D (NAPE-PLD), diacylglycerol lipase (DAGL), and monoacylglycerol lipase (MAGL) compared to those in the controls, which extended to protein expression in neurons and in FC extracts of cannabinoid receptor 1 (CB1) and to the intracellular signaling molecules phosphatidylinositol-3-kinase (PI3K), protein kinase B (Akt) and extracellular signal-regulated kinase 1/2 (ERK1/2). The protein levels of brain-derived neurotrophic factor (BDNF) and synaptophysin were also lower in P + CMS + animals than in controls.

Conclusions: The combined effects on microglial morphology and inflammatory phenotype, the EC signaling, and proteins related to synaptic plasticity in P + CMS + animals may represent relevant mechanisms explaining the association between periodontitis and depression. These findings highlight potential therapeutic targets that warrant further investigation.

Keywords: Depression; Endocannabinoid signaling; Microglia; Periodontitis; Synaptic plasticity.


Conflict of interest statement

The authors declare no competing interests.

Figures

Fig. 1
Fig. 1
Experimental protocol. Induction of periodontitis in Wistar male rats via experimental oral gavage with a solution of periodontal bacteria (12 weeks) and subsequent exposure to a model of chronic mild stress (3 weeks) [13]. CFU: colony-forming unit, F-IHC: fluorescence immunohistochemistry
Fig. 2
Fig. 2
Analysis of microglial morphology in the FC of rats in control conditions (P-CMS-) after periodontitis induction (P + CMS-), after chronic mild stress exposure (P-CMS+), and after both protocols combined (P + CMS+). Immunofluorescence of Iba-1 in representative images of 30 mm-thick sections. (P-CMS-) (A), (P + CMS-) (B), (P-CMS+) (C), and (P + CMS+) (D) skeletonized and binaries outlined images of the microglia mentioned above. Yellow arrowheads indicate representative cells. Statistical analysis of the number of microglial branches (E), the sum of branch length (F), cell area (G), cellular soma area (H), span ratio (I), circularity (J), lacunarity (K), fractal dimension (L) and density (M). The data are presented as the means ± SEMs of 144 microglia per group. *p < 0.05; **p < 0.01; ***p < 0.001; ****p < 0.0001. Scale bars = 20 μm. One-way ANOVA with Tukey’s post hoc test for the cellular soma area and the Kruskal‒Wallis test with Dunn´s post hoc test were used for the remaining parameters
Fig. 3
Fig. 3
iNOS immunoreactivity in parenchymal microglia of the FC of rats in control conditions (P-CMS-), after periodontitis induction (P + CMS-), after chronic mild stress exposure (P-CMS+), and after both protocols combined (P + CMS+). Immunofluorescence of Iba1 (red), iNOS (green), and 4′,6-diamidino-2-phenylindole dihydrochloride (DAPI) in nuclei (blue) was performed in representative images of 30 mm-thick sections of rat brain FC from the P-CMS- (A), P + CMS- (B), P-CMS+ (C), and P + CMS+ (D) groups. Arrowheads indicate representative cells. Quantitative analysis of iNOS expression in Iba1 + cells (E). The data are presented as the means ± SEMs of 34–36 microglia per group. ***p < 0.001. Kruskal‒Wallis test with Dunn´s post hoc test. Scale bars = 20 μm
Fig. 4
Fig. 4
CB2 immunoreactivity in parenchymal microglia of the FC of rats in control conditions (P-CMS-), after periodontitis induction (P + CMS-), after chronic mild stress exposure (P-CMS+), and after both protocols combined (P + CMS+). Immunofluorescence of Iba1 (red), CB2 (green) and 4′,6-diamidino-2-phenylindole dihydrochloride (DAPI) signals in nuclei (blue) in representative images of 30 mm-thick sections of rat brain FC from the P-CMS- (A), P + CMS- (B), P-CMS+ (C), and P + CMS+ (D) groups was performed. Arrowheads indicate representative cells. Quantitative analysis of CB2 expression in Iba1 + cells (E). The data are presented as the means ± SEMs of 34–36 microglia per group. **p < 0.01. One-way ANOVA was performed following Tukey’s post hoc test. Scale bars = 20 μm
Fig. 5
Fig. 5
Endocannabinoid metabolism in the FC of rats in control conditions (P-CMS-), after periodontitis induction (P + CMS-), after chronic mild stress exposure (P-CMS+), and after both protocols combined (P + CMS+). Protein expression of N-acyl phosphatidylethanolamine-specific phospholipase D (NAPE-PLD) (A), diacylglycerol lipase (DAGL) (B), fatty acid amide hydrolase (FAAH) (C), and monoacylglycerol lipase (MAGL) (D) in FC samples by WB. The densitometric data of the band of interest were normalized to that of beta-actin (β-actin). The data are presented as the means ± SEMs of 6–9 rats per group. *p < 0.05, **p < 0.01. One-way ANOVA with a Tukey post hoc test. Blots were cropped (black lines) to improve the clarity and conciseness of the presentation
Fig. 6
Fig. 6
Cannabinoid receptor 1 (CB1) immunoreactivity in NeuN + cells and CB1 expression by western blot (WB) in the frontal cortex (FC) of rats in control conditions (P-CMS-), after periodontitis induction (P + CMS-) after chronic mild stress exposure (P-CMS+), and after both protocols combined (P + CMS+). Immunofluorescence of NeuN (red), CB1 (green) and 4′,6-diamidino-2-phenylindole dihydrochloride (DAPI) signals in nuclei (blue) in representative images of 30 mm-thick sections of rat brain FC from the P-CMS- (A), P + CMS- (B), P-CMS+ (C), and P + CMS+ (D) groups was performed. Arrowheads indicate representative cells. Quantitative analysis of CB1 expression in NeuN + cells (E). The data are presented as the means ± SEMs of 54 neurons per group. ****p < 0.0001. Scale bars = 20 μm. Protein expression of CB1 in FC samples by WB (F). The densitometric data of the band of interest were normalized to that of β-actin. The data are presented as the means ± SEMs of 6–9 rats per group. *p < 0.05, **p < 0.01. One-way ANOVA with a Tukey post hoc test after logarithmic transformation. Blots were cropped (black lines) to improve the clarity and conciseness of the images
Fig. 7
Fig. 7
Intracellular signaling pathways in the frontal cortex (FC) of rats in control conditions (P-CMS-), after periodontitis induction (P + CMS-), after chronic mild stress exposure (P-CMS+), and after both protocols combined (P + CMS+). Protein expression of phosphatidylinositol-3-kinase (PI3K) (A), phospho-protein kinase B (p-Akt)/Akt ratio (B), p-extracellular signal-regulated kinase (p-ERK)/ERK ratio (C) and phospho-cAMP response element-binding protein (p-CREB)/CREB ratio (D) in FC samples by WB. The densitometric data of the band of interest were normalized to that of β-actin. The data are presented as the means ± SEMs of 6–9 rats per group. *p < 0.05, **p < 0.01. One-way ANOVA with a Tukey post hoc test. Blots were cropped (black lines) to improve the clarity and conciseness of the images
Fig. 8
Fig. 8
Synaptic plasticity markers in the frontal cortex (FC) of rats in control conditions (P-CMS-), after periodontitis induction (P + CMS-), after chronic mild stress exposure (P-CMS+), and after both protocols combined (P + CMS-). Protein expression of brain-derived neurotrophic factor (BDNF) (A), tropomyosin receptor kinase B (TrkB) (B) and synaptophysin (C) in FC samples by WB. The densitometric data of the band of interest were normalized to that of β-actin. The data are presented as the means ± SEMs of 6–9 rats per group. *p < 0.05, **p < 0.01. One-way ANOVA with a Tukey post hoc test. Blots were cropped (black lines) to improve the clarity and conciseness of the images

References

    1. Otte C, Gold SM, Penninx BW, Pariante CM, Etkin A, Fava M, Mohr DC, Schatzberg AF. Major depressive disorder. Nat Reviews Disease Primers. 2016;2:16065. 10.1038/nrdp.2016.65 - DOI - PubMed
    1. GBD: Global Burden of Disease Study 2019. (GBD 2019) Results tool. Seattle, United States of America: Institute for Health Metrics and Evaluation (IHME); 2021.
    1. World Health A. Global burden of mental disorders and the need for a comprehensive, coordinated response from health and social sectors at the country level: report by the Secretariat. Geneva: World Health Organization; 2012.
    1. Yuan K, Zheng YB, Wang YJ, Sun YK, Gong YM, Huang YT, Chen X, Liu XX, Zhong Y, Su SZ, et al. A systematic review and meta-analysis on prevalence of and risk factors associated with depression, anxiety and insomnia in infectious diseases, including COVID-19: a call to action. Mol Psychiatry. 2022;27:3214–22. 10.1038/s41380-022-01638-z - DOI - PMC - PubMed
    1. Greenberg P, Chitnis A, Louie D, Suthoff E, Chen SY, Maitland J, Gagnon-Sanschagrin P, Fournier AA, Kessler RC. The Economic Burden of Adults with Major Depressive Disorder in the United States (2019). Adv Ther 2023. - PMC - PubMed

Substances

LinkOut - more resources