. 2024 Sep 8;15(1):7854.
doi: 10.1038/s41467-024-52157-0.

Structural basis of eukaryotic transcription termination by the Rat1 exonuclease complex

Affiliations

Structural basis of eukaryotic transcription termination by the Rat1 exonuclease complex

Tatsuo Yanagisawa et al. Nat Commun. .

Abstract

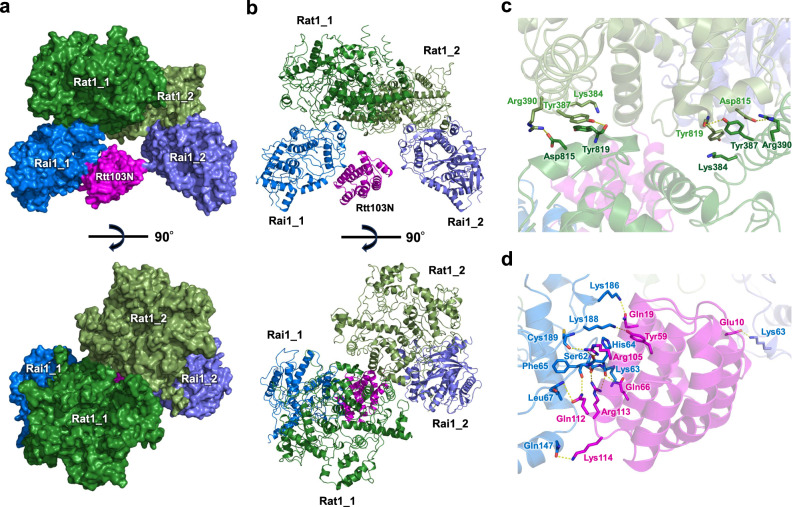
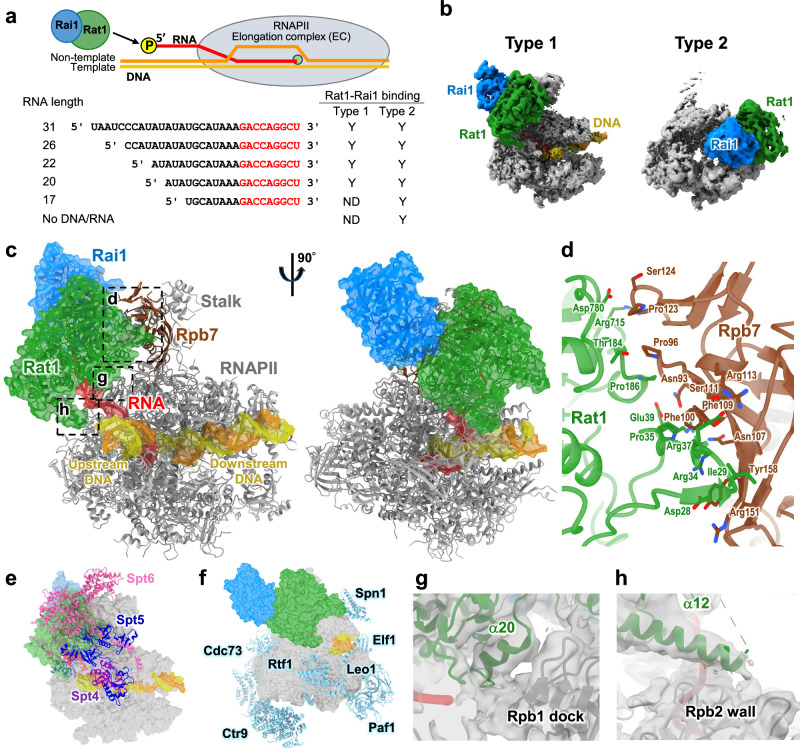
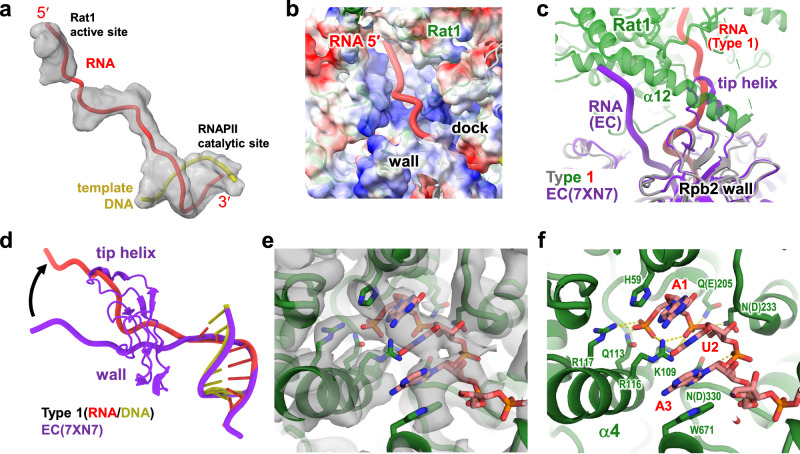
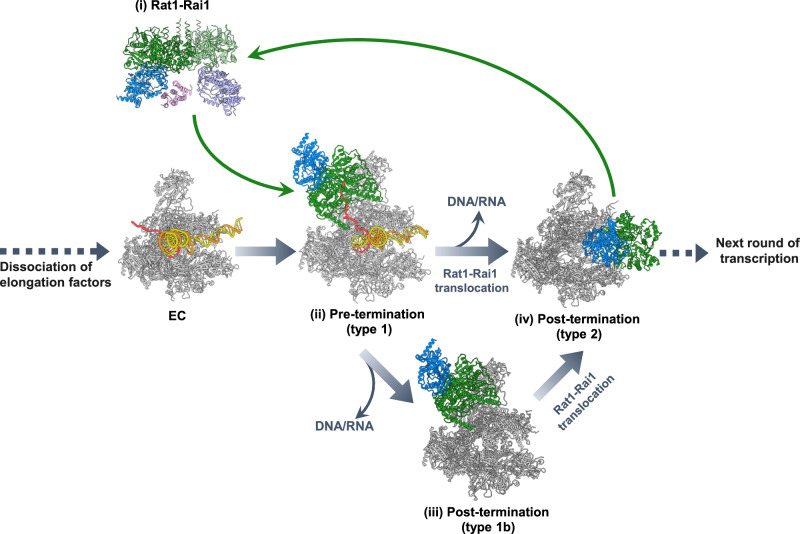
The 5´-3´ exoribonuclease Rat1/Xrn2 is responsible for the termination of eukaryotic mRNA transcription by RNAPII. Rat1 forms a complex with its partner proteins, Rai1 and Rtt103, and acts as a "torpedo" to bind transcribing RNAPII and dissociate DNA/RNA from it. Here we report the cryo-electron microscopy structures of the Rat1-Rai1-Rtt103 complex and three Rat1-Rai1-associated RNAPII complexes (type-1, type-1b, and type-2) from the yeast, Komagataella phaffii. The Rat1-Rai1-Rtt103 structure revealed that Rat1 and Rai1 form a heterotetramer with a single Rtt103 bound between two Rai1 molecules. In the type-1 complex, Rat1-Rai1 forms a heterodimer and binds to the RNA exit site of RNAPII to extract RNA into the Rat1 exonuclease active site. This interaction changes the RNA path in favor of termination (the "pre-termination" state). The type-1b and type-2 complexes have no bound DNA/RNA, likely representing the "post-termination" states. These structures illustrate the termination mechanism of eukaryotic mRNA transcription.


Conflict of interest statement

The authors declare no competing interests.

Figures

Fig. 1
Fig. 1. Structure of the Rat1-Rai1-Rtt103 complex.
a, b The K. phaffii Rat1-Rai1 heterotetramer complexed with Rtt103 is represented as a surface and ribbon model. Rat1 is colored green and grass green, Rai1 is colored marine and purple blue and the N-terminal domain of Rtt103 (Rtt103N) is colored magenta. Bottom, view after a 90° rotation about the horizontal axis from the upper panel. c A close-up view of the Rat1 dimer interface. The Rat1 residues involved in dimerization are shown by green stick models. Hydrogen bonding interactions are represented by dotted lines. d A close-up view of the interface between Rai1 and Rtt103N. The Rai1 and Rtt103 residues are shown by blue and magenta stick models, respectively. A transparent ribbon model of the Rat1-Rai1 (blue and green) complexed with Rtt103 (magenta) is shown in the background. Hydrogen bonds and ionic interactions between Rai1 and Rtt103 are represented by dotted lines.
Fig. 2
Fig. 2. Structure of the RNAPII pre-termination complex (type 1).
a Schematic representation of the EC-Rat1-Rai1 complex and the RNA sequences used in this study. Y, the indicated complex was observed in cryo-EM analysis; ND, not detected (Supplementary Fig. 17). b Structures of the type-1 and type-2 RNAPII-Rat1-Rai1 complexes. The composite maps were generated from the overall-masked maps and the Rat1-Rai-masked focused maps by Phenix. The maps are colored to match the structural models (gray, RNAP; green, Rat1, blue, Rai1; yellow, DNA; red, RNA). c Structure of the elongation complex (EC) engaged with Rat1-Rai1 at the RNA exit (the type-1 complex). The structural model is displayed in two orientations. RNAPII, template DNA, non-template DNA, RNA, Rat1, and Rai1 are colored gray (Rpb7 in brown), yellow, orange, green, and blue, respectively. Transparent surfaces of DNA/RNA, Rat1, and Rai1 are overlaid. d Close-up view of the Rpb7-Rat1 interface. e The Rat1-binding site overlaps with the binding sites of the elongation factors Spt5 and Spt6. The structural model of the type-1 complex is shown in transparent surface, colored as in (c). The structural model of RNAPII EC (PDB 7XN7) is superimposed with the type-1 complex by the Rpb1 subunit. Elongation factors Spt4, Spt5 and Spt6 are shown in cartoon representation and colored purple, blue, and pink, respectively. f The Rat1-binding site does not overlap with the binding sites of the Paf1 complex (Paf1, Leo1, Ctr9, Cdc73, and Rtf1), Elf1, and Spn1. The structural model of the type-1 complex is shown in transparent surface, colored as in (c). The structural model of RNAPII EC (PDB 7XN7) is superimposed with the type-1 complex by the Rpb1 subunit, and the elongation factors are shown in cartoon representation colored in light blue. g A close-up view of the interaction between the Rpb1 dock domain and the Rat1 α20 helix. Cryo-EM map (transparent surfaces) is overlaid on the structural model. h A close-up view of the interaction between the Rpb2 wall domain and the Rat1 α12 helix. The cryo-EM map (transparent surfaces) is overlaid on the structural model.
Fig. 3
Fig. 3. RNA structure and path in the RNAPII pre-termination complex (type 1).
a Cryo-EM map of the RNA in the type-1 complex. The cryo-EM map was segmented by ChimeraX, and regions around the RNA and DNA/RNA hybrid are shown as transparent surfaces overlaid on the structural model. b RNA channel in the type-1 complex. A transparent surface of RNAPII and Rat1 (colored by electrostatic surface potentials) is overlaid on the cartoon model (colored as in Fig. 2c). c, d Comparing the RNA path at the RNAPII RNA exit. The structure of RNAPII EC (PDB 7XN7, purple) is superposed on the type-1 complex (colored as in Fig. 2c) by the Rpb1 subunit. e, f Structure of the Rat1 active site with the RNA 5´-end incorporated. e The cryo-EM map (transparent surfaces) is overlaid on the structural model (cartoon and stick models). f The side chains of the Rat1 residues interacting with the RNA are shown as stick models. Putative hydrogen bonds between Rat1 and RNA are shown as yellow dashed lines. The wild-type amino acids are shown in parentheses for the residues mutated in the Rat1 active site (residues 205, 233, and 330).
Fig. 4
Fig. 4. Structure of RNAPII bound with Rat1-Rai1 at the RNA exit (type 1b).
a, b Structures of the type-1 and type-1b complexes. Cryo-EM maps (white surfaces) are overlaid on the structural models (cartoon representation, colored as in Fig. 2). c Comparison of the type-1 and type-1b complexes. The structural models for the type-1 and type-1b complexes are superimposed by the Rpb1 subunit.
Fig. 5
Fig. 5. Structure of Rat1-Rai1 bound within the RNAPII cleft (type 2).
a Structure of Rat1-Rai1 bound within the RNAPII cleft (the type-2 complex). The structural model is displayed in two orientations, colored as in Fig. 2. The transparent surfaces of Rat1 and Rai1 are overlaid. b Comparison of the type-1 and type-2 complexes. The structural models for the type-1 (light orange) and type-2 complexes (colored as in (a)) are superimposed by the Rpb2 subunit. Structural models for RNAPII are shown in cartoon representation. The RNAPII clamp of the type-1 complex is colored red. c Comparison of the Rat1-Rai-1 binding sites in the type-1 and type-2 complexes. The structural models are superimposed by the Rpb2 subunit. d A close-up view of the interaction between the Rpb2 lobe and the Rat1 α20 helix. Cryo-EM map is overlaid on the structural model. e A close-up view of the interaction between the RNAPII clamp and the Rai1. Cryo-EM map is overlaid on the structural model. f, g Comparison of the Rat1 and RNAPII interfaces in the type-1 and type-2 complexes. RNAPII is shown as a cartoon representation, and Rat1 is shown as a surface representation. The Rat1 regions interacting with RNAPII in the type-1 complex are colored salmon (Rat1-Rpb7 interface, Fig. 2d), yellow (the α20 helix), and orange (the α12 helix), respectively. h Overlapping binding sites for Rat1-Rai1 and double-stranded DNA in the transcription pre-initiation complex (PIC). The structural model of the type-2 complex is shown in cartoon representation, colored as in (a). The structural model of RNAPII PIC (PDB 5FZ5) is superimposed on the type-2 complex by the Rpb2 subunit. The template DNA (yellow) and the non-template DNA (orange) of the PIC are shown in surface representation. i Overlapping binding sites for Rat1-Rai1 and elongation factors Spt4, Spt5, and Elf1. The structural model of the type-2 complex is shown in cartoon representation, colored as in (a). The structural model of RNAPII EC (PDB 7XN7) is superposed on the type-2 complex by the Rpb2 subunit. Elongation factors Spt4, Spt5, and Elf1 are shown in surface representation.
Fig. 6
Fig. 6. Model of Rat1-dependent transcription termination.
(i) Rat1-Rai1 exists as a tetramer in free form, and the tetramer holds one Rtt103 molecule. When recruited to transcribing RNAPII, the Rat1-Rai1 tetramer dissociates into a dimer. The Rat1-Rai1 binding to RNAPII requires the prior dissociation of Spt6 and Spt4/5 from RNAPII (except for the KOW5 domain of Spt5). (ii) Rat1 captures the monophosphorylated RNA 5´-end, which is generated by cleavage of mRNA precursor at the polyadenylation site and starts trimming of the RNA. When Rat1 trimmed the RNA to its length of 20–22 nt, Rat1-Rai1 forms a close contact with RNAPII. (iii) Further RNA trimming triggers bubble collapse and DNA/RNA release. (iv) After termination, Rat1-Rai1 is relocated to the empty DNA-binding site of RNAPII for occlusion. Alternatively, Rat1-Rai1 could move from the RNA-exit site (ii) to the RNAPII cleft (iv), to actively dislodge DNA/RNA from the RNAPII cleft. Rat1-Rai1 bound to the RNAPII cleft would protect RNAPII until it is recycled into a PIC for another round of transcription.

References

    1. Osman, S. & Cramer, P. Structural biology of RNA polymerase II transcription: 20 years on. Annu. Rev. Cell Dev. Biol.36, 1–34 (2020). 10.1146/annurev-cellbio-042020-021954 - DOI - PubMed
    1. Kwak, H. & Lis, J. T. Control of transcriptional elongation. Annu. Rev. Genet.47, 483–508 (2013). 10.1146/annurev-genet-110711-155440 - DOI - PMC - PubMed
    1. Bentley, D. Coupling mRNA processing with transcription in time and space. Nat. Rev. Genet.15, 163–175 (2014). 10.1038/nrg3662 - DOI - PMC - PubMed
    1. Komarnitsky, P., Cho, E. & Buratowski, S. Different phosphorylated forms of RNA polymerase II and associated mRNA processing factors during transcription. Genes Dev.14, 2452–2460 (2000). 10.1101/gad.824700 - DOI - PMC - PubMed
    1. Buratowski, S. The CTD code. Nat. Struct. Biol.10, 679–680 (2003). 10.1038/nsb0903-679 - DOI - PubMed

Publication types

MeSH terms

LinkOut - more resources