

Joint genotype and ancestry analysis identify novel loci associated with atopic dermatitis in African American population
- PMID: 39245941
- PMCID: PMC11470243
- DOI: 10.1016/j.xhgg.2024.100350
Joint genotype and ancestry analysis identify novel loci associated with atopic dermatitis in African American population
Abstract
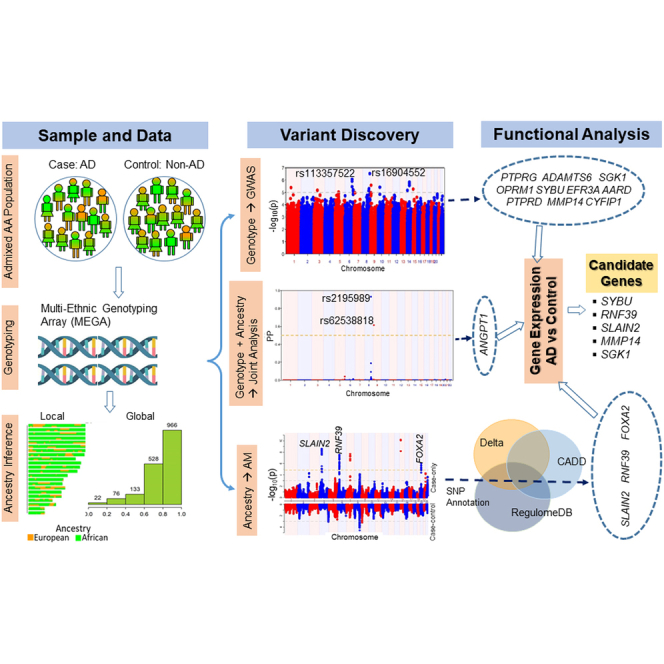
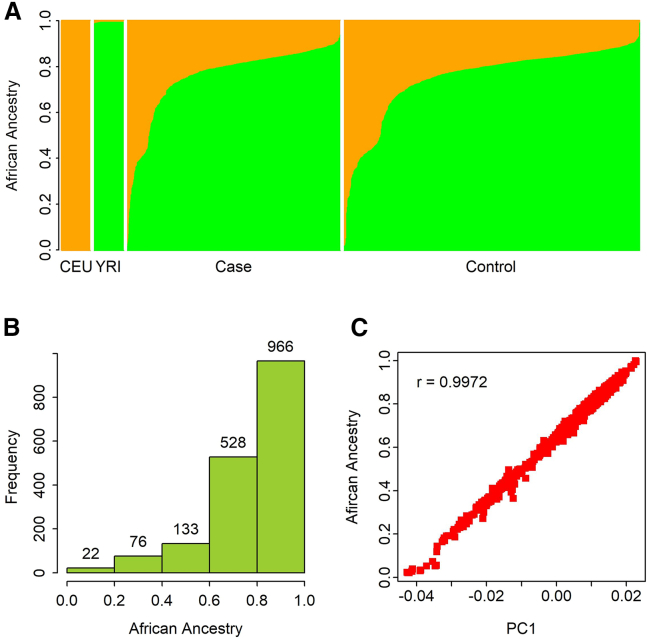
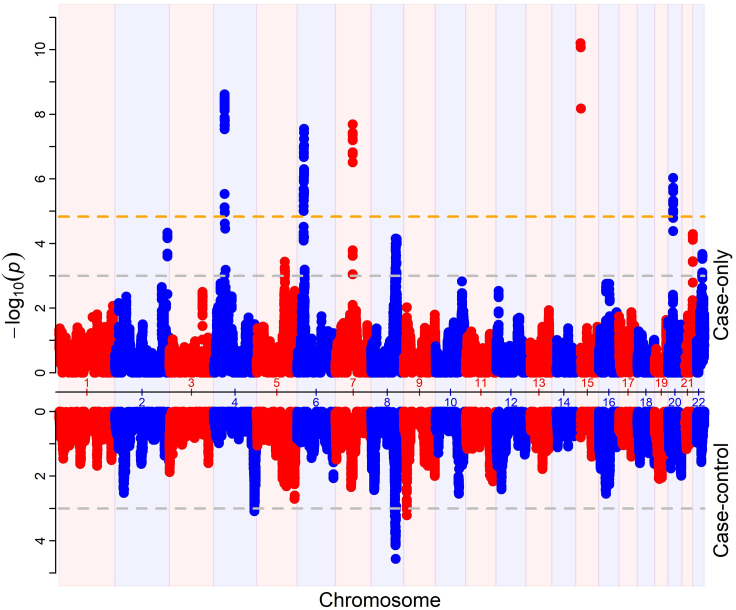
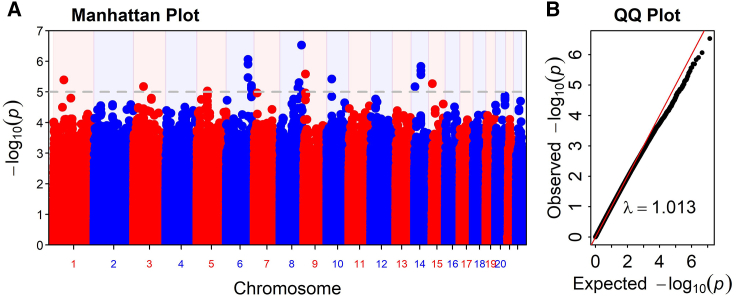
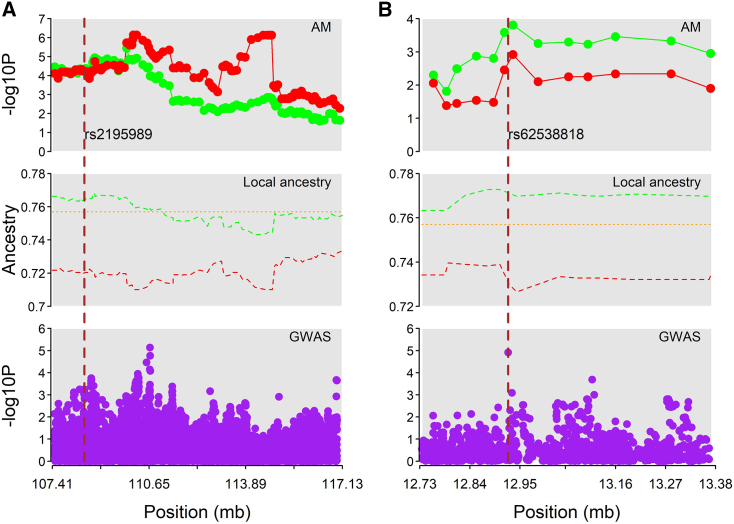
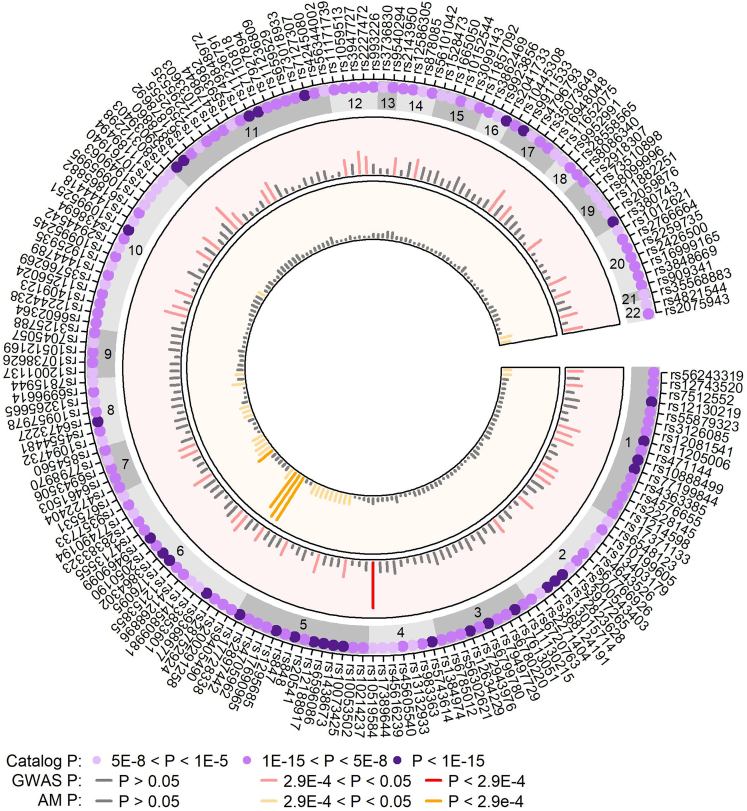
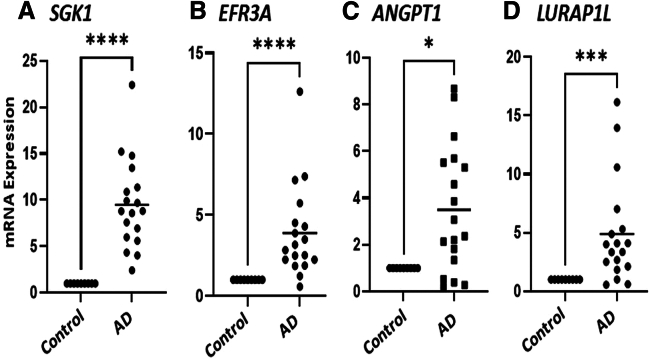
Atopic dermatitis (AD) is a chronic itchy inflammatory disease of the skin. Genetic studies have identified multiple risk factors linked to the disease; however, most of the studies have been derived from European and East Asian populations. The admixed African American (AA) genome may provide an opportunity to discovery ancestry-specific loci involved in AD susceptibility. Herein, we present joint analysis of ancestry and genotype effects followed by validation using differential gene expression analysis on AD using 726 AD-affected individuals and 999 non-AD control individuals from the AA population, genotyped using Multi-Ethnic Global Array (MEGA) followed by imputation using the Consortium on Asthma among African Ancestry Populations in the Americas (CAAPA) reference panel. The joint analysis identified two novel AD-susceptibility loci, rs2195989 in gene ANGPT1 (8q23.1) and rs62538818 in the intergenic region between genes LURAP1L and MPDZ (9p23). Admixture mapping (AM) results showed potential genomic inflation, and we implemented genomic control and identified five ancestry-of-origin loci with European ancestry effects. The multi-omics functional prioritization of variants in AM signals prioritized the loci SLAIN2, RNF39, and FOXA2. Genome-wide association study (GWAS) identified variants significantly associated with AD in the AA population, including SGK1 (rs113357522, odds ratio [OR] = 2.81), EFR3A (rs16904552, OR = 1.725), and MMP14 (rs911912, OR = 1.791). GWAS variants were common in the AA but rare in the European population, which suggests an African-ancestry-specific risk of AD. Four genes (ANGPT1, LURAP1L, EFR3A, and SGK1) were further validated using qPCR from AD and healthy skin. This study highlighted the importance of genetic studies on admixed populations, as well as local ancestry and genotype-ancestry joint effects to identify risk loci for AD.
Keywords: African American; admixed population; admixture mapping; atopic dermatitis; fine mapping; genome-wide association; joint analysis; local and global ancestry.
Copyright © 2024 The Author(s). Published by Elsevier Inc. All rights reserved.
Conflict of interest statement
Declaration of interests The authors declare no competing interests.
Figures
References
-
- Boothe W.D., Tarbox J.A., Tarbox M.B. Atopic Dermatitis: Pathophysiology. Adv. Exp. Med. Biol. 2024;1447:21–35. - PubMed
-
- Drucker A.M., Wang A.R., Li W.Q., Sevetson E., Block J.K., Qureshi A.A. The Burden of Atopic Dermatitis: Summary of a Report for the National Eczema Association. J. Invest. Dermatol. 2017;137:26–30. - PubMed
-
- Odhiambo J.A., Williams H.C., Clayton T.O., Robertson C.F., Asher M.I., ISAAC Phase Three Study Group Global variations in prevalence of eczema symptoms in children from ISAAC Phase Three. J. Allergy Clin. Immunol. 2009;124:1251–1258.e23. - PubMed
MeSH terms
Grants and funding
LinkOut - more resources
Full Text Sources
