

Brain growth until adolescence after a neonatal focal injury: sex related differences beyond lesion effect
- PMID: 39247049
- PMCID: PMC11378422
- DOI: 10.3389/fnins.2024.1405381
Brain growth until adolescence after a neonatal focal injury: sex related differences beyond lesion effect
Abstract
Introduction: Early focal brain injuries lead to long-term disabilities with frequent cognitive impairments, suggesting global dysfunction beyond the lesion. While plasticity of the immature brain promotes better learning, outcome variability across individuals is multifactorial. Males are more vulnerable to early injuries and neurodevelopmental disorders than females, but long-term sex differences in brain growth after an early focal lesion have not been described yet. With this MRI longitudinal morphometry study of brain development after a Neonatal Arterial Ischemic Stroke (NAIS), we searched for differences between males and females in the trajectories of ipsi- and contralesional gray matter growth in childhood and adolescence, while accounting for lesion characteristics.
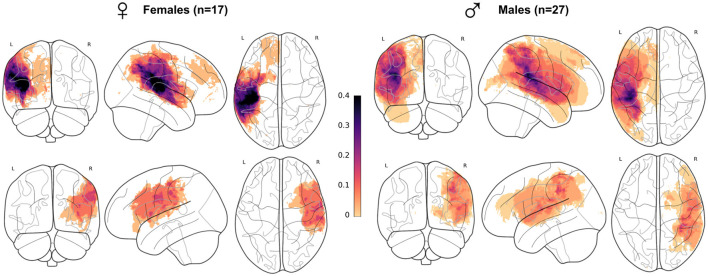
Methods: We relied on a longitudinal cohort (AVCnn) of patients with unilateral NAIS who underwent clinical and MRI assessments at ages 7 and 16 were compared to age-matched controls. Non-lesioned volumes of gray matter (hemispheres, lobes, regions, deep structures, cerebellum) were extracted from segmented T1 MRI images at 7 (Patients: 23 M, 16 F; Controls: 17 M, 18 F) and 16 (Patients: 18 M, 11 F; Controls: 16 M, 15 F). These volumes were analyzed using a Linear Mixed Model accounting for age, sex, and lesion characteristics.
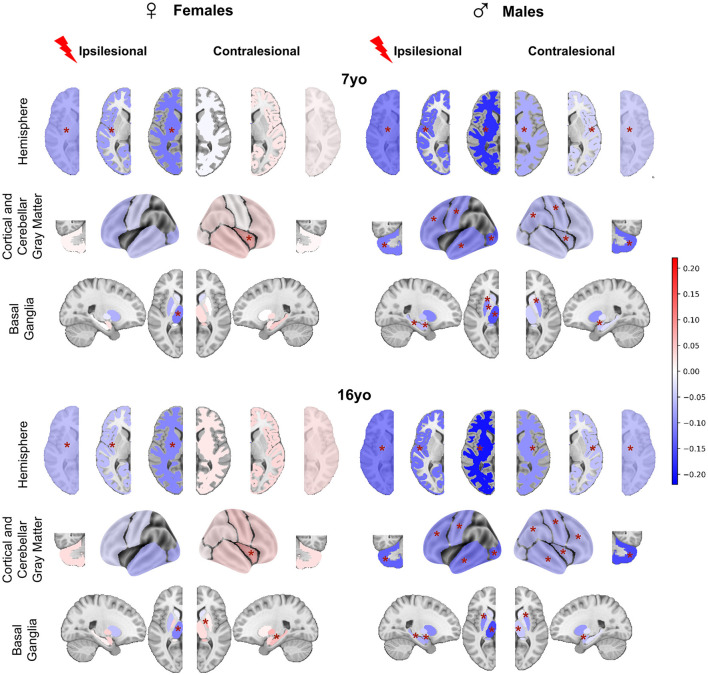
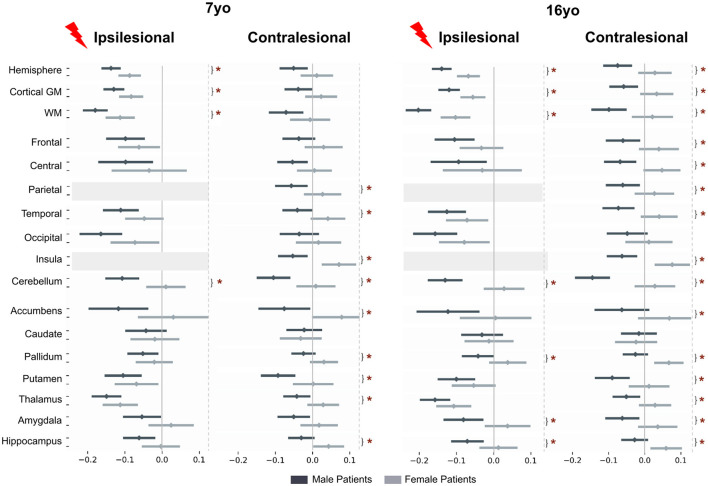
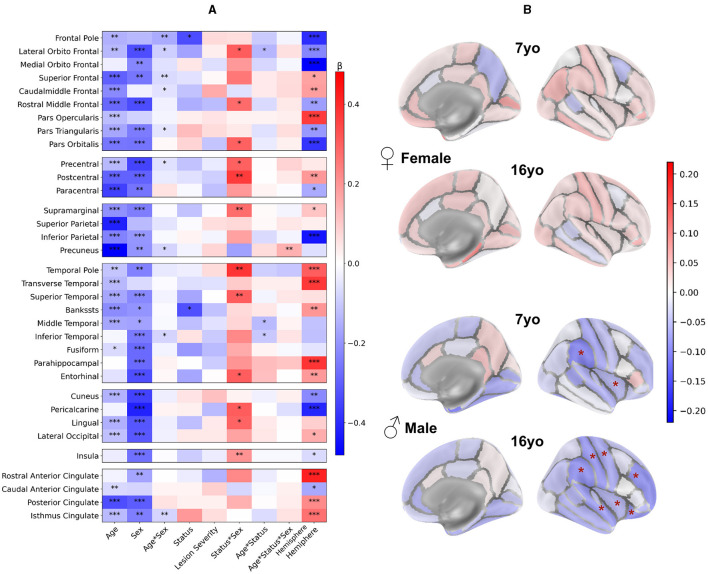
Results: Whole hemisphere volumes were reduced at both ages in patients compared to controls (gray matter volume: -16% in males, -10% in females). In ipsilesional hemisphere, cortical gray matter and thalamic volume losses (average -13%) mostly depended on lesion severity, suggesting diaschisis, with minimal effect of patient sex. In the contralesional hemisphere however, we consistently found sex differences in gray matter volumes, as only male volumes were smaller than in male controls (average -7.5%), mostly in territories mirroring the contralateral lesion. Females did not significantly deviate from the typical trajectories of female controls. Similar sex differences were found in both cerebellar hemispheres.
Discussion: These results suggest sex-dependent growth trajectories after an early brain lesion with a contralesional growth deficit in males only. The similarity of patterns at ages 7 and 16 suggests that puberty has little effect on these trajectories, and that most of the deviation in males occurs in early childhood, in line with the well-described perinatal vulnerability of the male brain, and with no compensation thereafter.
Keywords: brain growth trajectories; brain morphometry; early brain injury; male perinatal brain vulnerability; multifactorial comparative analysis; sex effect.
Copyright © 2024 Postic, Leprince, Brosset, Drutel, Peyric, Ben Abdallah, Bekha, Neumane, Duchesnay, Dinomais, Chevignard and Hertz-Pannier.
Conflict of interest statement
The authors declare that the research was conducted in the absence of any commercial or financial relationships that could be construed as a potential conflict of interest.
Figures
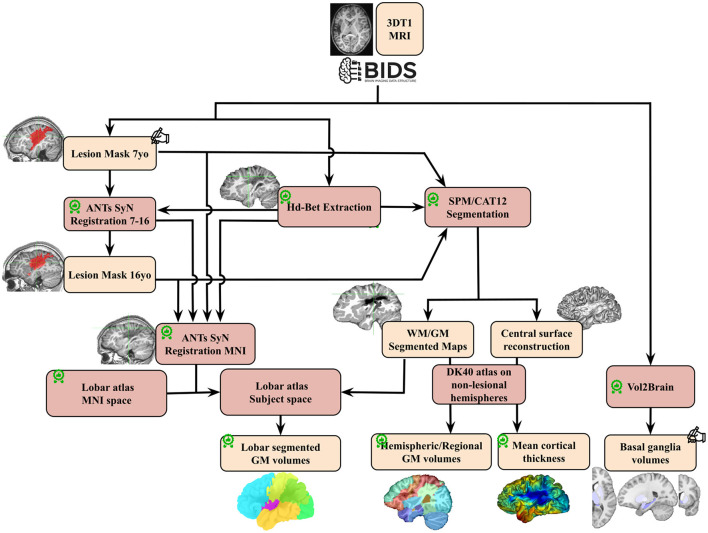
 : quality check;
  : made/corrected by trained radiologist; GM, gray matter; WM, white matter; DK 40, Desikan Atlas.
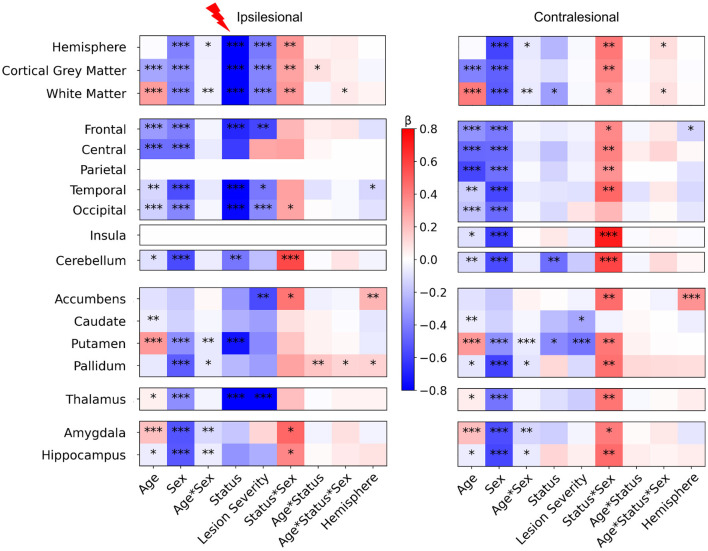
References
LinkOut - more resources
Full Text Sources